Web scraping is one of the essential methods to obtain information on a large scale. We create a program that crawls website plugins and retrieves data for use in our dataset. It is like a game of hide and seeks.
The advanced app will help people having diabetes get information about the foods they eat. Initially, the database will contain only a small number of foods.
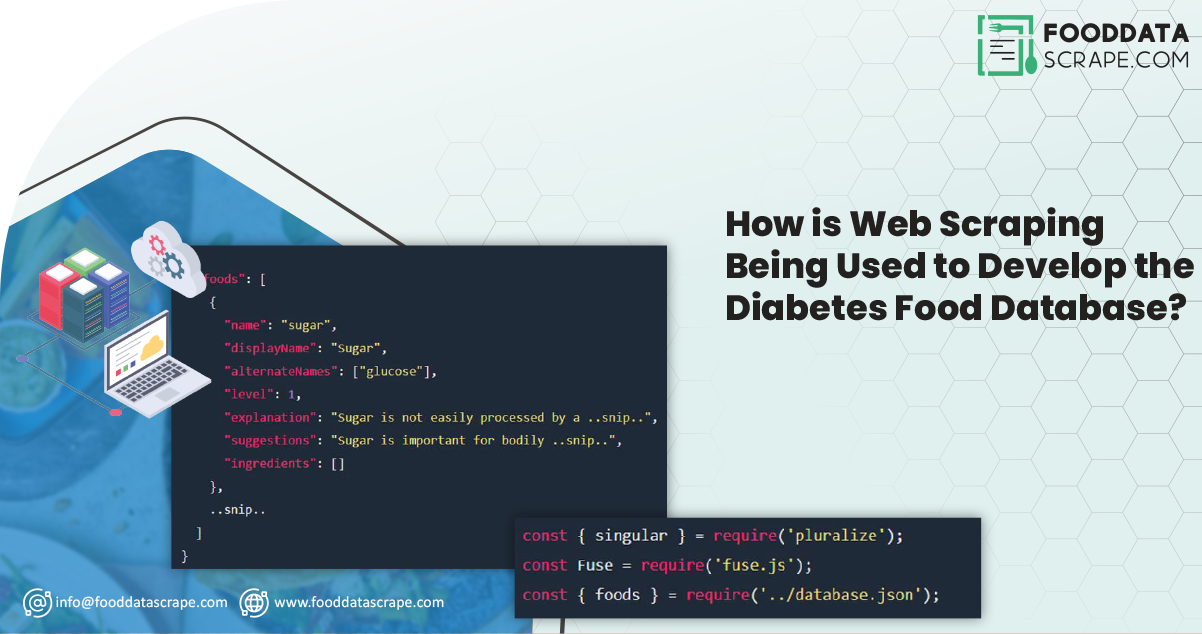
When it comes to scraping food data for people with diabetes, web scraping plays a crucial role. This involves obtaining food information such as nutritional information and ingredient lists from websites or other Internet sources. The data can be collected and compiled automatically using web scraping tools and methods such as scripts or software. The report can be used for various tasks, such as building food databases and studying nutrition trends. Read the blog to learn more about how to extract food data with food scraping API to introduce food data to diabetes.
Building the Program
Several open-source applications used in the development are Fuse, Pluralize, Axios, Icons8, and Vue. Netlify hosts the entire thing.
Three elements work together:
- Insights
- A simple Lambda function drives the backend search API.
- The responsive, user-friendly frontend line
The data
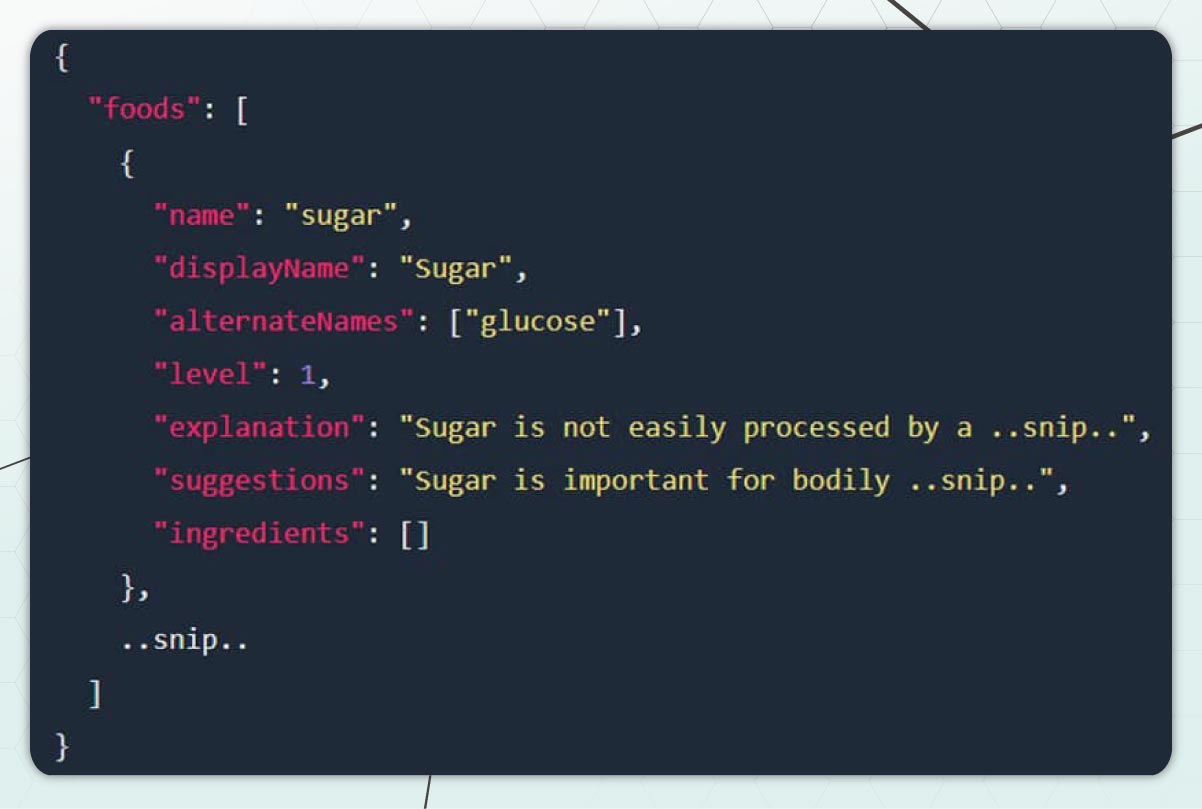
The first step is to use JSON to create a precisely organized "database" This is what it will look like:
The Backend
Once you have data structure, you can start developing the API. You can start importing the dependencies. Fuse and Pluralize facilitate the search.
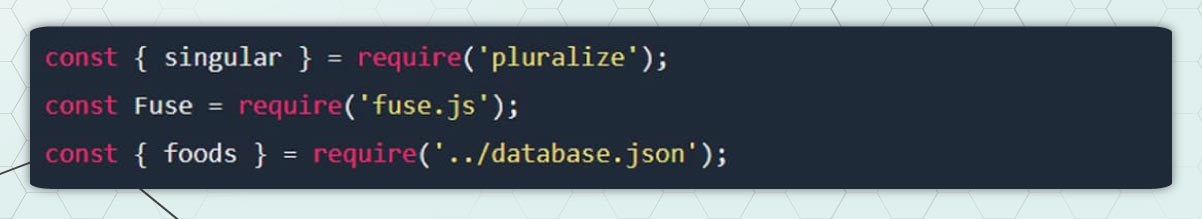
As you can see, importing the data is an option in conjunction with Fuse and Pluralize. After that, you can use the data to develop a search engine.
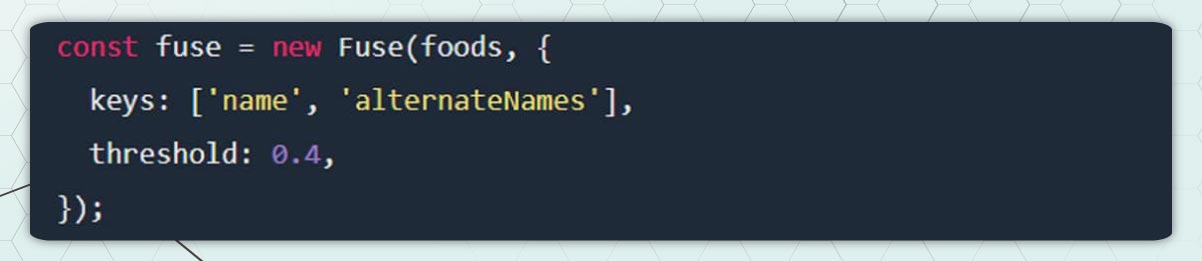
Fuse searches the keys for names and alternate names when a user performs a search, looking for exact and partial matches. The moment has come to get to work.

In the primary function, we extract the user's search query and represent it in the singular. Since they are all singular, the Pluralizes single () function converts "french fries" into "french fry," that has a higher probability of matching a name wihtin the database.
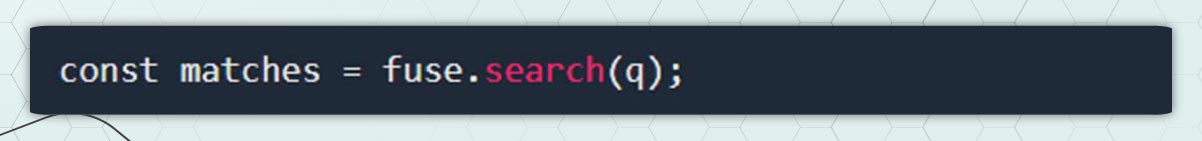
Then we utilize Fuse for the search.
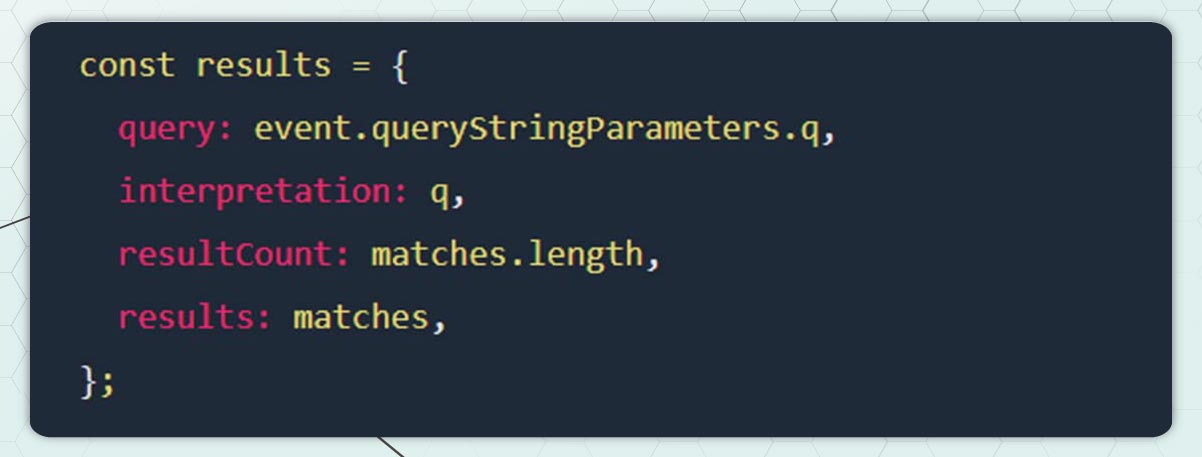
Then you can look forward to the results below:
Whenever the API gives results, it is helpful to add some metadata, such as how the query was handled (e.g., "fries" vs. "fries") and how many outcomes were available. Now that the result object is accessible, we can finally answer.
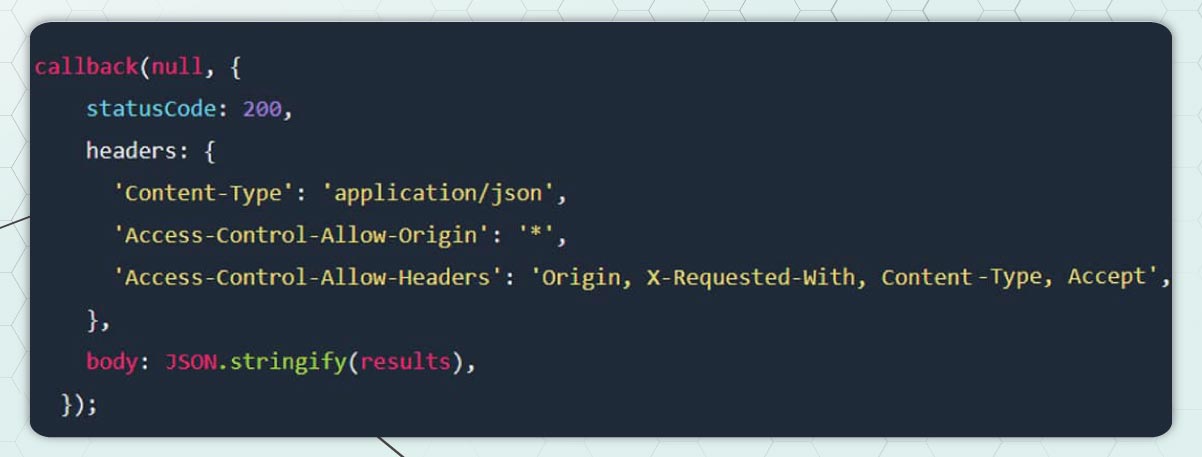
The backend search API is now ready! We told the customer that his request has been completed (status code: 200), change the type of content to JSON, and add CORS headers to make the API accessible from other places. The body of the response consists of the stringified outcomes.
Frontend
The front end was created using Vue solitary-file modules. You can create a customized solution, but the Vue CLI is an easiest way of getting started using Vue SFCs.
The app has five sections:
- The primary use
- A web search engine
- An error note is displayed if an API is not working correctly.
- A summary of the results
- A food-related map
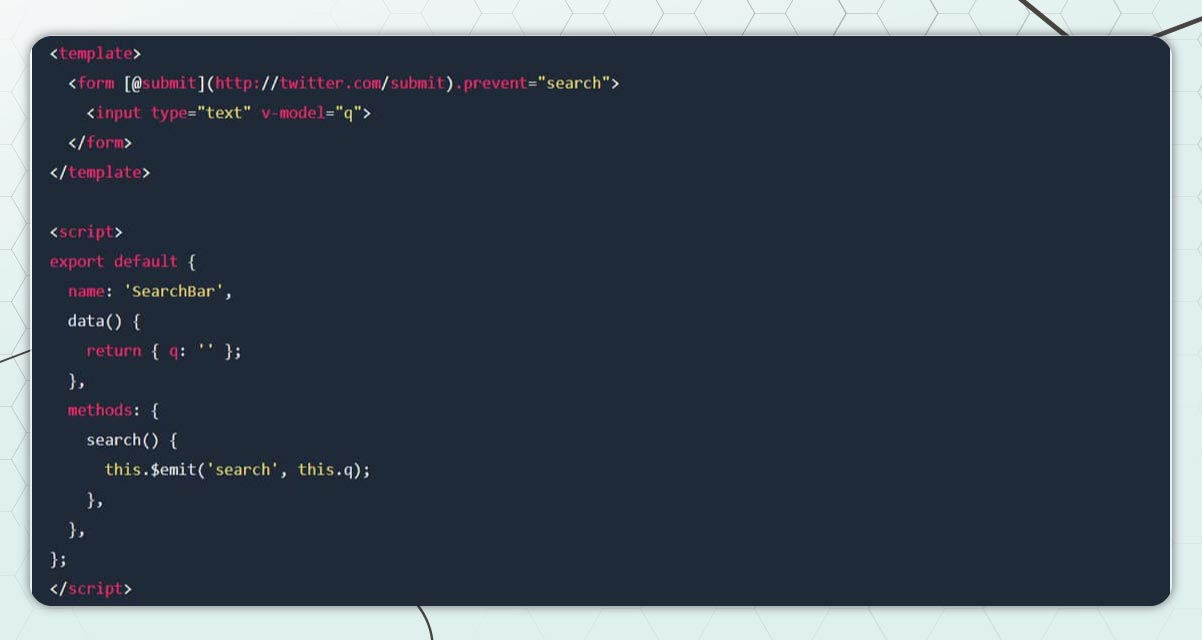
To access an API and display the results, the leading app uses Axios.
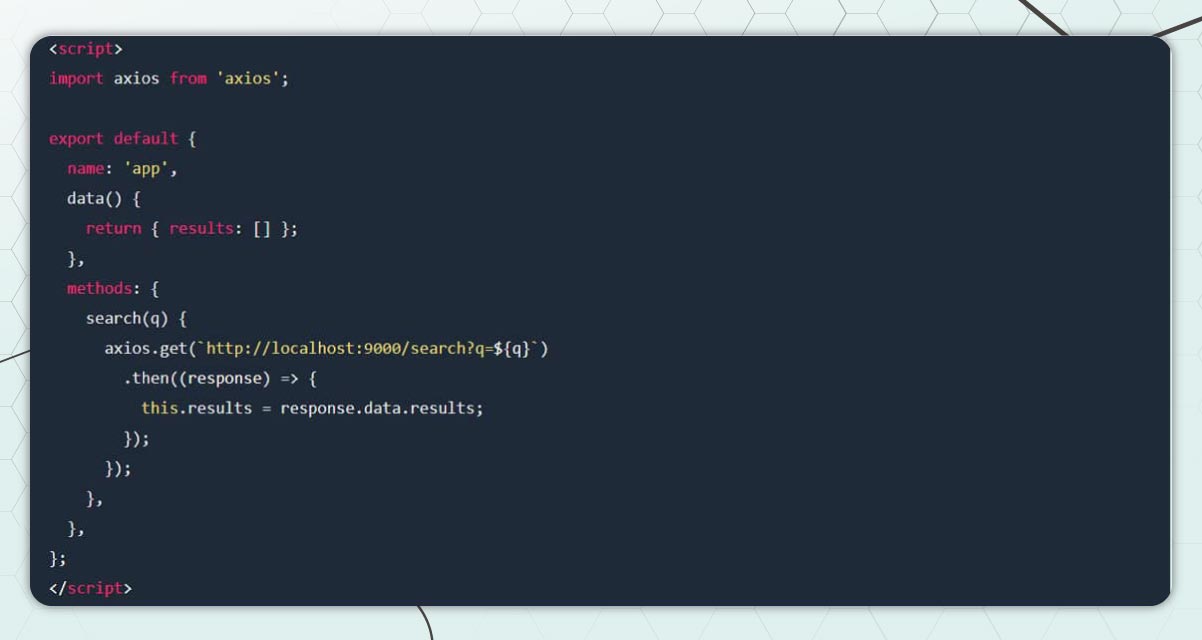
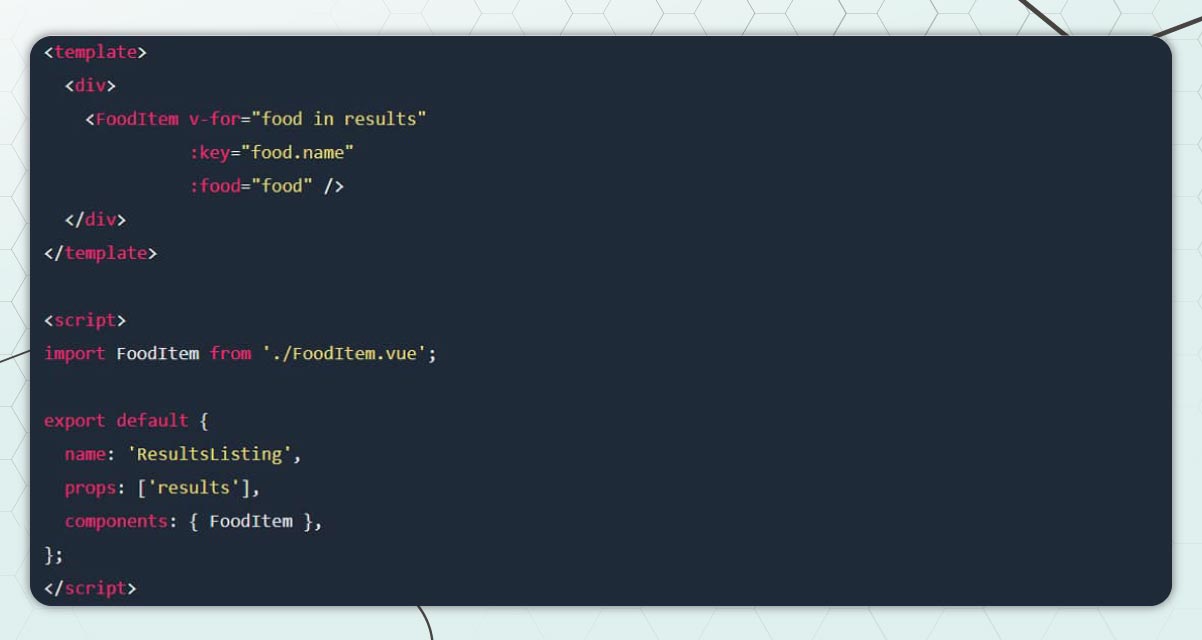
The results list component creates a food map for each development that passes. through the results.
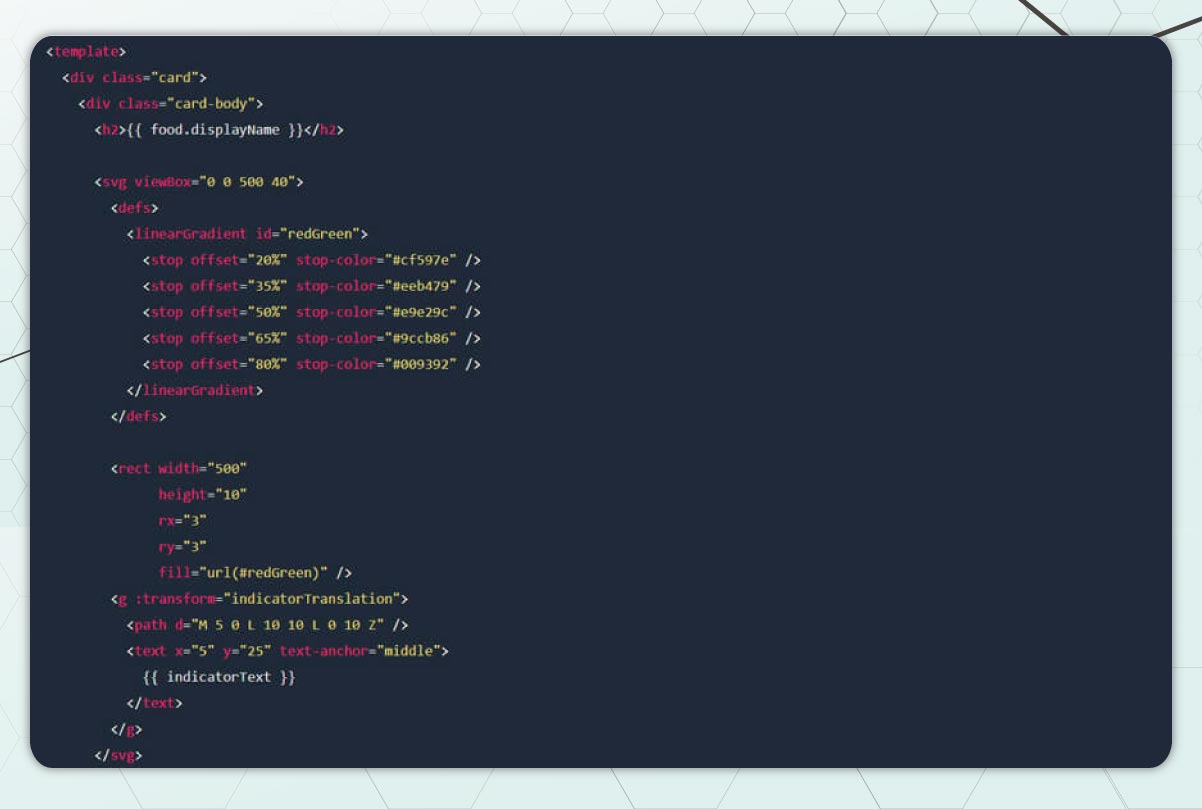
The information is displayed on the food cards, including the red-green food security map created with SVG.
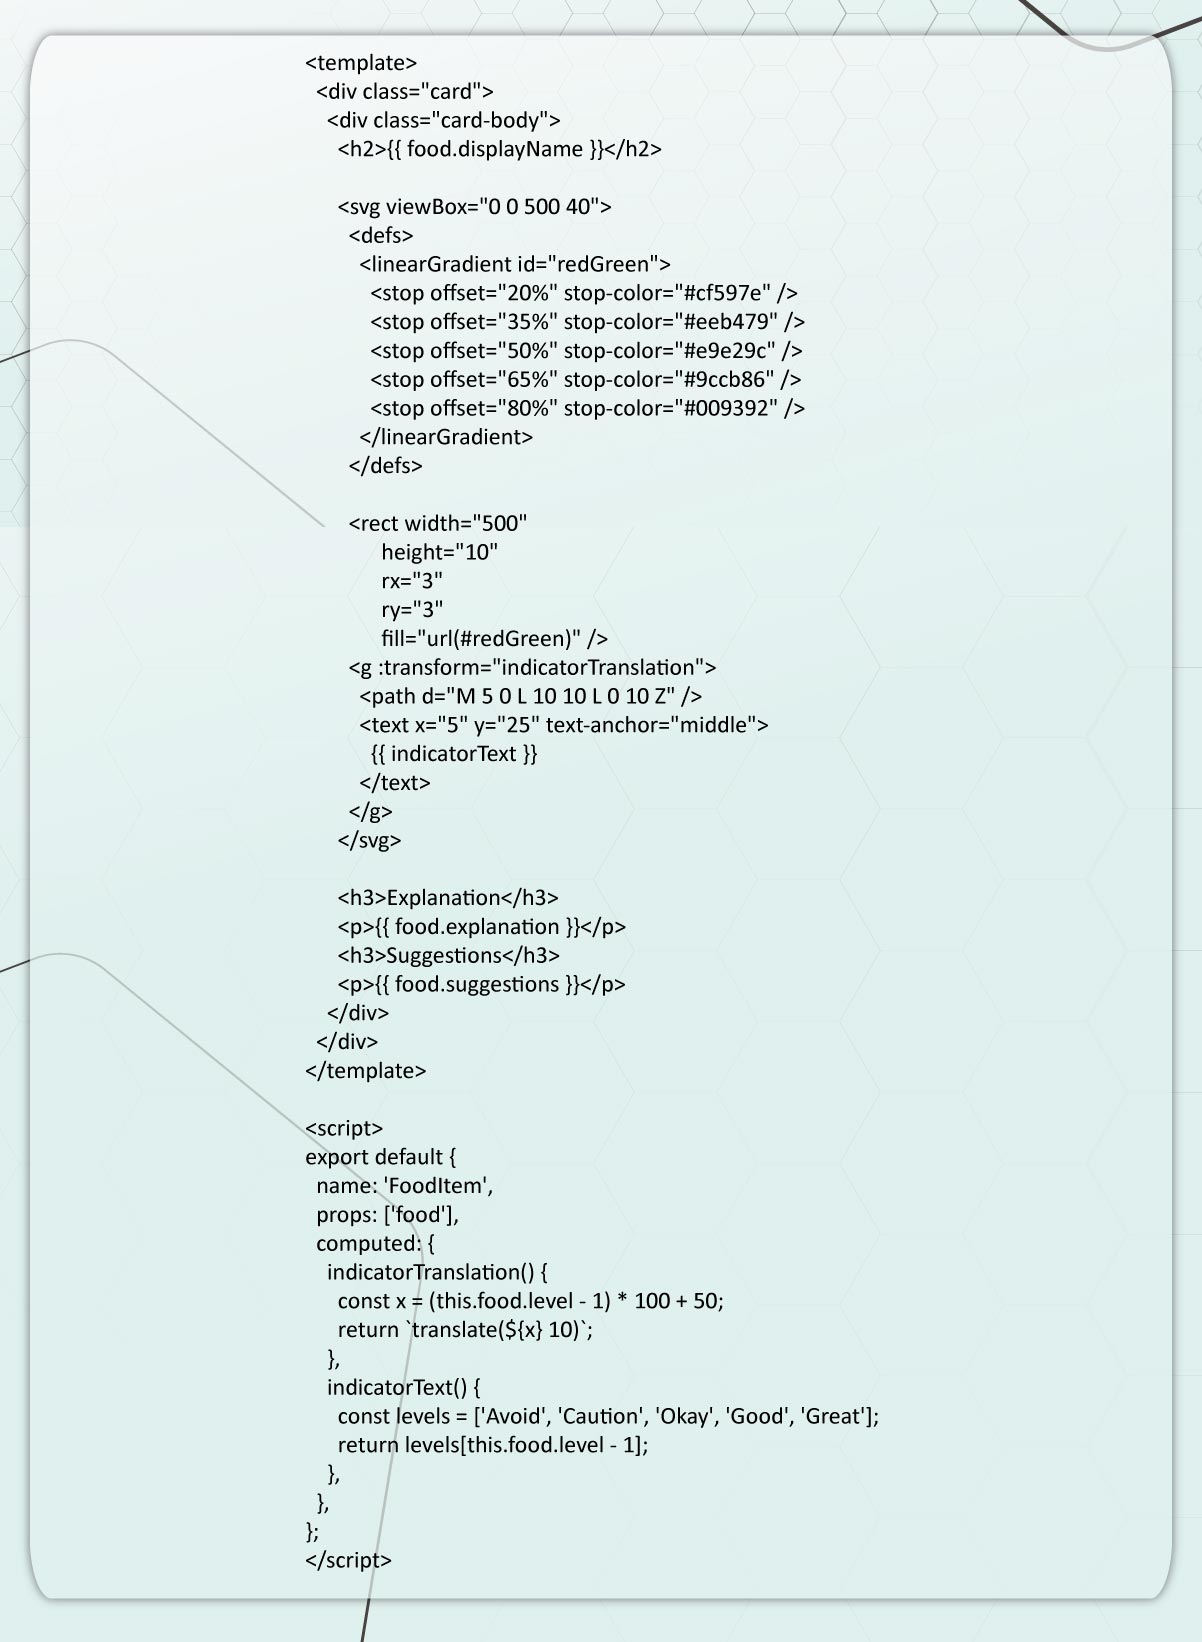
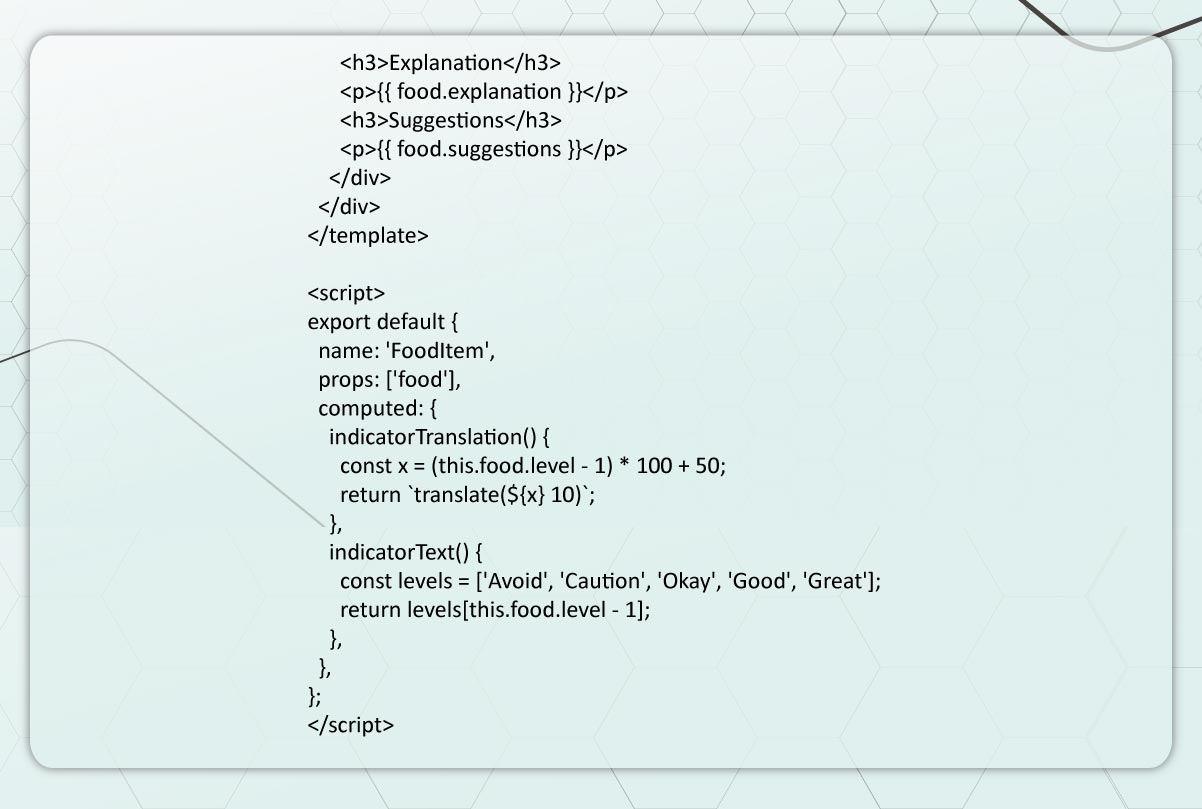
The chart is the most difficult to understand. It is composed of three parts:
- the gradient rectangle,/li>
- the triangular symbol, and/li>
- the language in the indicator ("Avoid," "Caution," etc.)/li>
The rectangle uses a linear gradient, as described in the SVG file defs >.
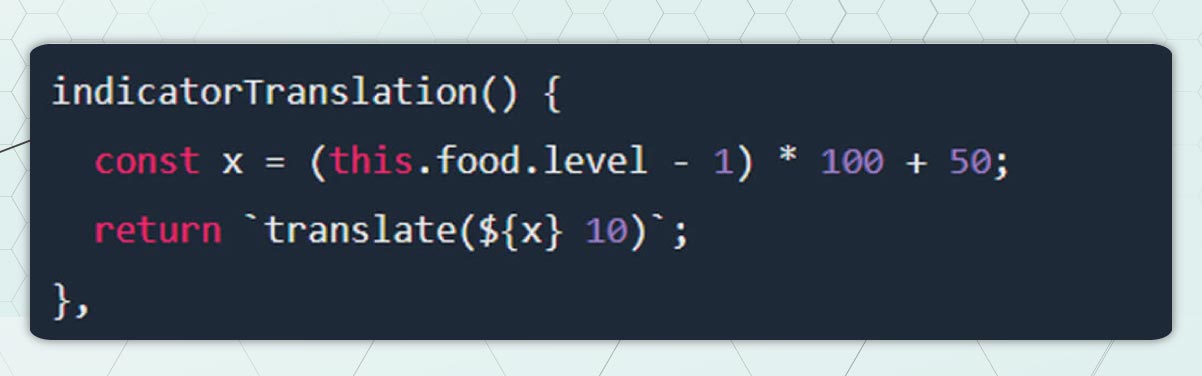
The arrangement of the indicator triangle and text makes it easy to understand. I accomplished this by grouping them with a g > and translating them with an equation.
The conversion of the y-axis is simple. To place it below the rectangle with the gradient, it was changed to a number of 10. The same thing happens every time.
However, the "level" of the food (e.g., "Avoid," "Caution," etc.) determines how the x-axis is converted.
Each dish in the database has a level ranging from 1 to 5. One is the lowest, and five is the highest. The signal for the worst foods is on the left (low number on the x-axis), and the indicator for the best food is near the right (high number on the x-axis) (high number on the x-axis).
Our SVG chart is 500 pixels wide and has 5 layers. It is recommended to create "blocks" along the width of the graph. Each block has a width of 100 pixels. The result of 500 divided by 5 is 100.
This data calculates where the layer (1-5) is multiplied by 100
It is located at the left edge of the block when we use this number as the x-axis for the indicator. By multiplying by 50 to correct this (100 / 2 = 50), we move the arrow to the center of the block.
We are almost done, but the layers in our SVG chart start at 1, and the x-axis starts at 0. In other words, one "block" of data moves everything (100 pixels). Before proceeding with the rest of the calculation, correct this by removing the 1 from the layer.
The result is an attractive map with stunning graphics.
Conclusion
Web scraping is an effective method for developing a diabetic food database. It saves time and avoids human errors by automating data collection from many sources. A diabetic food database can be frequently updated and continuously using a Food Web Data Extraction tool to ensure that the information is reliable and relevant. This database can help people with diabetes make informed decisions about their diet and manage their disease.
Do you need a reliable food data scanning service? No need to worry! Food Data Scrape has all the answers to your questions. Learn how to better manage diabetes by making smart food choices. You'll find accurate and up-to-date information based on state-of-the-art Food Data Scraping and Mobile Grocery App Scraping technologies. Start making better choices now.

