Online shopping has become a necessary part of daily life. So what should we do when we visit a food delivery portal and decide what to eat tonight?
You are right, of course! We look at the reviews first, followed by the best sellers or the best dishes, and maybe a few recent reviews, and we are done! We place an order! For an online food delivery service like ZOMATO, this is standard procedure. When we want to order food online or find new places to eat, we use Zomato. User ratings strongly influence the attractiveness of Zomato. Read on to see how the Extraction of Restaurant Reviews Data from Zomato benefits your business.
Customer reviews have a significant impact on restaurant visits and online deliveries. However, consumer perceptions of ambiance, service, and cuisine are equally important, helping restaurateurs identify and fix problems.
In this article, we walk you through the steps needed before deploying a modeling approach. For an algorithm to provide reliable results, it must be supplied with excellent data. And to obtain such, you must scrape Zomato restaurant reviews data in Bengaluru.
We have a dataset with information on about 12000 restaurants in Bengaluru (as of March 2019) and will apply various pre-processing techniques to prepare the data for further investigation.
We will show you how to quickly extract the Zomato ratings of each restaurant for further research by scraping reviews from Zomato.
Upload with preliminary data analysis
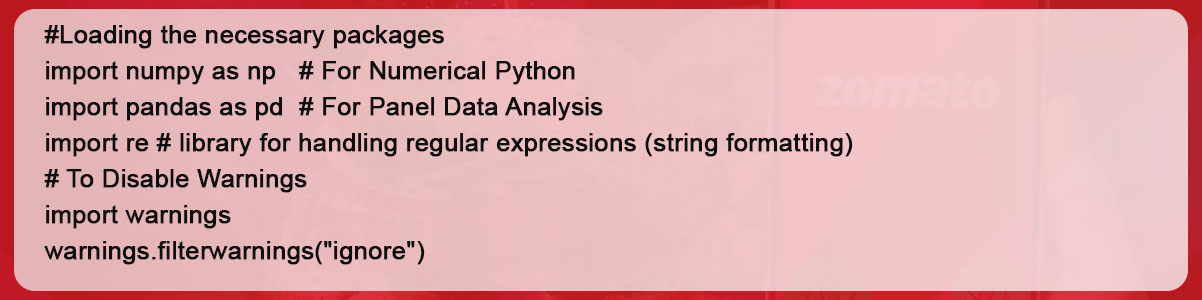
After loading the appropriate modules; you need to access the file in the Python environment with pd.read csv ().
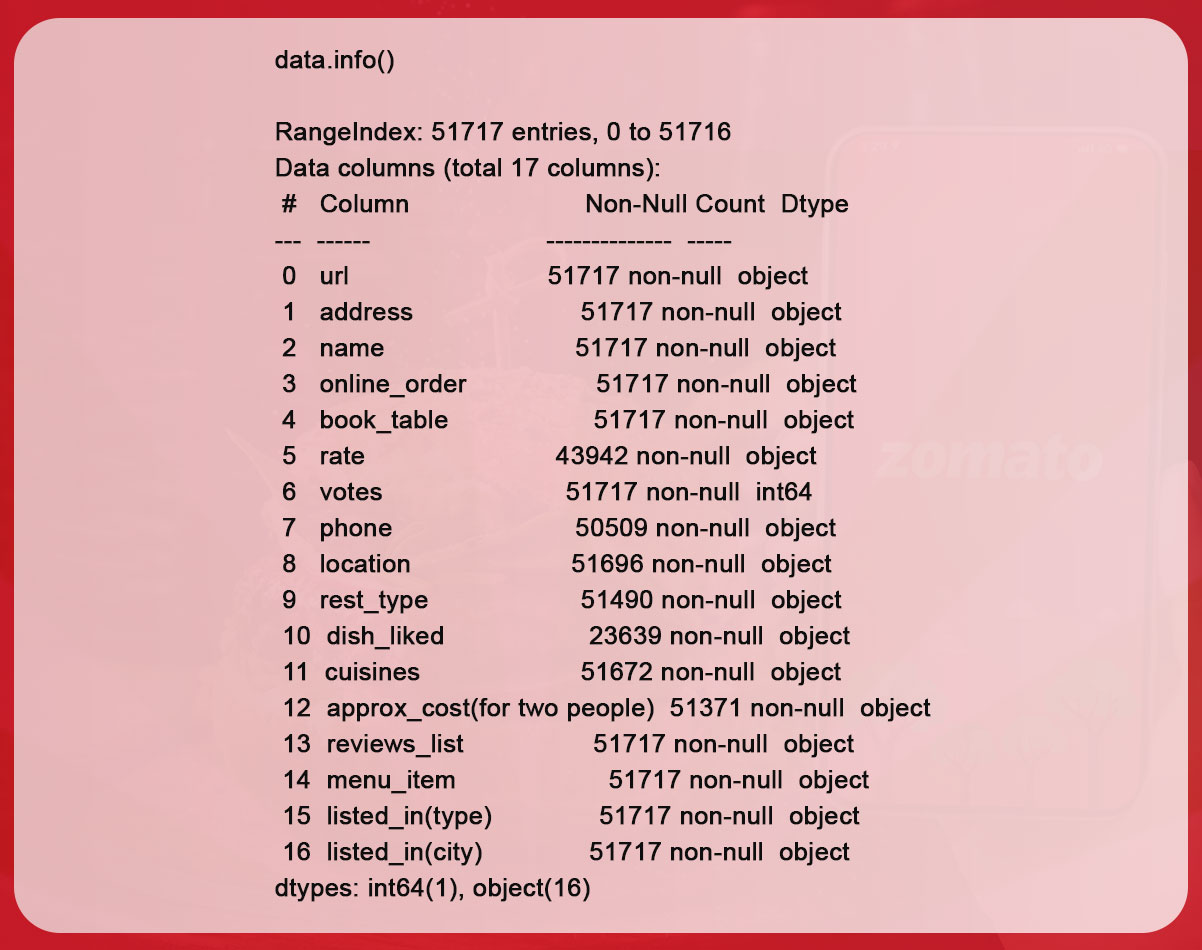
memory usage: 6.7+ MBYou get This data has 51717 lines and 17 variables (excluding votes); all other items are quantitative in nature.
Observations:
- Some data needs to be included in several fields (contact, area, tariff, dish _iked, rest _type, approx _cost, and cuisines) (for only two people).
- Approx _cost, and tariff (for only two people) must be numerical parameters; nevertheless, they were documented as objects.
After that, we use. describe() to collect more details.
data.describe(include = 'all')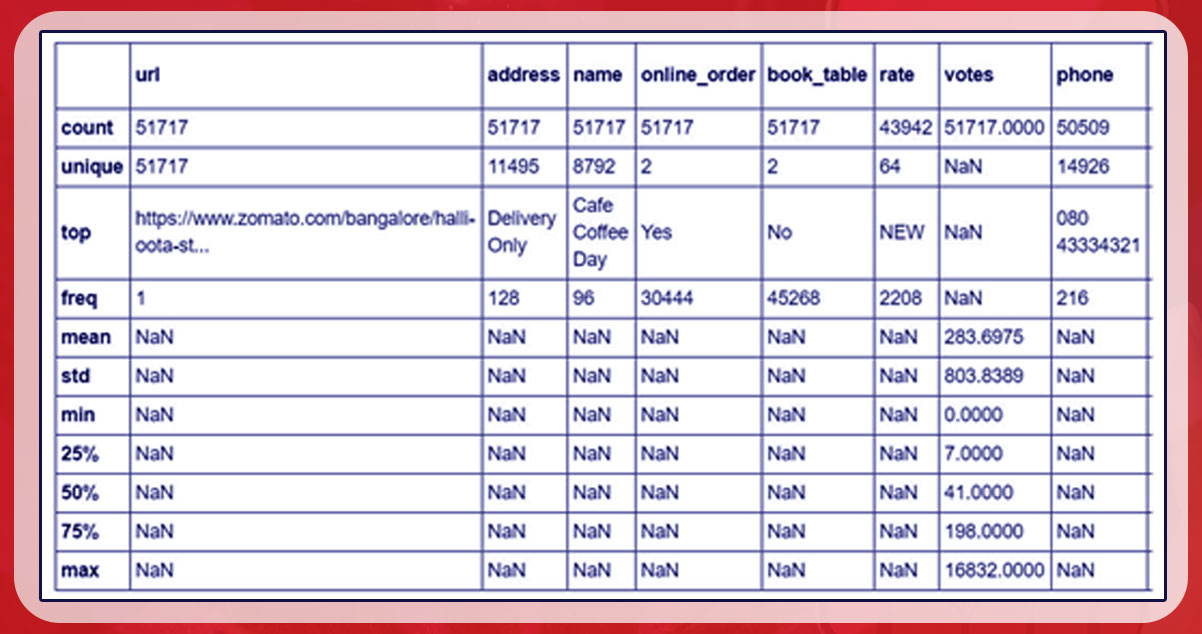
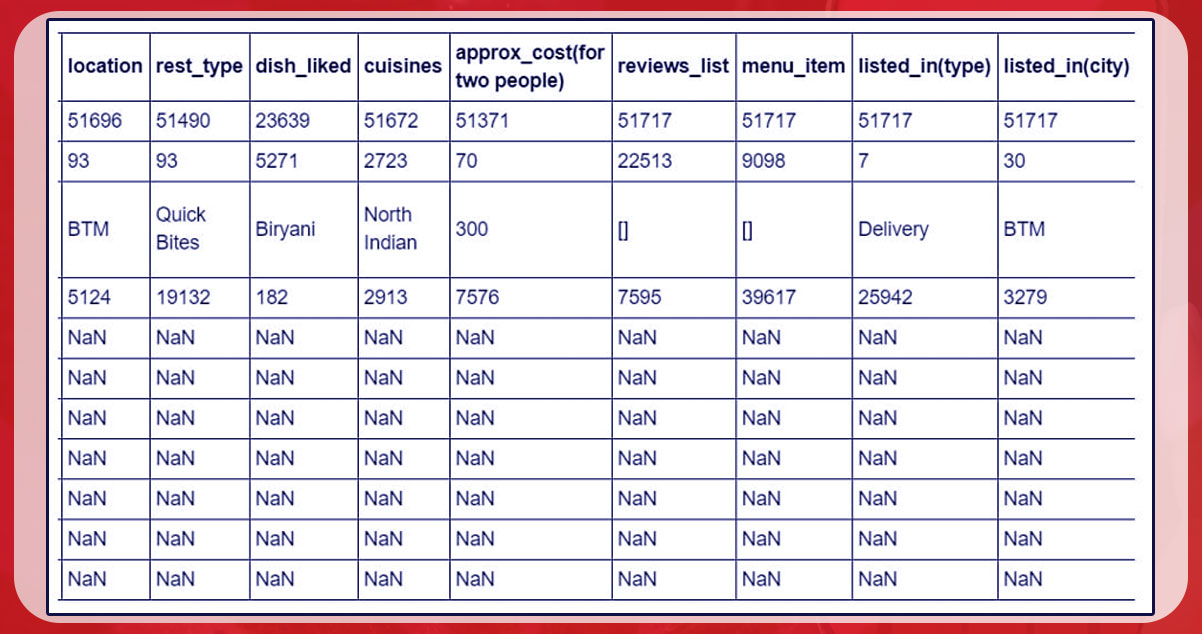
Thoughts:
- This again shows missing values.
- The data includes close locations for restaurants, as there are about 96 Cafe Coffee Day locations in Bengaluru.
- There are two variables - reserved table and online ordering - each of which can be answered yes/no.
- Possible explanations for why Python recognizes rating columns as an object data type are observations logged as "NEW", indicating that there are not enough outstanding ratings for restaurants to create an overall rating.
- The remaining columns were largely self-explanatory.
In this study, the column of reviews attracts our attention. For this reason, we will not purge or examine other variables.
Note: Use different matplotlib and seaborn plots to advance your research and gain a deeper understanding of the data. For example, when looking for particular restaurants, best cuisines, ratings between numerous locations of comparable restaurants, etc.
Restoration and preparation of the data
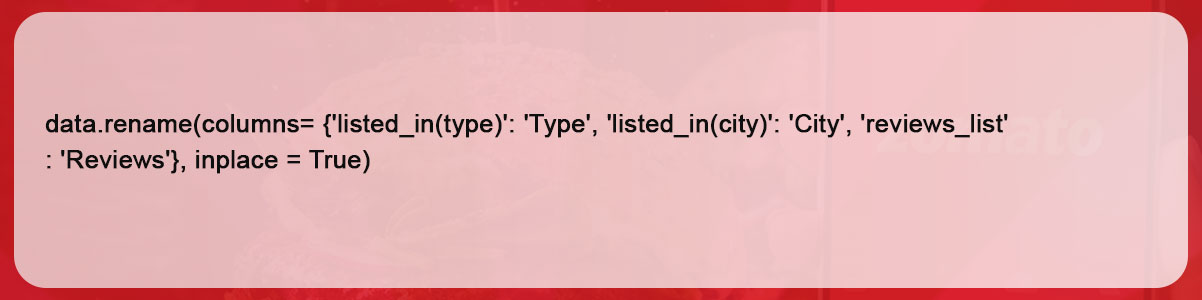
Changing the column names
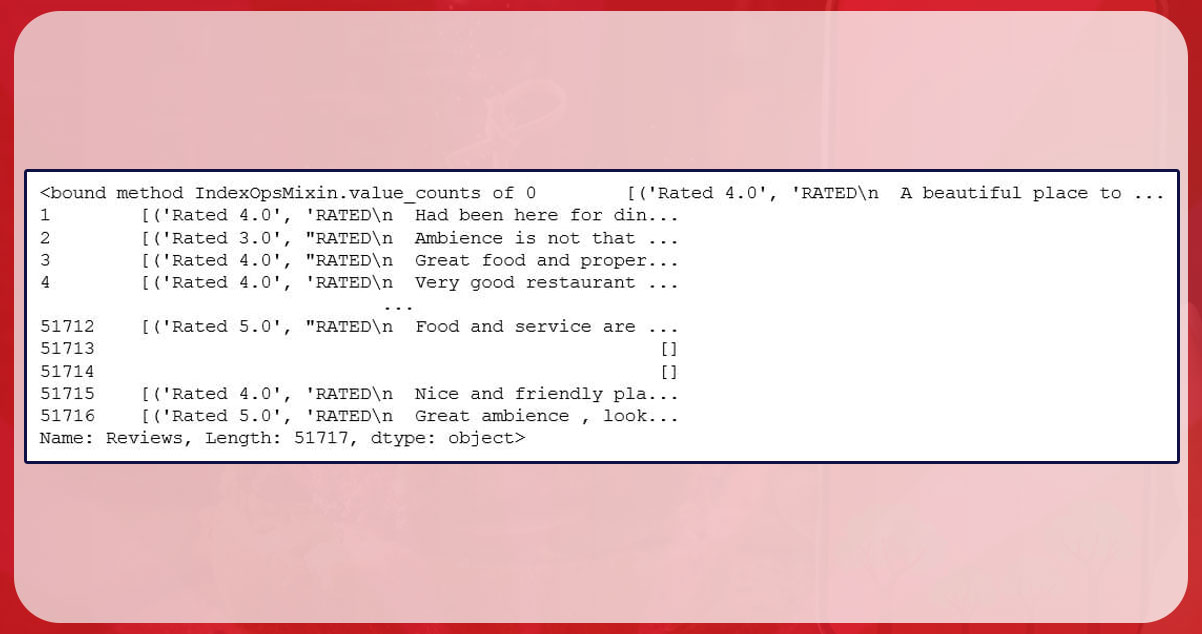
Look at the columns with the ratings.
data.Reviews.value_countsIt shows that all outlets' reviews have been recorded in the form of a list with unique ratings for each study.
Some sources do not offer ratings. You can hide these sections if necessary.
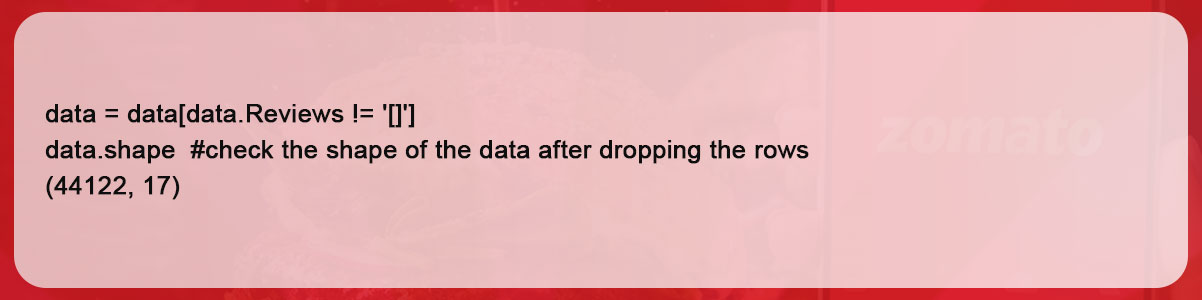
Consequently, there are now 17 columns and almost 44122 lines.
More information about the columns reviews.
Let us look at a particular restaurant's reviews and identify the methods used to obtain the data.
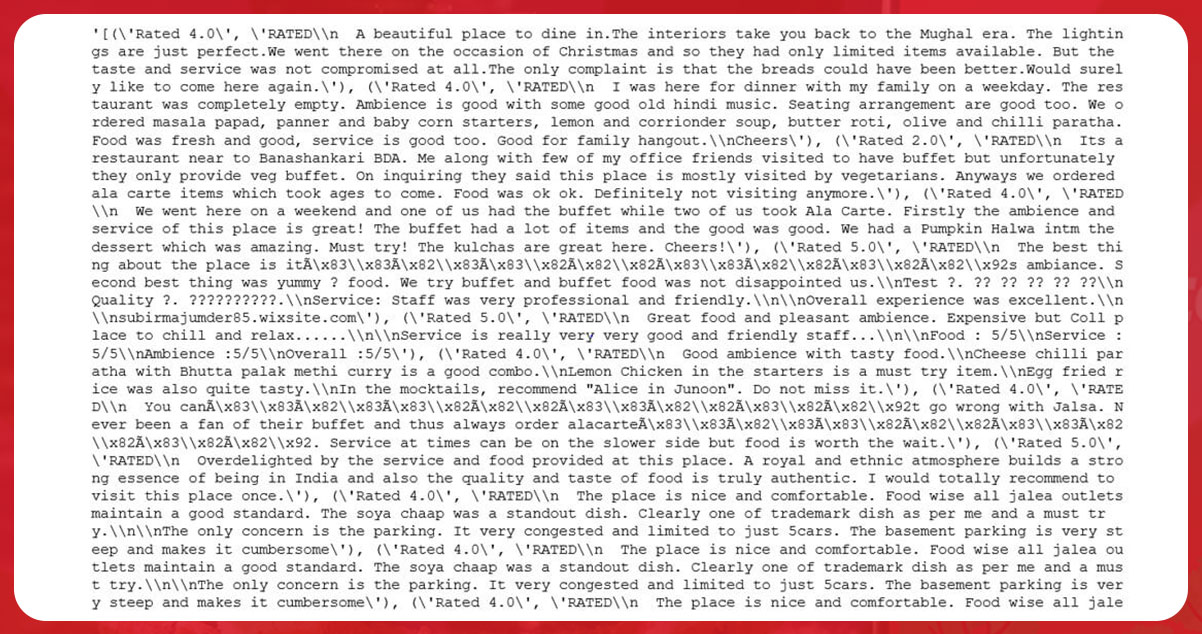
data.Reviews[0] #checking the first row of the Reviews columnIt shows how these reviews are stored as a tuple of ratings and comments for each restaurant, grouped within the list, and transmitted as a string.
For further text categorization, we needed both the individual ratings and comments for a restaurant, so we only show them here:
Keep the mandatory columns for additional analysis
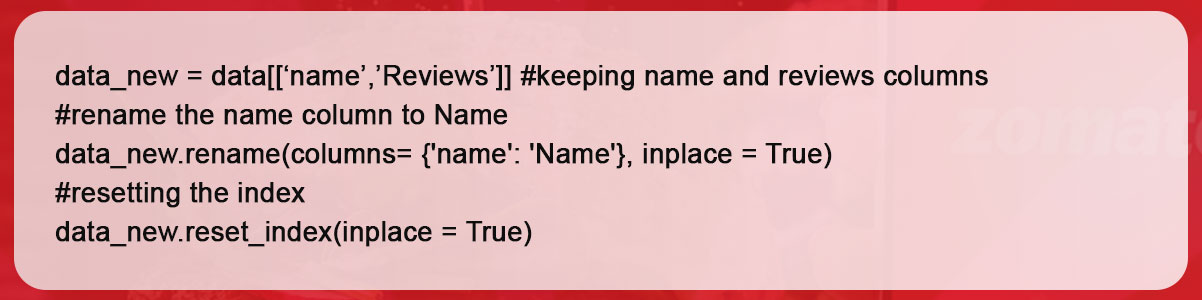
Image creation with custom functions
We will create a process that will output the reviews and ratings data frame along with the name of the restaurant, along with the length of the data frame above and the ant index values between 0 and 1. The function that accomplishes this is shown here:
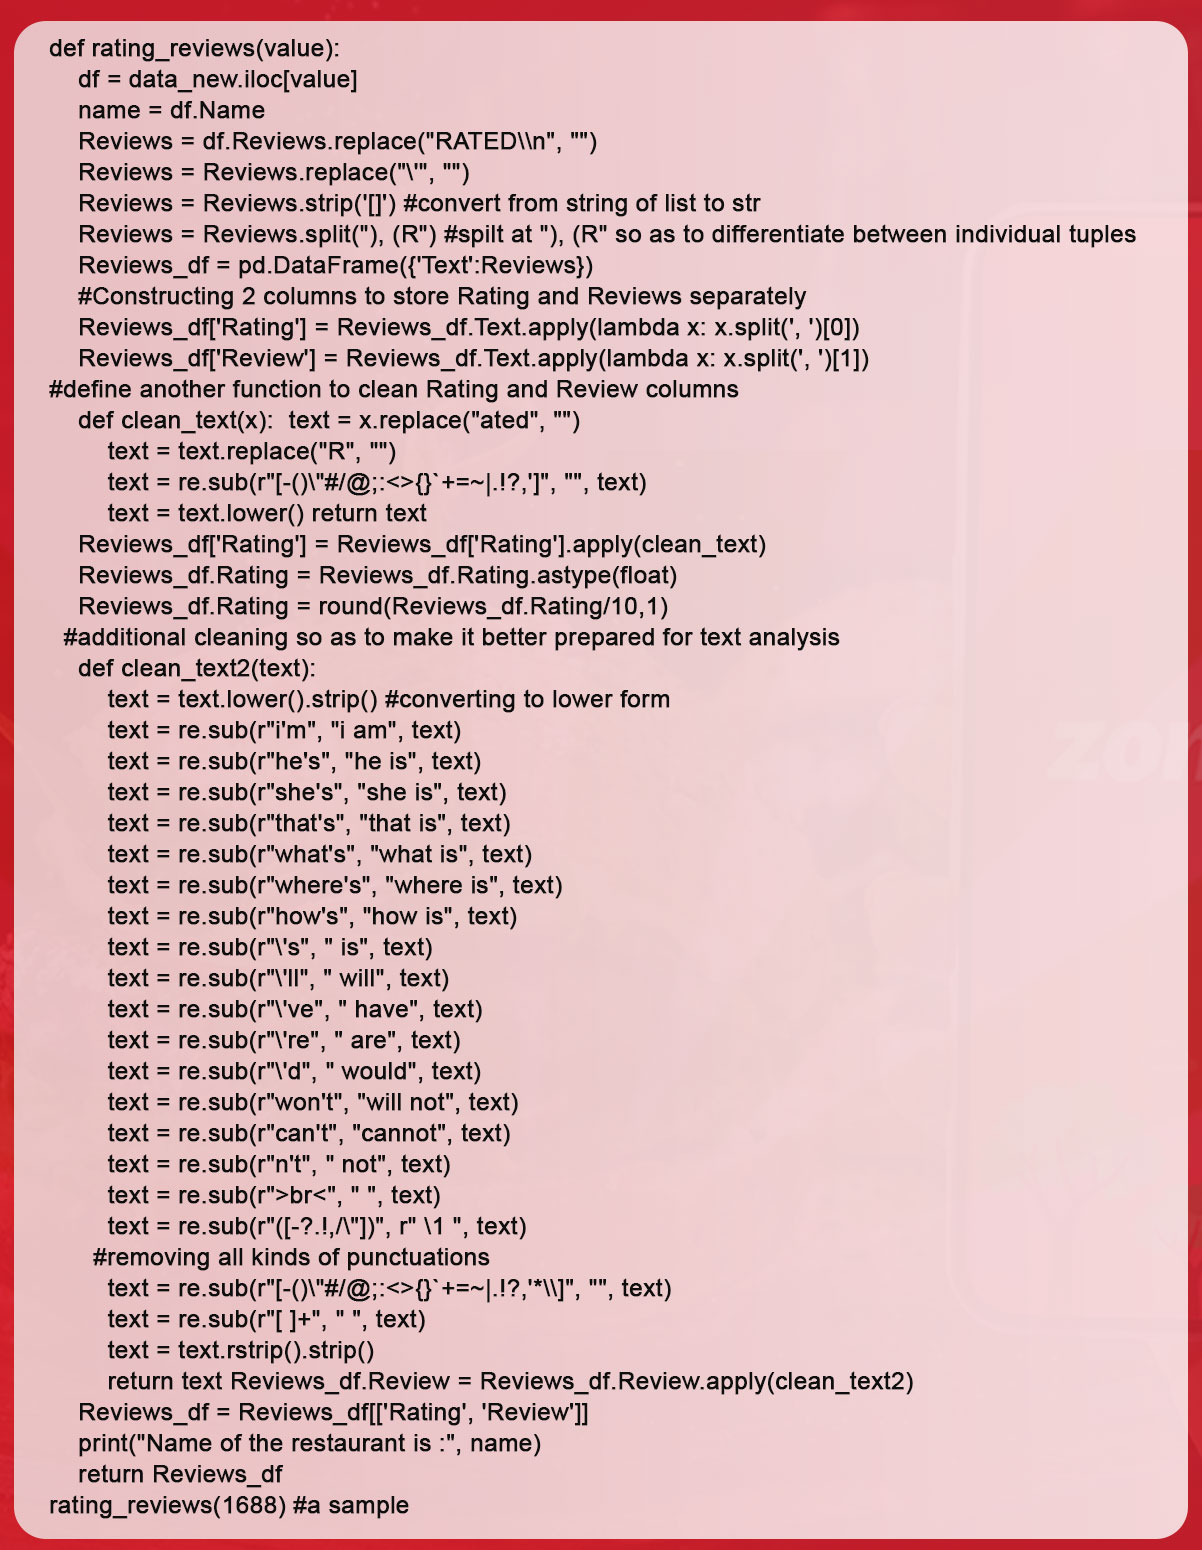
All reviews for each index (or restaurant) are collected and then cleansed to provide an orderly structure. We used the library "re" for this.
The functions may appear intimidating owing to their vastness, but once completed step by step, you will realize how simple it is.
Note: Take any restaurant and apply each line of the given functions separately to see how logical and simple it is.
Adding a personalized function
A process that takes the name of a restaurant and displays directories for all its branches, as well as the total number of ratings for all branches. This requires a particular form of the rating task, with only a small change in the return statement to capture the length of the ratings. The name of the new function is index_length ().
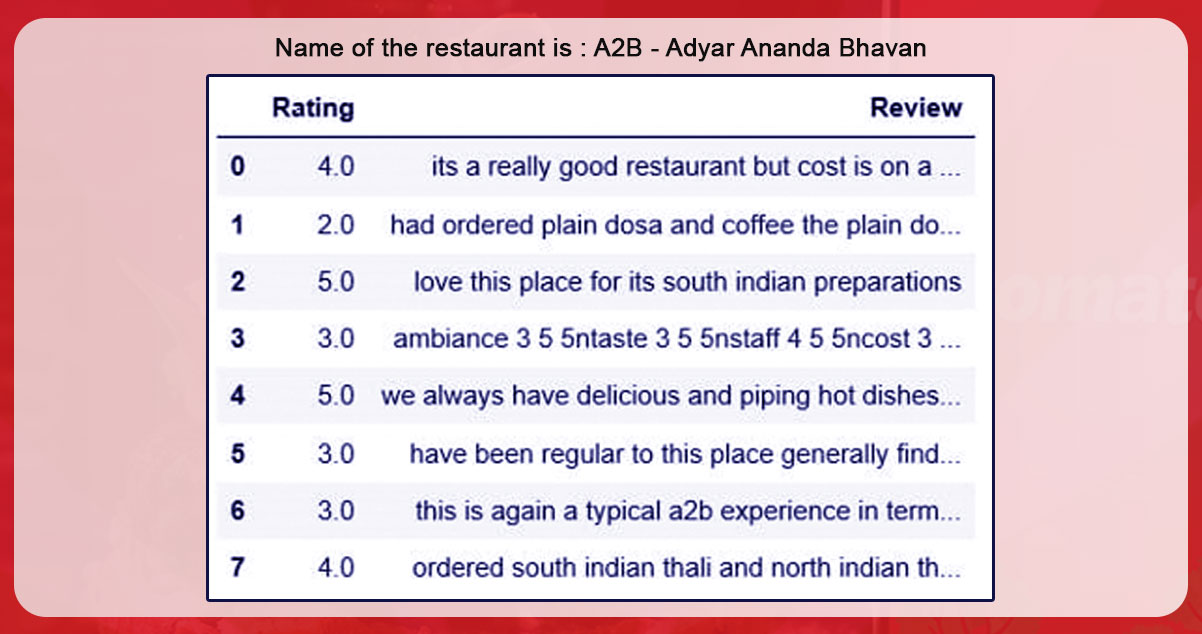
For anything you need to examine further, you simply take the index and pass it to the specified "ratings_review" task. You will then see the real ratings as well as the ratings to continue and complete the necessary analysis.

If you look closely, you can see that we just changed the function's name and the return line to mimic a function with a similar purpose.

The function provided would give us a data frame containing the price index and the sum of the ratings for each location of the specified restaurant.
Here is a snapshot of the example:
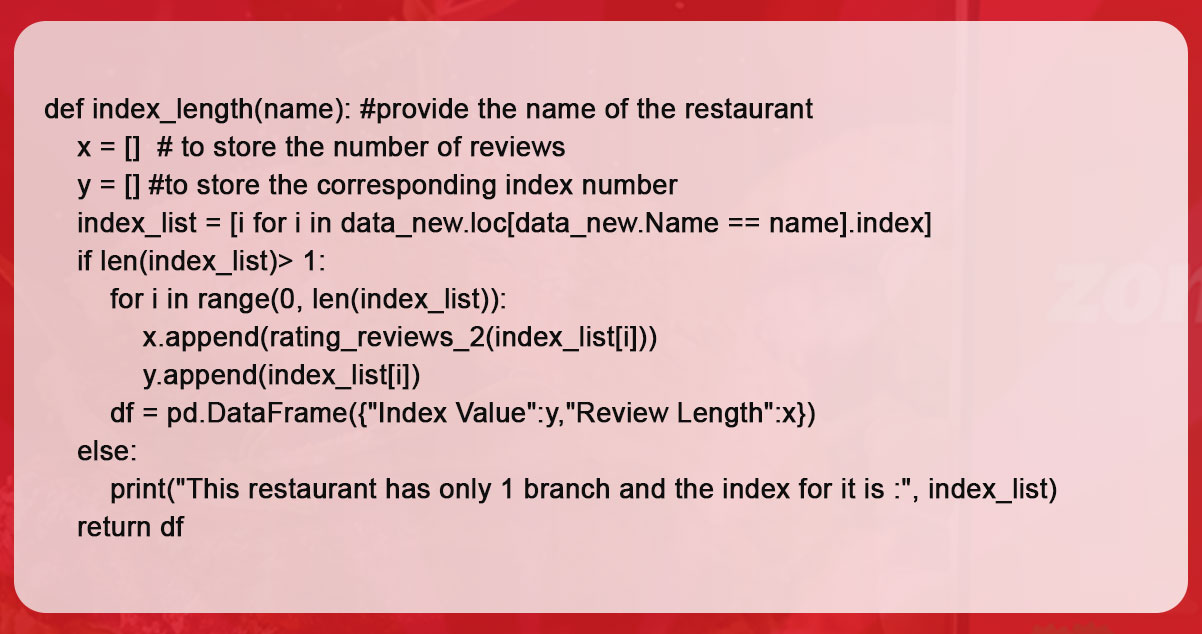
index_length("Baba Ka Dhaba")Here is how we cleaned and formatted the review data for further text analysis.
Conclusion
With the cleaned data obtained from extracting Zomato Reviews for each restaurant in Bangalore, you can perform topic analysis, word clouds, sentiment analysis (assuming the ratings are large enough for the task), and other analyses.
It is important to give a brief overview of the benefits of Scraping Zomato Restaurant Reviews. Google currently handles a significant volume of search queries on a daily basis. However, keep in mind that it is difficult to scrape zomato restaurant reviews data on your own. Therefore, you should work with a knowledgeable and experienced organization offering service for zomato restaurant and food data extraction.
Still unsure? We can help you gather the most accurate information about your food business. If you want to learn more about Food Data Scraping and Mobile Grocery App Scraping, get in touch with our specialists.

