


The Client
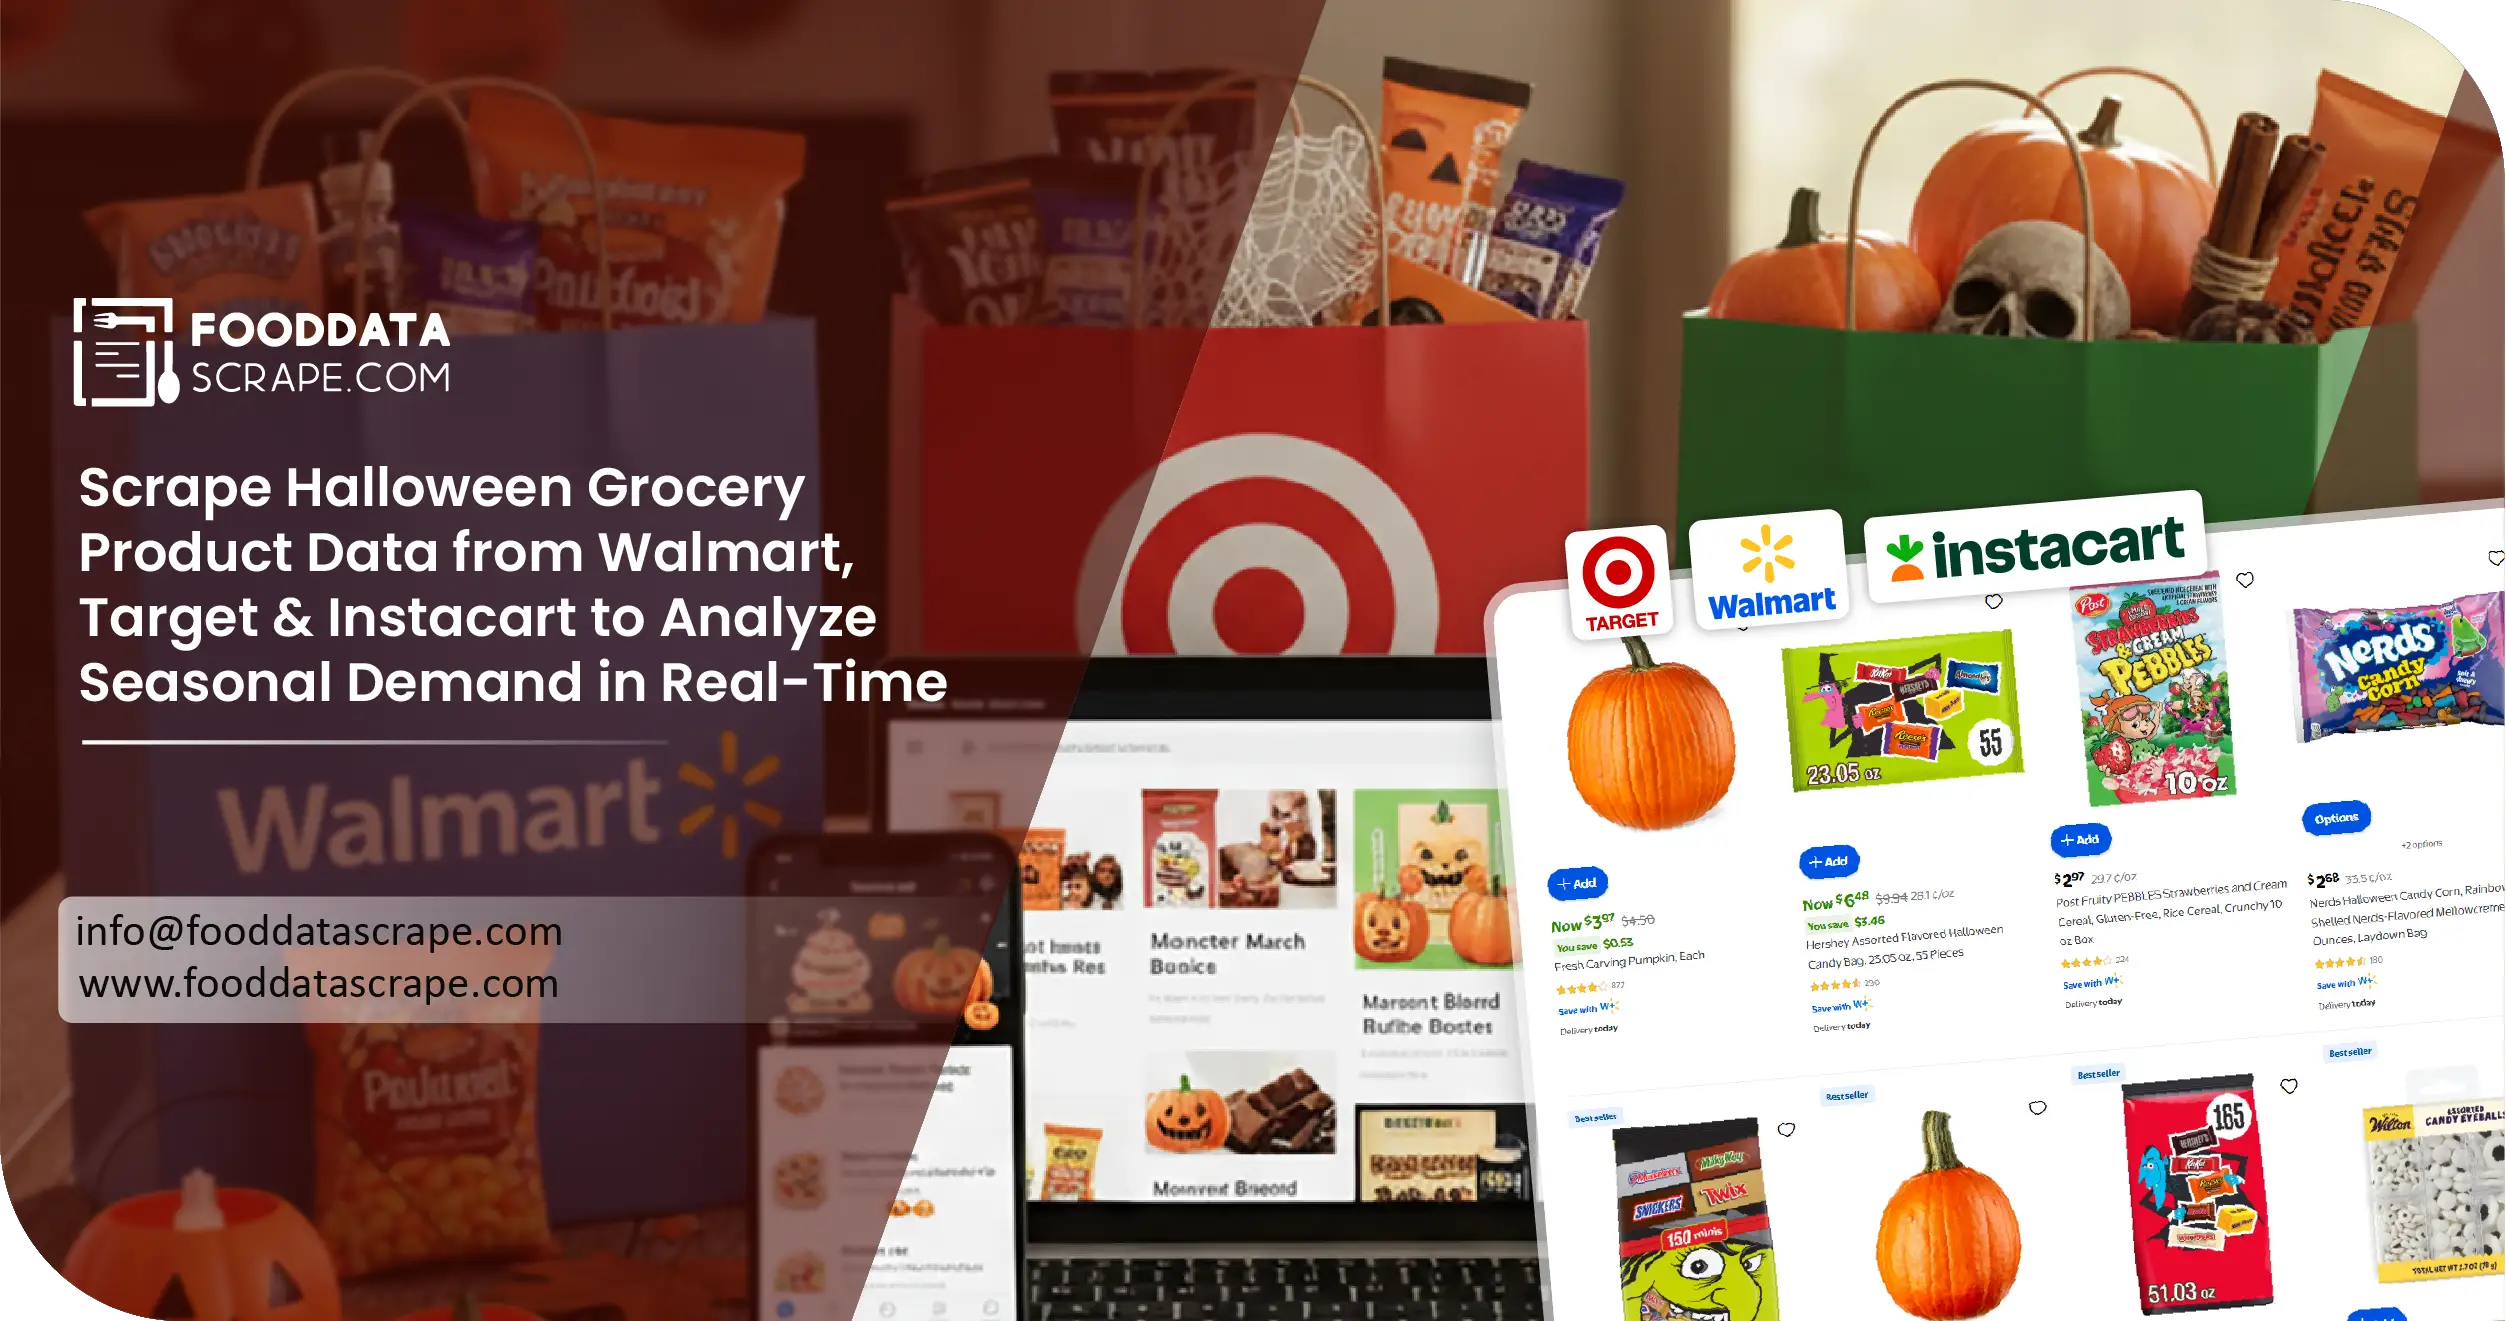
The client was a North American retail analytics company serving FMCG brands, category managers, and consumer insights teams. Ahead of Halloween 2025, they wanted to study how seasonal grocery products — from candies and beverages to bakery and décor — performed across three major eCommerce grocery platforms: Walmart, Target, and Instacart. Their goal: Capture real-time product listings and price fluctuations for Halloween-tagged SKUs, understand how seasonal demand shifted across categories and regions, and compare discount intensity, stock levels, and promotions between platforms to optimize pricing and forecast inventory.
Key Challenges
- Unstructured Product Data: Each platform uses a different structure for product titles, categories, and tags. Extracting Halloween-themed listings required keyword and taxonomy-based product scraping.
- Dynamic Stock & Pricing: Walmart, Target, and Instacart continuously change availability and prices based on location, requiring real-time scraping and data refresh cycles.
- Multi-Regional Visibility: Prices and product assortments differ by ZIP code, making regional data mapping critical for demand analysis.
- Massive Data Volume: With thousands of listings updating hourly, the client needed automated product data scraping capable of handling large-scale queries without throttling.
Key Solutions
Food Data Scrape designed a real-time grocery scraping pipeline to collect, normalize, and visualize Halloween product data from all three platforms simultaneously.
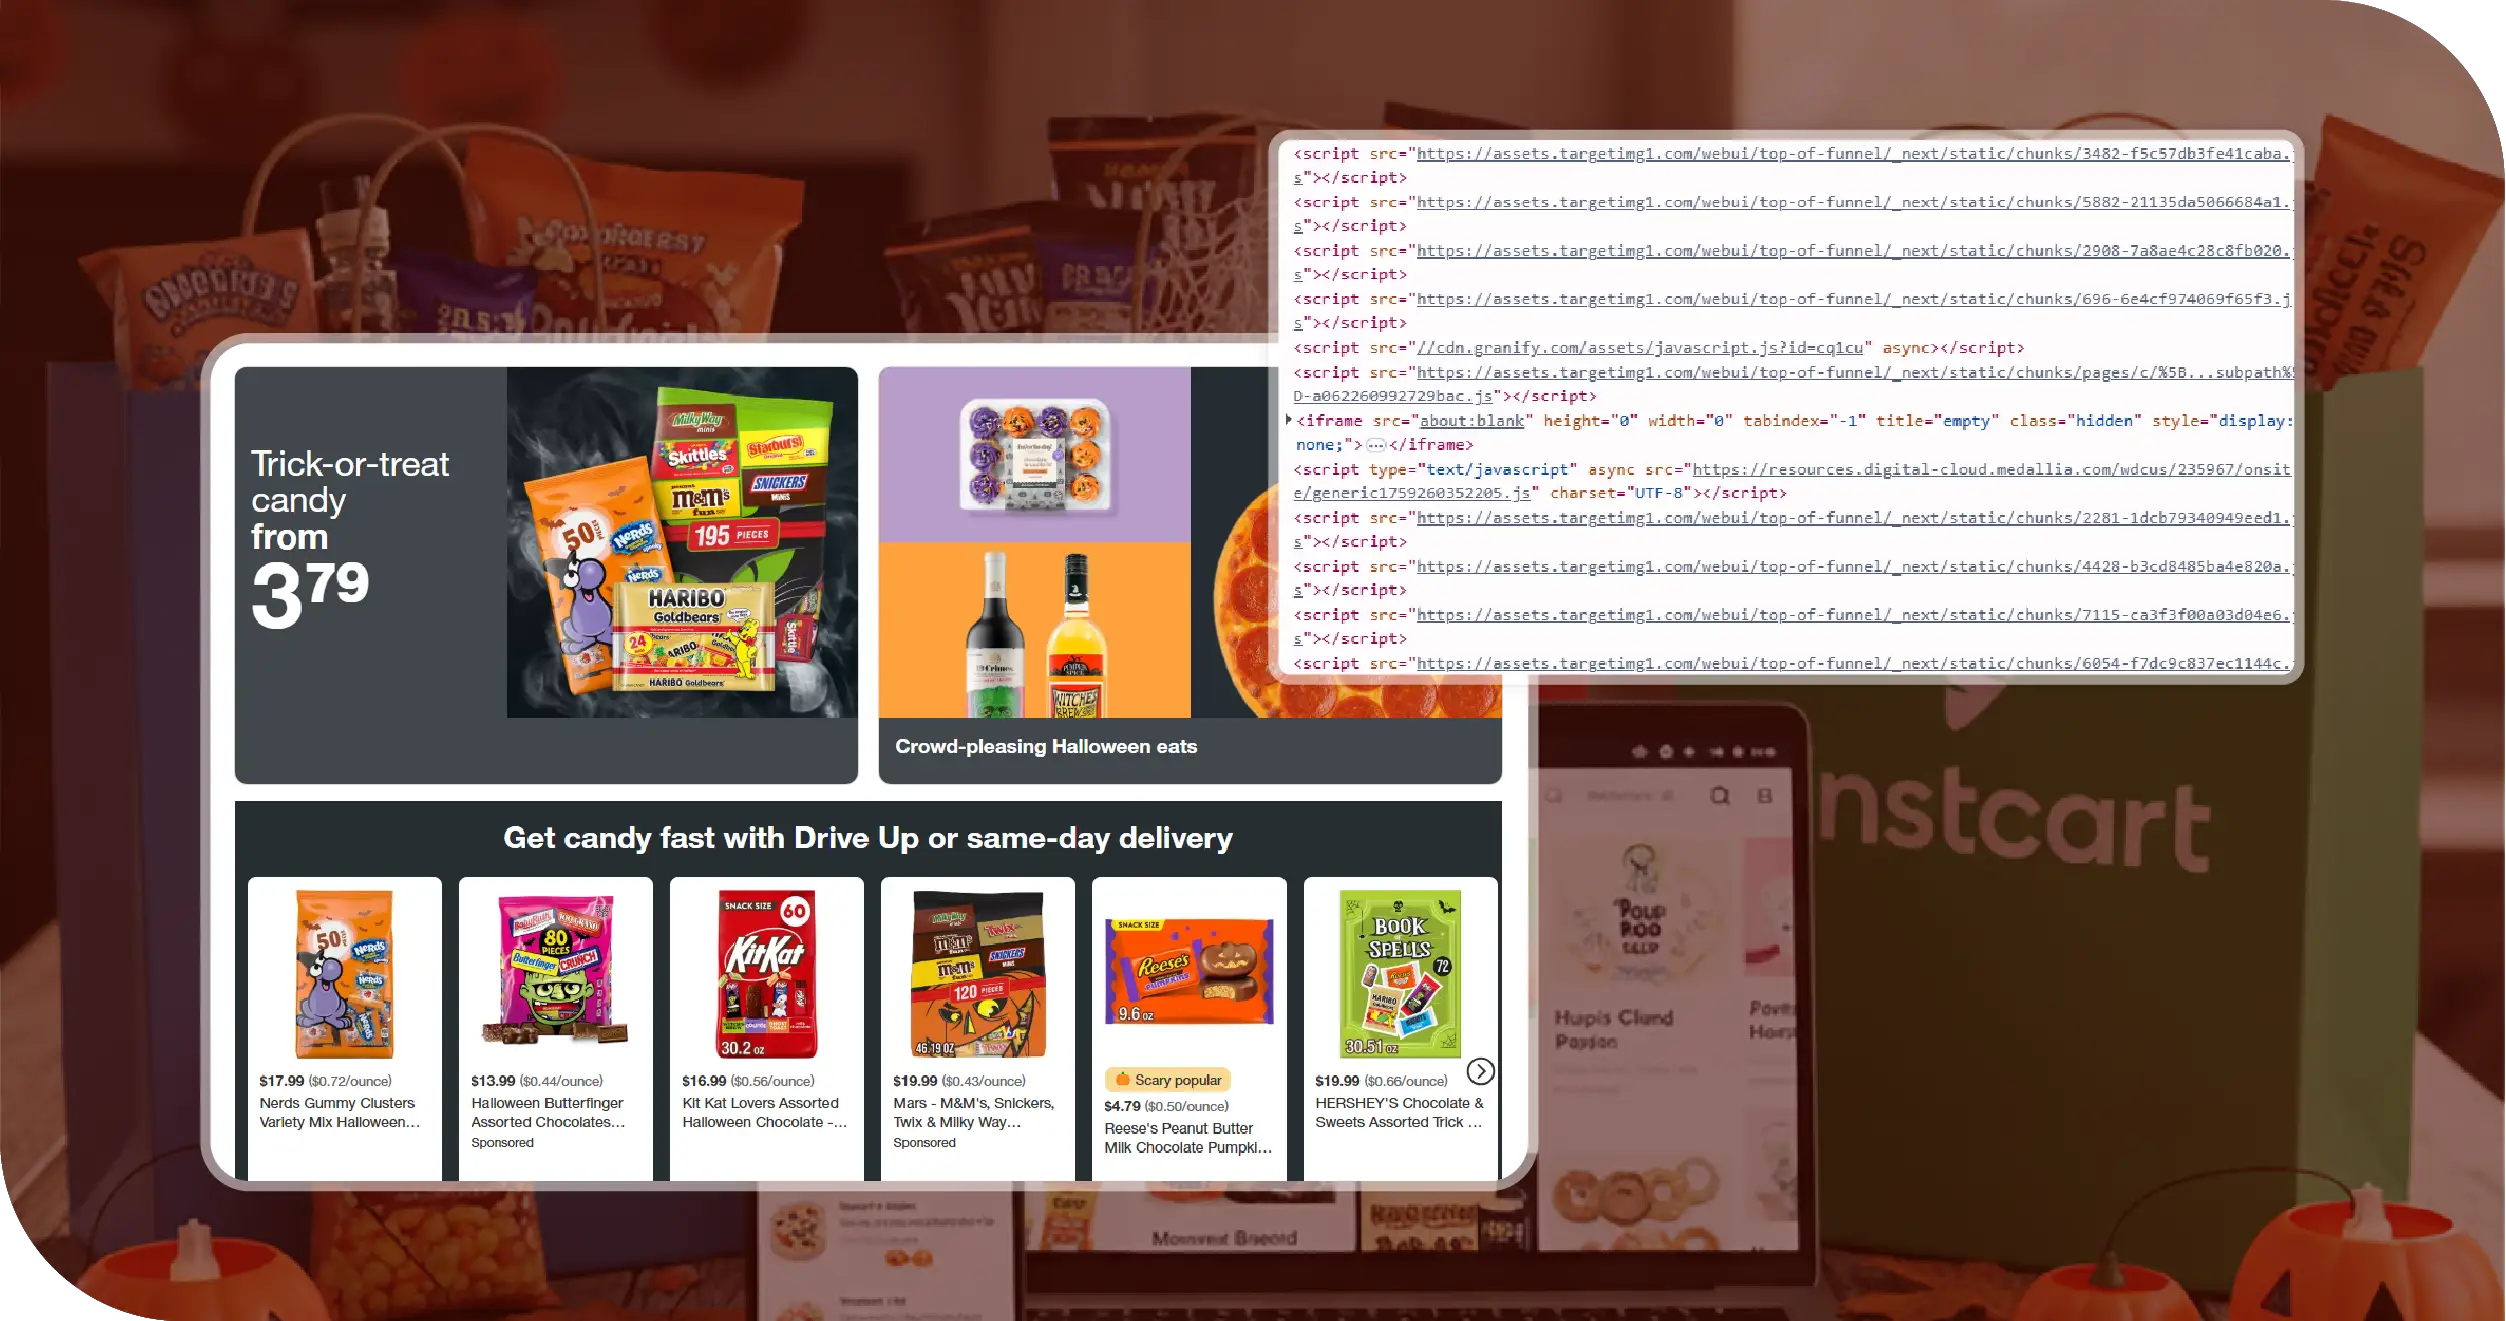
- Targeted Keyword-Based Extraction: The scraper searched for product titles and descriptions containing Halloween-related terms like pumpkin, spooky, candy, witch, ghost, and limited edition.
- Automated Price & Stock Tracking: Using grocery price scraping scripts, the system monitored dynamic fields such as discounted price, availability, seller info, and fulfillment method every six hours.
- Platform-Specific Parsing Models: Walmart’s product JSON, Target’s API structure, and Instacart’s location-based listings required three distinct parsers optimized for accuracy.
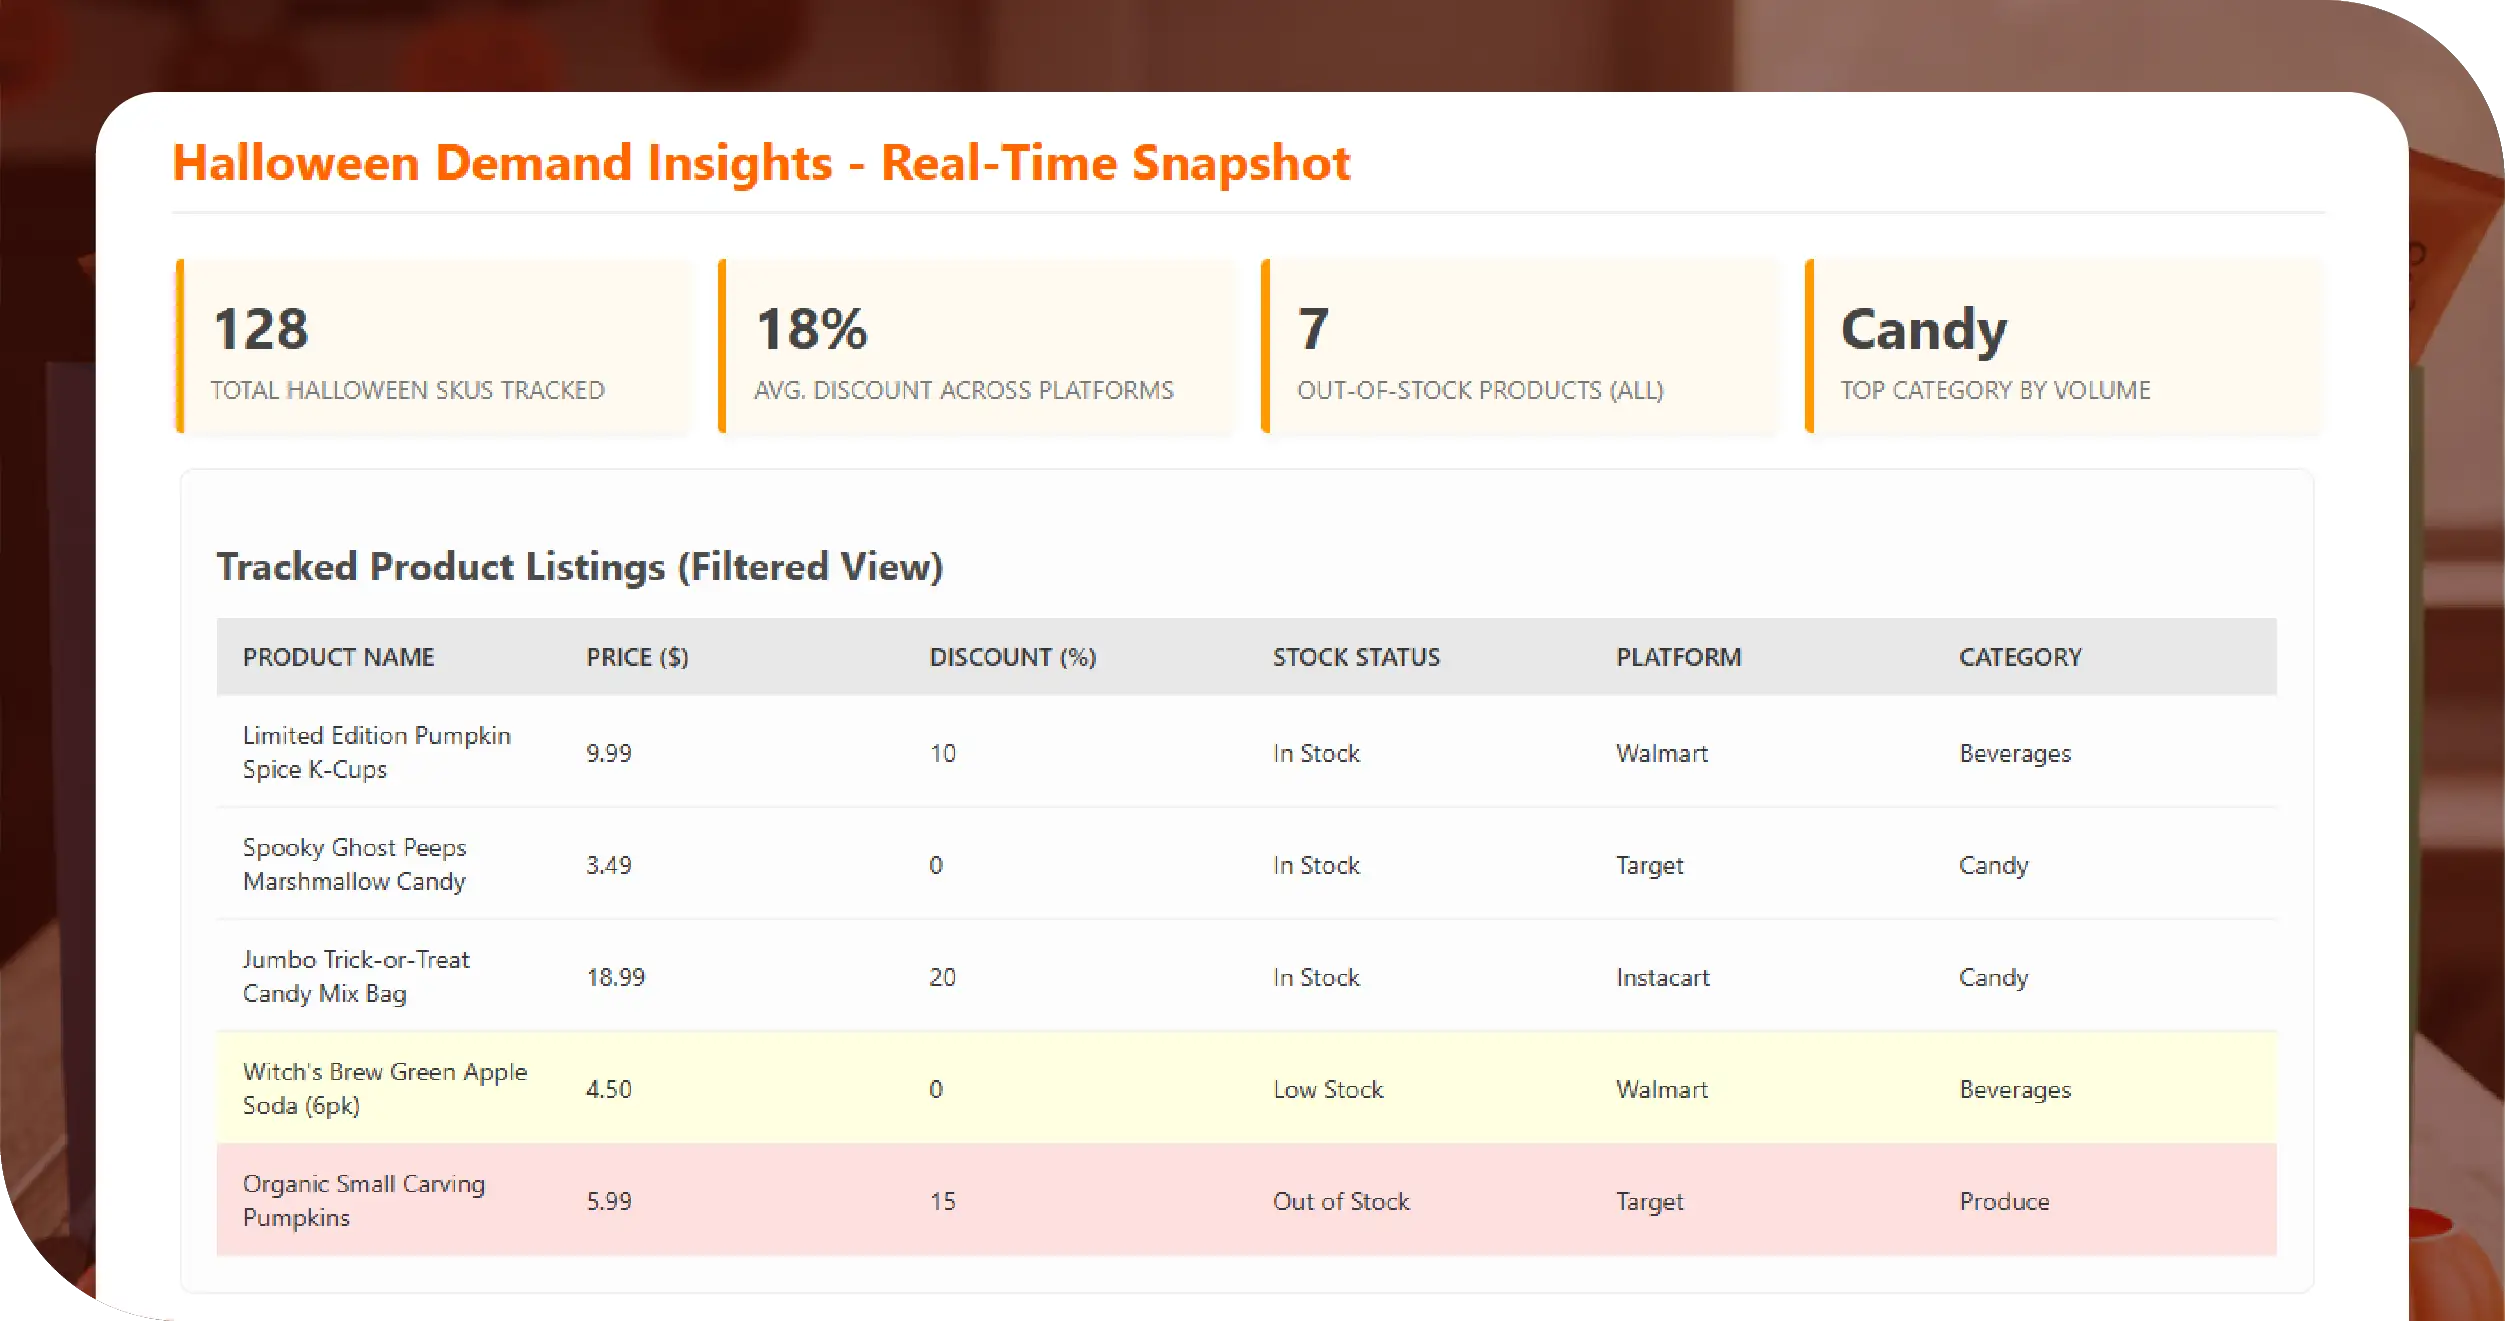
- Data Normalization & Integration: All scraped data was standardized into a single structured schema (Product Name, Price, Discount %, Stock Status, Platform, and Category).
- Interactive Analytics Dashboard: The data was visualized through a Power BI dashboard, allowing the client to filter by platform, category, and region — enabling on-demand Halloween demand insights.
Methodologies Used
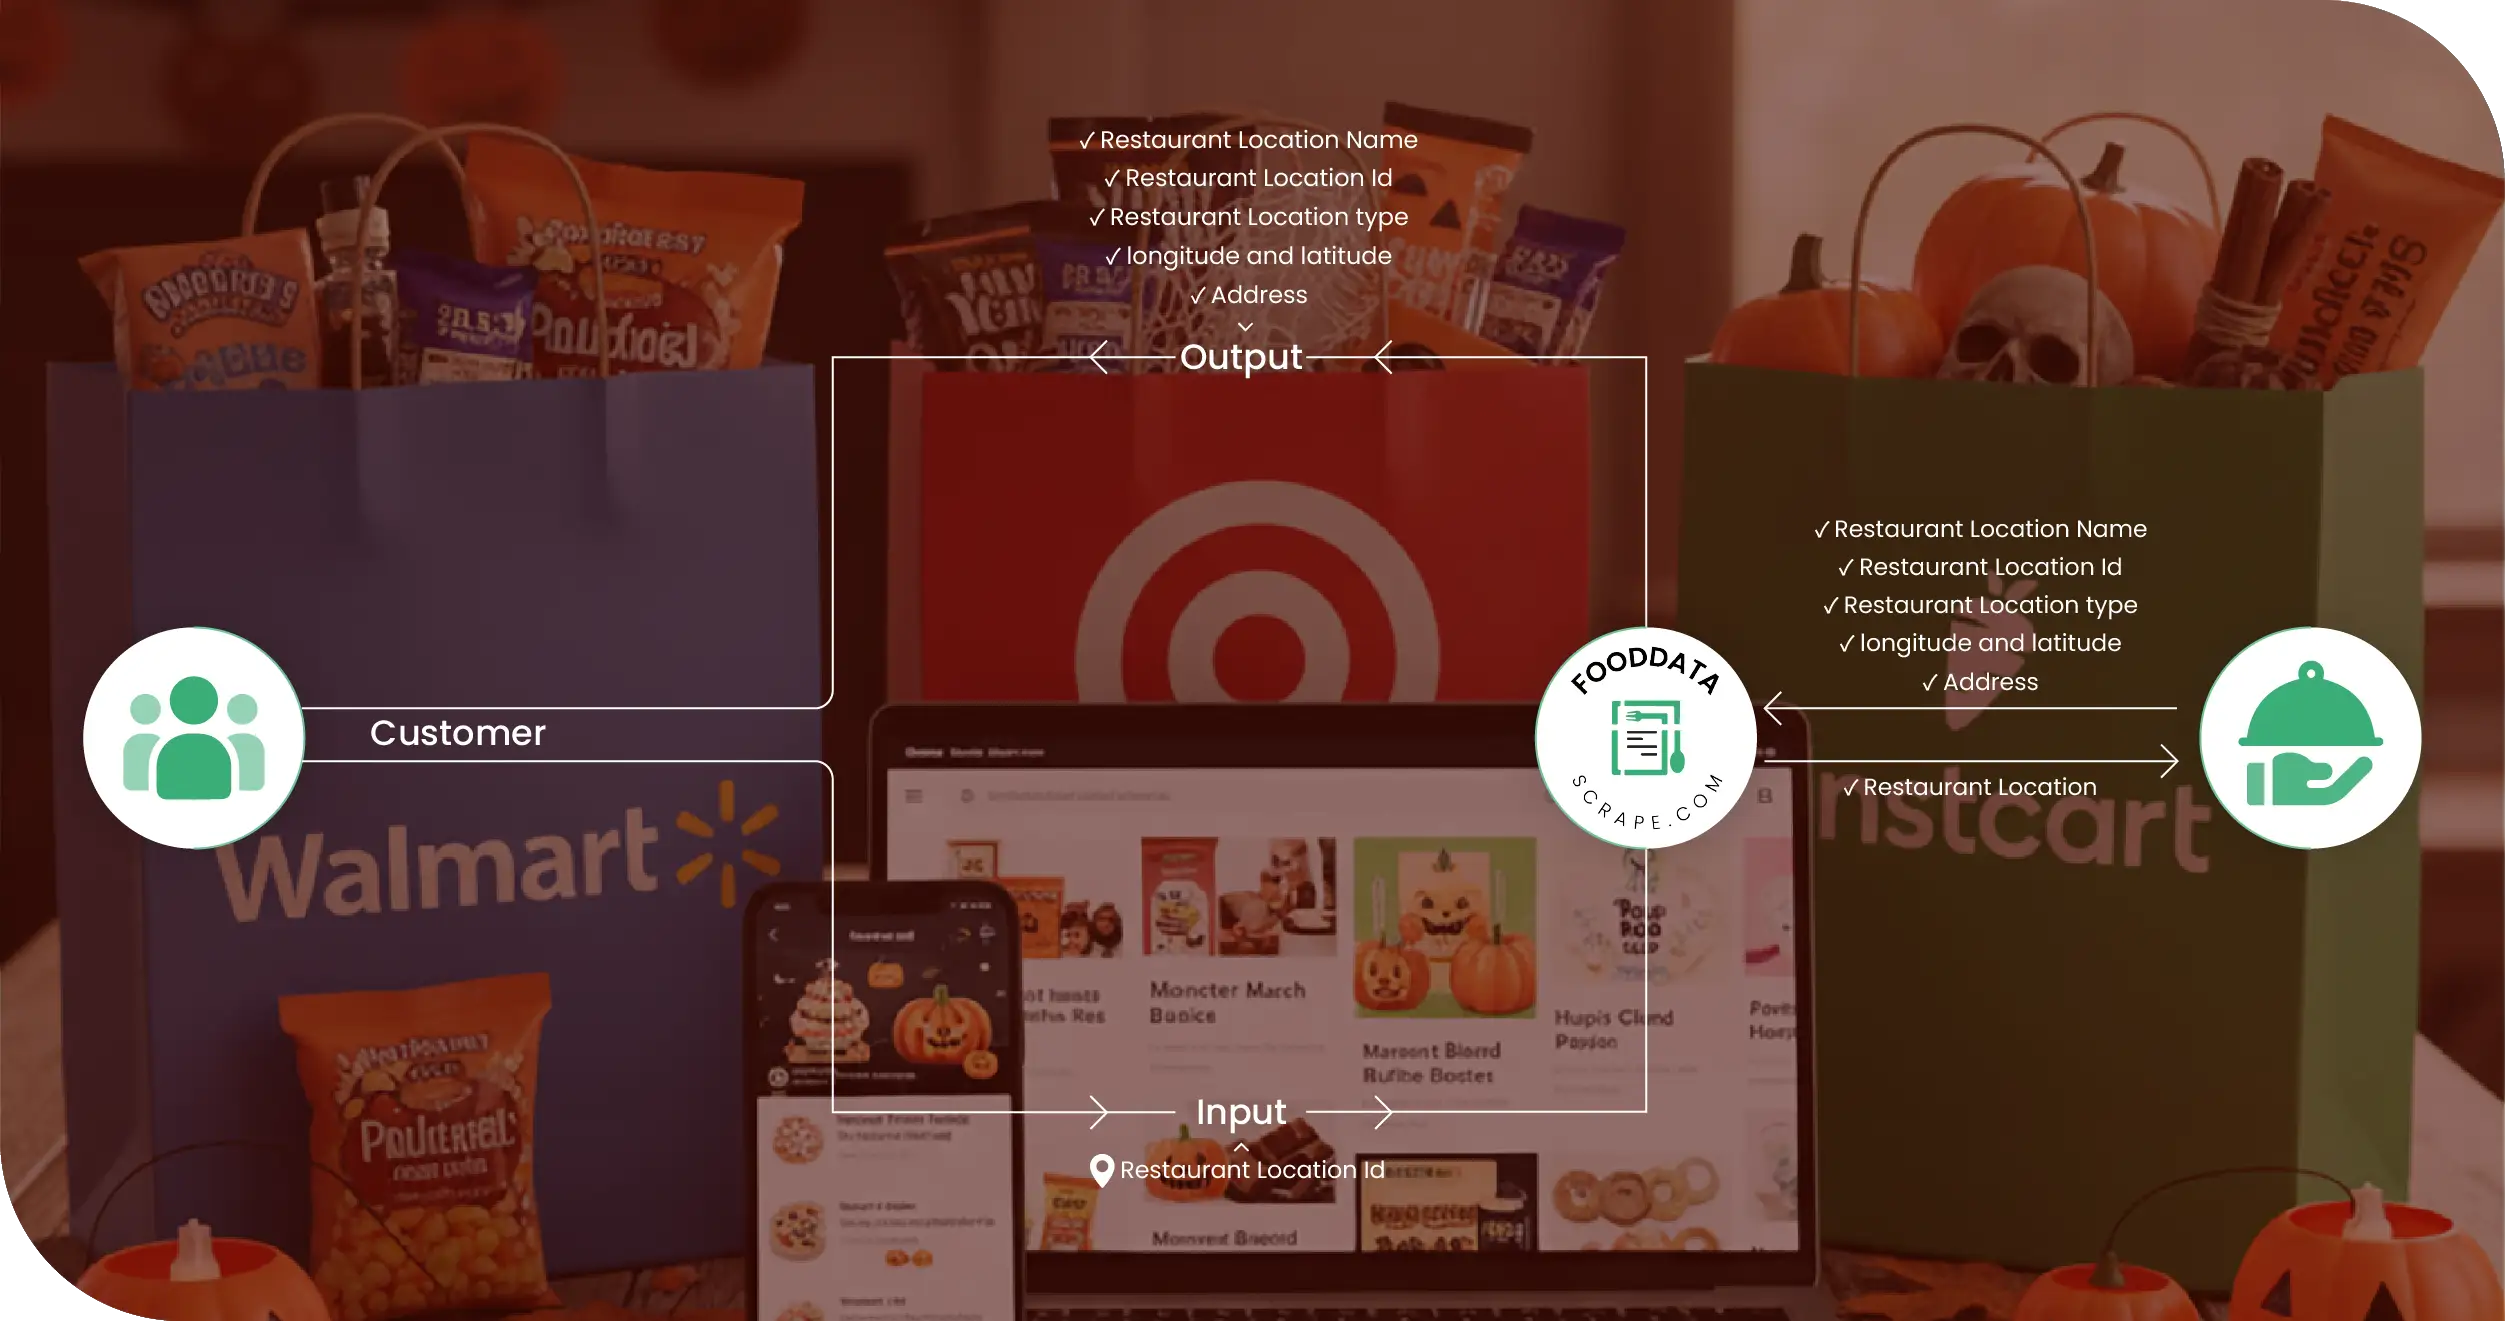
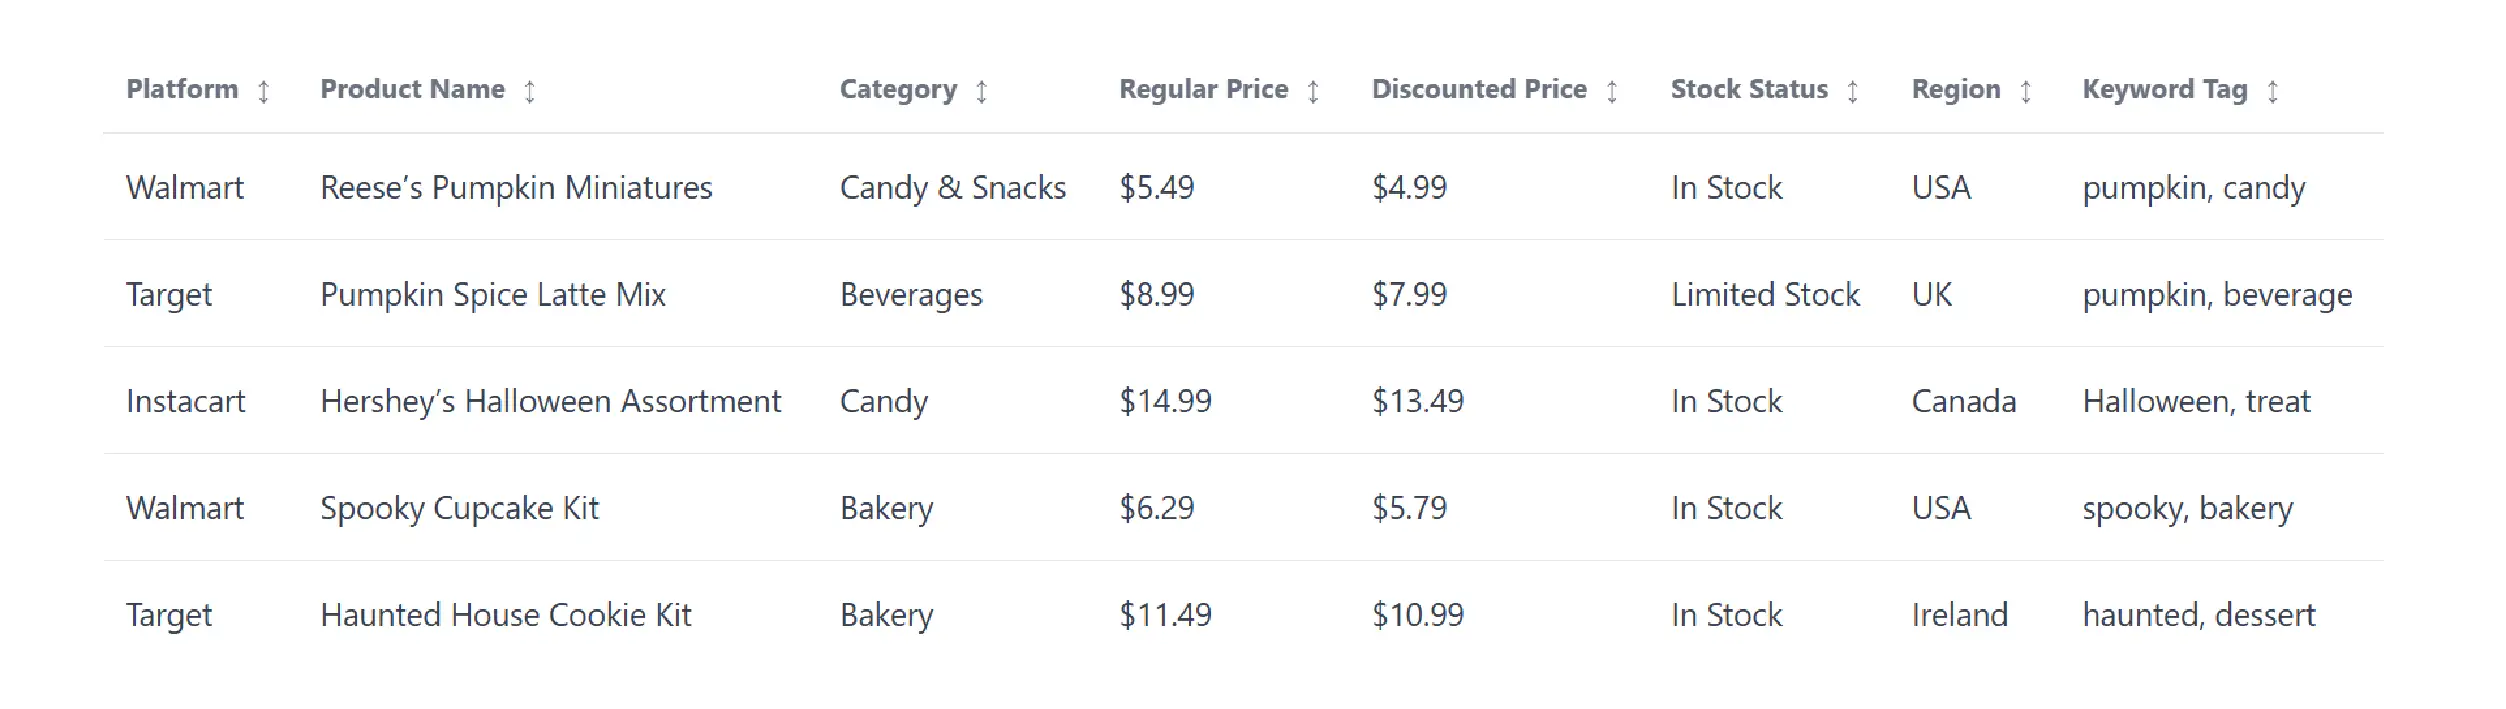
- Multi-Platform Grocery Scraping: Data was extracted from three sources using Python-based scraping frameworks and custom API wrappers to capture: Product Name & SKU, Category & Brand, Regular Price vs. Discounted Price, Stock Status, Region / ZIP Code Availability, Rating & Reviews Count, Product Image URLs.
- Keyword-Level Tagging: Each product was tagged with seasonal markers such as pumpkin, Halloween candy, limited edition, trick or treat, autumn, and spooky décor using NLP filters.
- Data Cleaning & Validation: Duplicates were removed, units standardized, and prices converted to USD. False positives (non-Halloween products with similar names) were filtered out via semantic matching.
- Automated Refresh Scheduling: The system refreshed the data four times a day during the two-week Halloween window to capture real-time shifts in availability and offers.
- Category-Wise Trend Mapping: Scraped records were categorized into: Candies & Snacks, Beverages & Alcohol, Bakery & Desserts, Home Décor & Essentials, Pet Treats & Novelty Items. This categorization allowed analysis of which categories peaked in demand at what times and on which platforms.
Sample Data Snapshot
Advantages of Collecting Data Using Food Data Scrape
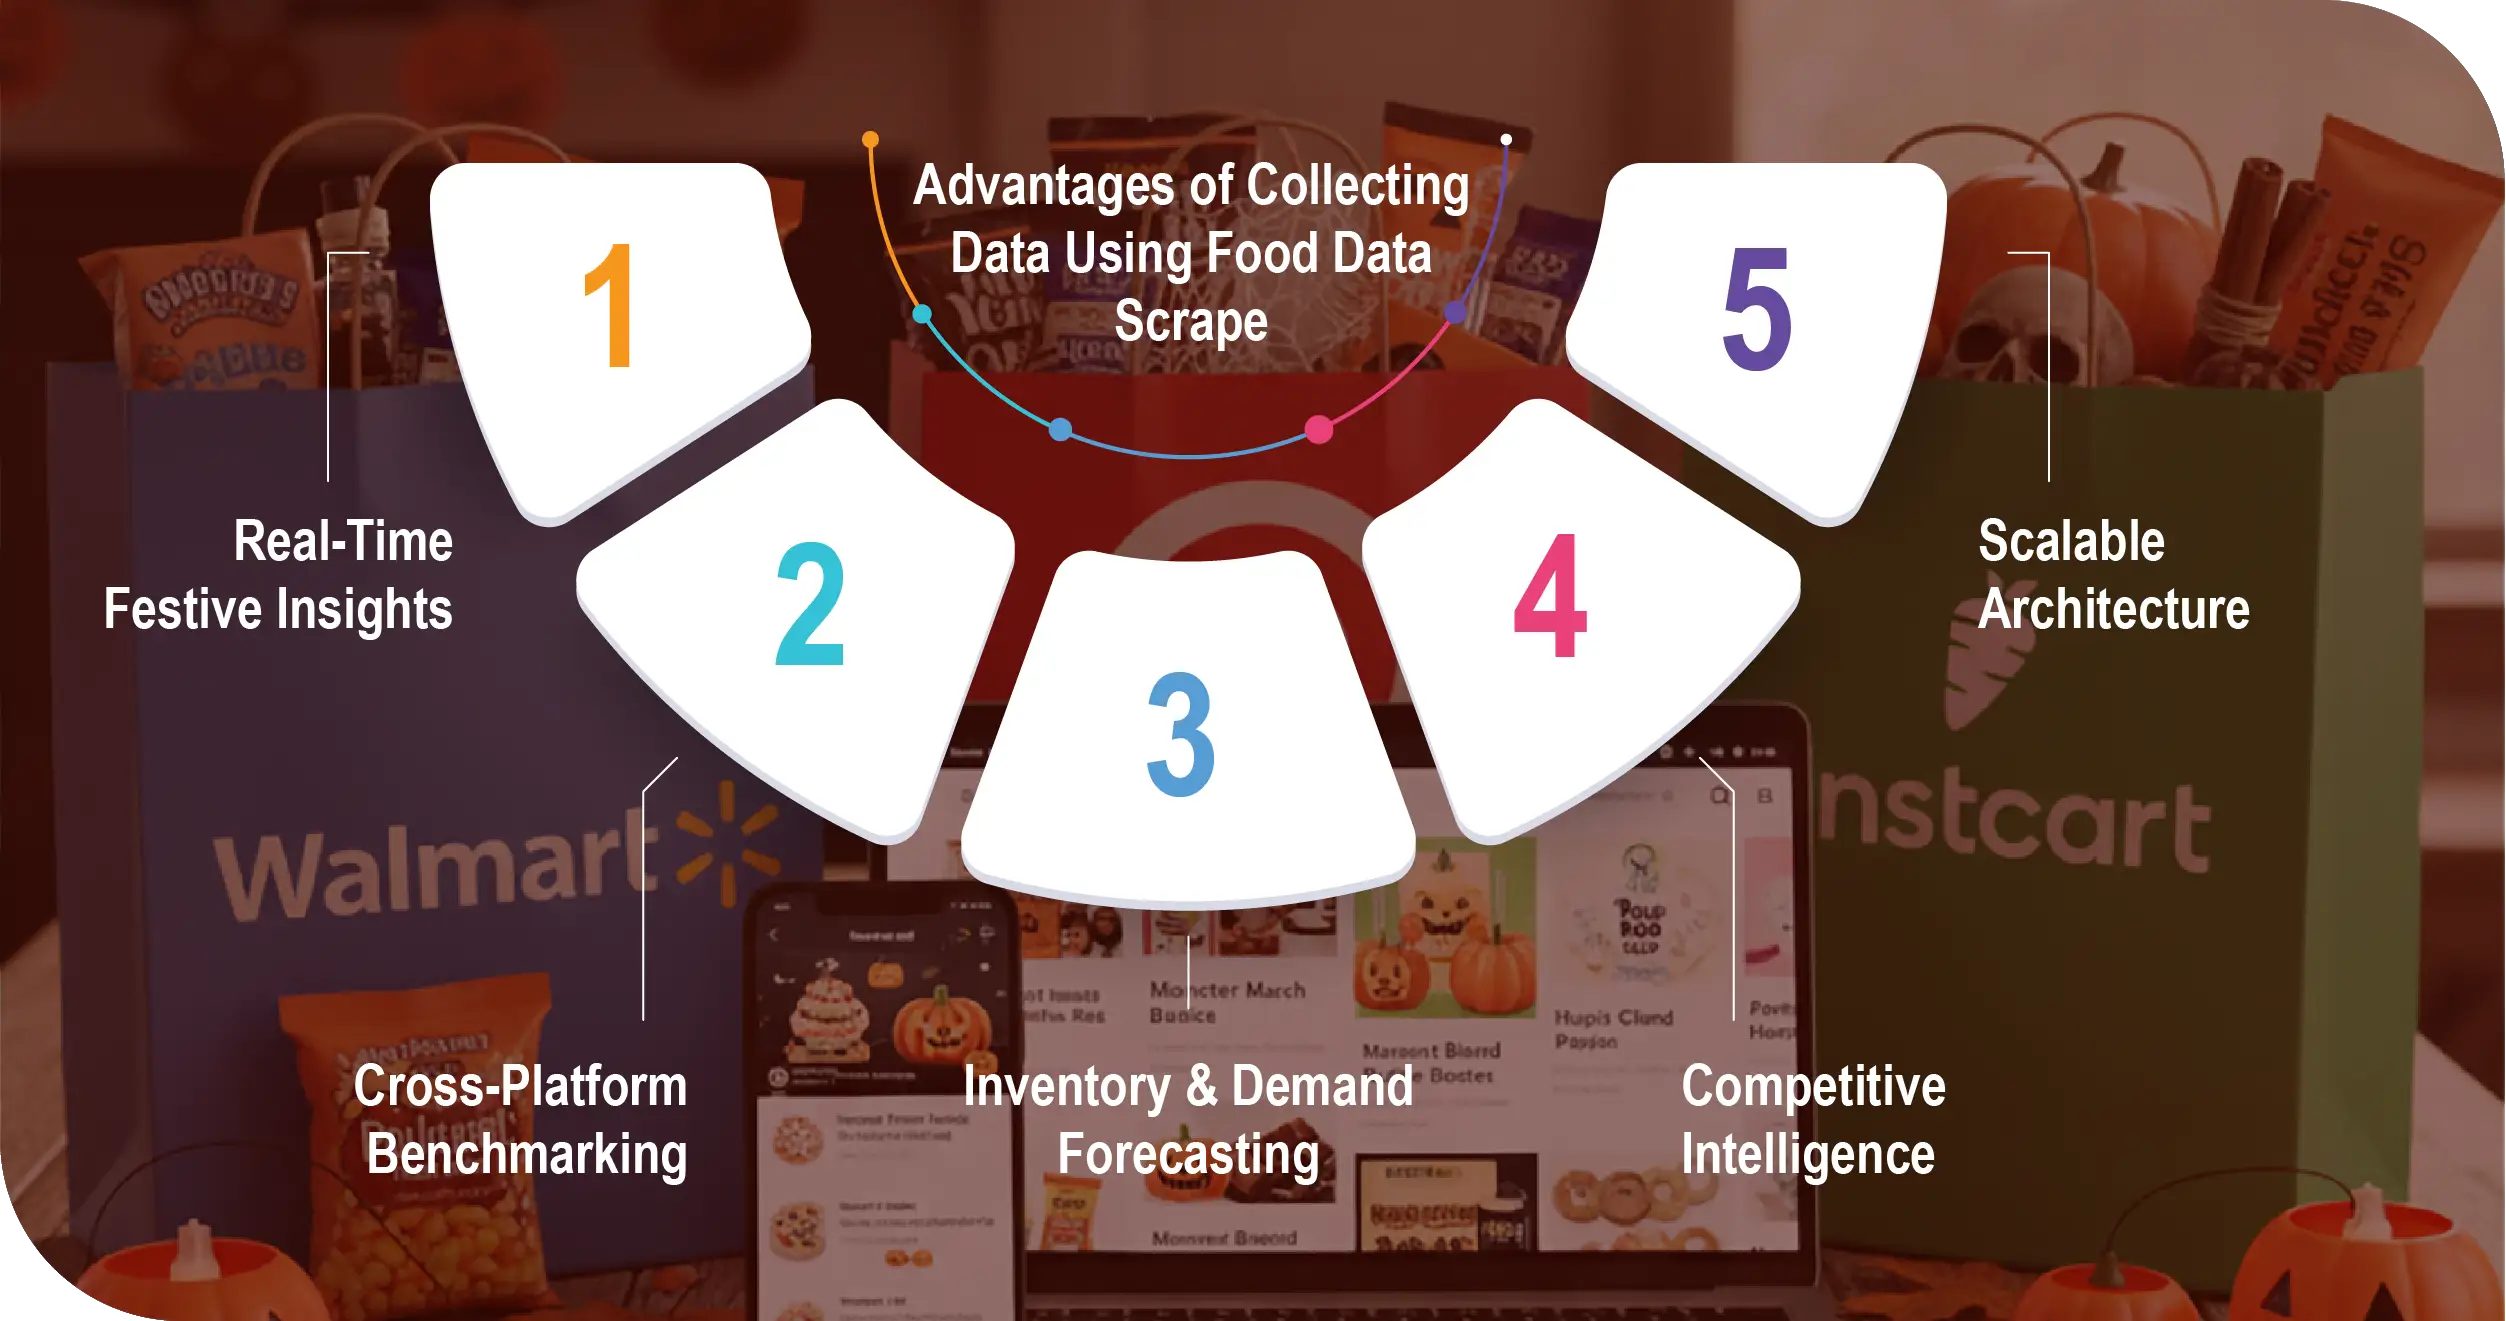
- Real-Time Festive Insights: Halloween demand fluctuates daily. With real-time grocery scraping, the client captured dynamic trends in pricing, availability, and top-selling SKUs.
- Cross-Platform Benchmarking: The consolidated dataset allowed comparison of pricing strategies and discount depths across Walmart, Target, and Instacart in one view.
- Inventory & Demand Forecasting: By observing out-of-stock patterns, the client predicted category surges and optimized inventory for upcoming festivals like Thanksgiving and Christmas.
- Competitive Intelligence: The scraped data revealed how brands differentiated through packaging, keywords, and discount messaging — supporting marketing and pricing optimization.
- Scalable Architecture: Built for large-scale grocery data scraping, the infrastructure can easily expand to 20+ platforms for global event tracking.
Client’s Testimonial
“The Halloween grocery data scraping by Food Data Scrape gave us near-real-time visibility into how Walmart, Target, and Instacart handled seasonal demand. From pumpkin SKUs to last-minute candy discounts, we could see the full picture instantly. It completely transformed how we plan festive inventory and pricing.”
Head of Analytics, Retail Insights Firm – North America
Final Outcome
With Food Data Scrape’s multi-platform grocery data scraping, the client achieved full transparency into Halloween 2025 product trends across the top US, UK, Irish, Australian, and Canadian markets. Key outcomes included: 23% faster inventory response time due to real-time stock visibility, 18% higher campaign ROI through competitive pricing analysis, and full market coverage of over 8,500 Halloween-tagged grocery SKUs within two weeks. By combining structured grocery product data with offer and stock analytics, Food Data Scrape delivered the intelligence backbone for festive planning and price optimization.

