
This regional report examined 100 of the most frequently available grocery items in the US, by state. Utilizing data from multiple national sources, it reveals fine detail about the differences in grocery assortments reflecting a range of geography, local population behaviours, and local digital shelf strategies. There was a consistency around the same group of products, ranging from everyday grocery items to regional specialties that were niche. The research identified variations based on metropolitan and rural areas, mapping many of the local market demands against what was available online. The report goes further to make comparisons of price distributions, identifying areas of premium pricing and discounting. The report even considered the strengths of the platforms, such as bulk availability of goods, variety of brands available, and assortment consistency across states. This type of research can be helpful to retail strategists, supply chain planners, and product developers looking to optimize assortment, pricing, and promotion planning on a state-centred scope.

Staple Consistency Across States: Bread, milk, eggs, and bottled water appear consistently nationwide, though brand variety and quantity differ regionally.
Regional Product Preferences: The Midwest and South list more baking goods and canned items, while the West Coast favors organic, plant-based, and global foods.
Price Range Disparities by Region: Grocery prices can vary by up to 35% across states, with California and New York among the highest.
Platform-Specific Listing Trends: One platform pushes national brands with bulk deals; another promotes private labels and local items; a third offers store-brand exclusives.
Category Leaders by State: Urban states like Florida and Illinois lead in snacks, beverages, and personal care; rural states focus more on grains and household supplies.
The U.S. grocery e-commerce market is dynamic and varies significantly across states, shaped by regional preferences, local availability, and consumer habits. To better understand these patterns, this report leverages advanced web scraping techniques to Scrape Top 100 Grocery Products by State – USA, focusing on leading platforms like Instacart, Walmart, and Kroger. By collecting and analyzing this data, we gain insights into the digital representation of grocery shelves and how product demand differs between regions.
Our approach supports Top 100 Grocery Items Scraping from US Retailers, helping to map out nationwide versus state-specific grocery trends. From pantry staples and packaged snacks to fresh produce and household essentials, the diversity in product rankings offers a window into localized consumer behavior. This type of intelligence is particularly valuable for suppliers, marketers, and e-commerce analysts aiming to align inventory and promotions with regional demand.
By employing a Top Listed Grocery Products Web Scraper for the USA States, this report identifies key variances in grocery listings, uncovering both regional preferences and emerging national trends. The result is a detailed, data-driven snapshot of the online grocery ecosystem, enabling better strategic planning for retailers and brands operating across multiple U.S. states.
The research is based on web scraping data collected in July 2025 from Instacart, Walmart, and Kroger platforms across all 50 U.S. states. We extracted product listings, prices, availability status, and product frequency using custom web scraping tools. Keyword filters, category classification, and frequency scoring were applied to derive the top 100 products per state. In parallel, manual validation ensured that high-frequency brand duplication and SKU overlap were normalized.
Data extraction tools were used to Scrape State-wise Grocery Product Data from USA Retailers, and the results were segmented into fresh food, pantry staples, beverages, snacks, dairy, and frozen foods. The analysis highlights the Top-Selling Grocery Product Dataset USA based on visibility and recurrence across digital platforms.
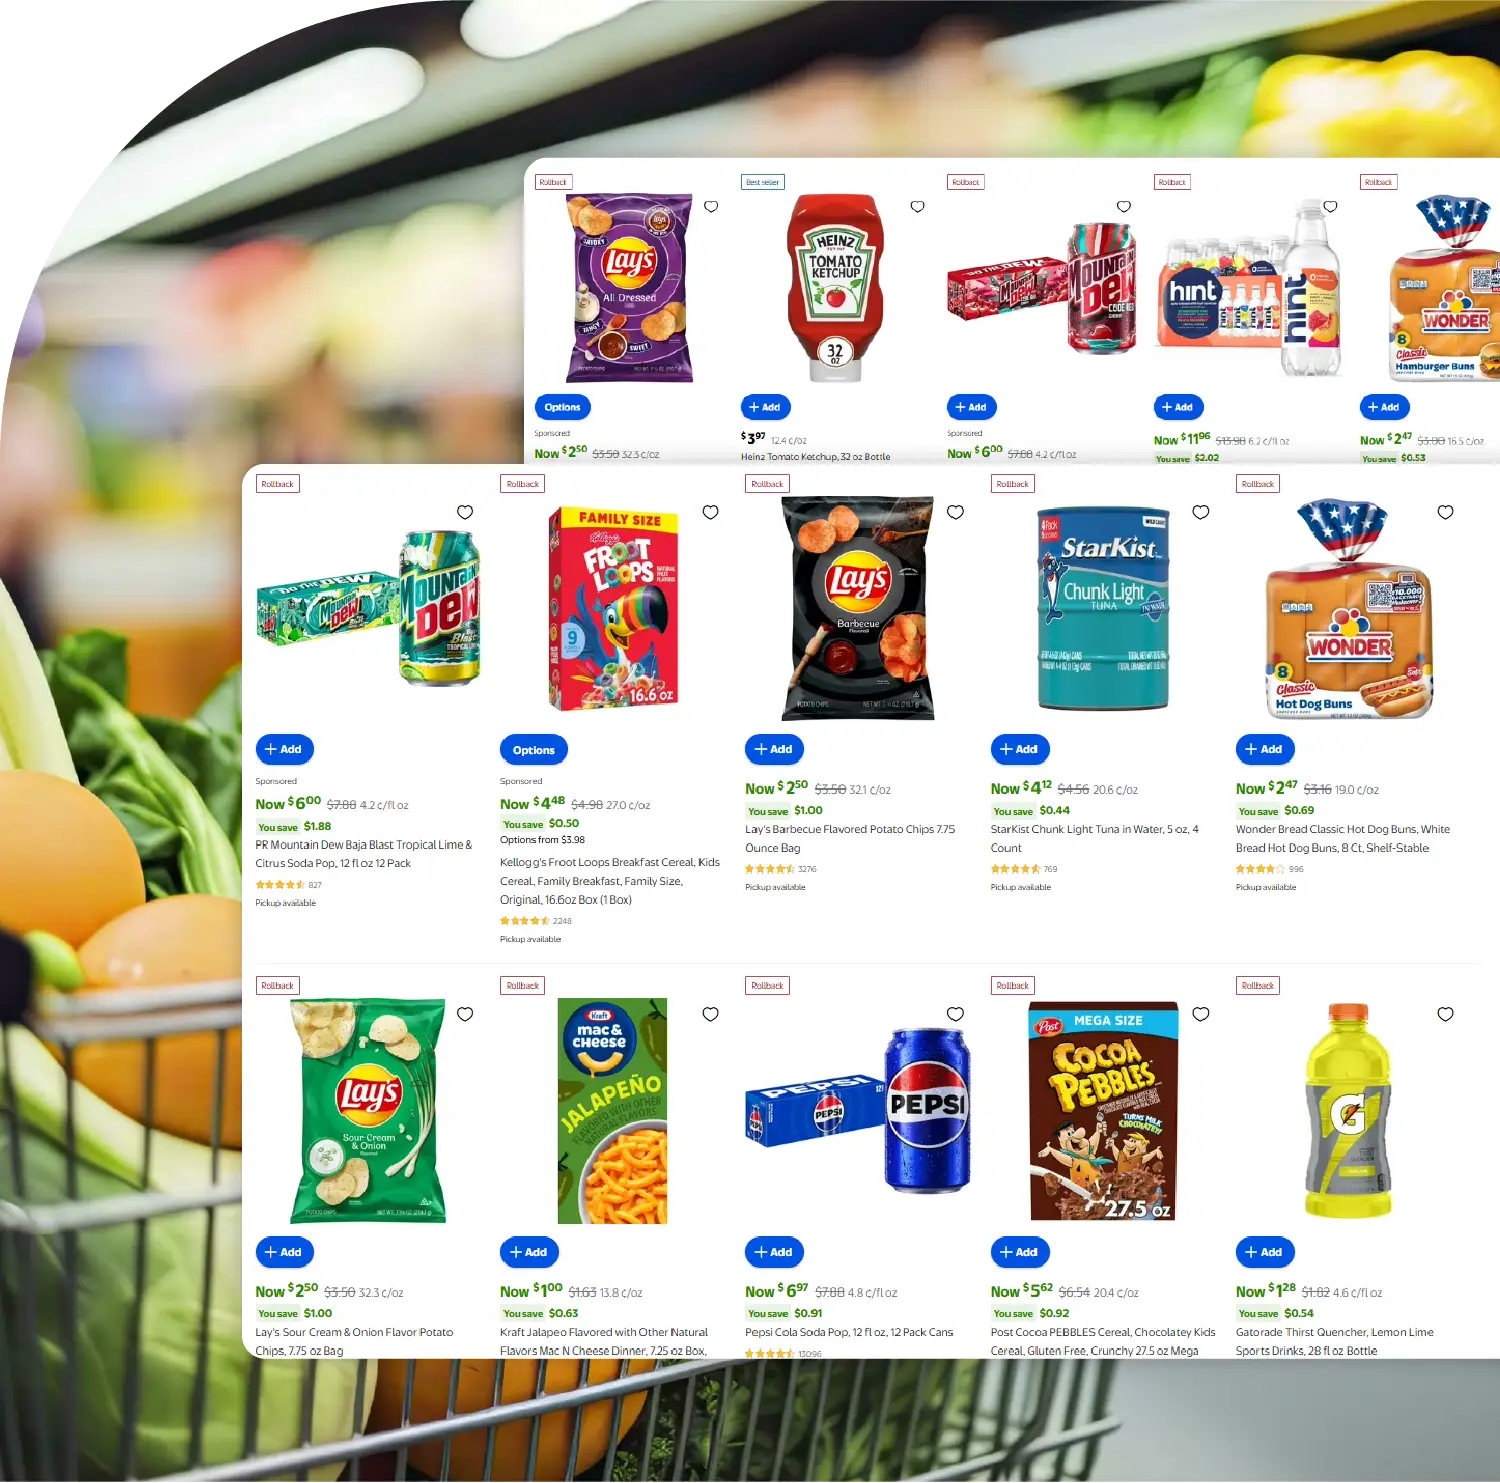
Nationally, a set of staple grocery items dominates digital store shelves. The top 20 products found across most U.S. states are:
| Rank | Product Name | Common Categories |
|---|---|---|
| 1 | Whole Milk | Dairy |
| 2 | White Bread | Bakery |
| 3 | Large Brown Eggs | Dairy / Refrigerated |
| 4 | Bottled Water (12-pack) | Beverages |
| 5 | Ground Beef (1 lb) | Meat / Refrigerated |
| 6 | Bananas | Produce / Fresh |
| 7 | Chicken Breast (boneless) | Meat / Refrigerated |
| 8 | Salted Butter | Dairy |
| 9 | Whole Wheat Bread | Bakery |
| 10 | Cheddar Cheese (block) | Dairy |
| 11 | Coca-Cola (6-pack) | Beverages |
| 12 | Peanut Butter | Pantry Staples |
| 13 | All-purpose Flour | Baking / Staples |
| 14 | 2% Milk | Dairy |
| 15 | Roma Tomatoes | Produce / Fresh |
| 16 | Frozen French Fries | Frozen Foods |
| 17 | Paper Towels (single roll) | Household Essentials |
| 18 | Fresh Spinach | Produce / Leafy Greens |
| 19 | Olive Oil (500ml) | Pantry Staples |
| 20 | Instant Oatmeal Packets | Breakfast / Cereal |
This ranking indicates national preferences focused on core food essentials and everyday convenience.
Web scraping revealed that certain products dominate more in specific regions. For example, Avocados appear in the Top 10 products in California, Arizona, and Texas, while Frozen Corn Dogs show high popularity in Midwestern states such as Iowa and Missouri. Sweet Tea variants are widely listed in Southern states.
Below is a sample comparative snapshot of regional variations:
| State | Unique Top Products | Shared Products with National Top 20 |
|---|---|---|
| California | Avocados, Almond Milk, Sourdough Bread | 17 |
| Texas | Salsa, Tortilla Chips, BBQ Sauce | 18 |
| New York | Bagels, Greek Yogurt, Rotisserie Chicken | 19 |
| Illinois | Frozen Pizza, Hot Dogs, Mixed Berries | 18 |
| Florida | Plantains, Coconut Water, Mangoes | 16 |
These insights were gathered using Top 100 Grocery Products Data Scraping USA (By State) techniques to validate product diversity in localized markets.
Each major platform contributes differently to regional and national grocery product visibility.
Using Grocery App Data Scraping services, we analyzed the category-wise distribution of the most listed products:
| Category | Instacart (%) | Walmart (%) | Kroger (%) |
|---|---|---|---|
| Dairy | 18 | 22 | 20 |
| Produce | 21 | 15 | 19 |
| Snacks | 14 | 18 | 13 |
| Beverages | 12 | 14 | 13 |
| Frozen Foods | 10 | 11 | 12 |
| Pantry Staples | 17 | 13 | 15 |
| Household Essentials | 8 | 7 | 8 |
These breakdowns support insights from Web Scraping Quick Commerce Data for top categories by frequency.
Consumer preferences in grocery e-commerce vary widely across U.S. regions, influenced by cultural norms, dietary trends, and lifestyle factors. Our analysis, powered by Grocery Delivery Scraping API Services, offers a detailed look at how product listings differ across the West Coast, South, Midwest, and Northeast. These insights are derived from real-time, state-specific data collected from major platforms such as Instacart, Walmart, and Kroger.
These regional shopping behaviors, uncovered through Grocery Delivery Scraping API Services, enable stakeholders to align product availability and marketing strategies with hyper-local consumer demand—making state-level data a powerful asset in the grocery e-commerce landscape.
Regional grocery preferences in the U.S. are shaped by cultural habits and driven by digital accessibility. Retailers benefit by localizing inventory, while manufacturers can optimize supply chains based on regional demand. Tools like a Grocery Price Tracking Dashboard provide real-time insights into price changes, and Grocery Pricing Data Intelligence supports smarter promotions. As e-commerce expands, access to accurate Grocery Store Datasets becomes essential for staying competitive. By leveraging advanced web scraping technologies, businesses can monitor product listings, availability, and consumer trends across platforms like Instacart, Walmart, and Kroger—state by state—enabling data-driven decisions in a rapidly evolving grocery landscape. Quick Commerce Data Intelligence Services further enhance this capability by offering instant insights into hyperlocal demand and pricing strategies.
Are you in need of high-class scraping services? Food Data Scrape should be your first point of call. We are undoubtedly the best in Food Data Aggregator and Mobile Grocery App Scraping service and we render impeccable data insights and analytics for strategic decision-making. With a legacy of excellence as our backbone, we help companies become data-driven, fueling their development. Please take advantage of our tailored solutions that will add value to your business. Contact us today to unlock the value of your data.

