
Zepto’s rapid expansion across India’s urban markets is driven by its hyperlocal dark store infrastructure. This report provides a structured overview of Zepto Dark Store Location Data Scraping, highlighting how geographic intelligence supports quick-commerce scalability. By analyzing city-wise distribution, delivery radius, store density, and operational metrics, businesses can understand how Zepto optimizes fulfillment speed and market penetration. The study examines data extraction methodologies, structured datasets, and integration with pricing and inventory intelligence systems. It also outlines how dark store mapping enables competitive benchmarking, expansion planning, and demand forecasting. With accurate geo-coordinates, pin code coverage, and performance indicators, stakeholders can identify underserved zones and optimize supply chain efficiency. The report further demonstrates how location intelligence integrates with pricing dashboards and grocery analytics tools to create actionable business insights. Overall, the analysis positions dark store data as a strategic asset for retailers, investors, and market intelligence firms operating in India’s fast-growing quick-commerce ecosystem.
1. City-Wise Distribution Analysis Comprehensive mapping of dark store density across major Indian cities.
2. Geo-Location Intelligence Accurate latitude-longitude extraction with detailed service radius performance insights.
3. Pricing and Inventory Integration Location data aligned with grocery price tracking and stock intelligence systems.
4. Competitive Benchmarking Insights Dark store footprint comparison across India’s leading quick-commerce delivery platforms.
5. Operational Performance Metrics Delivery efficiency measurement using order volume and basket value analytics.
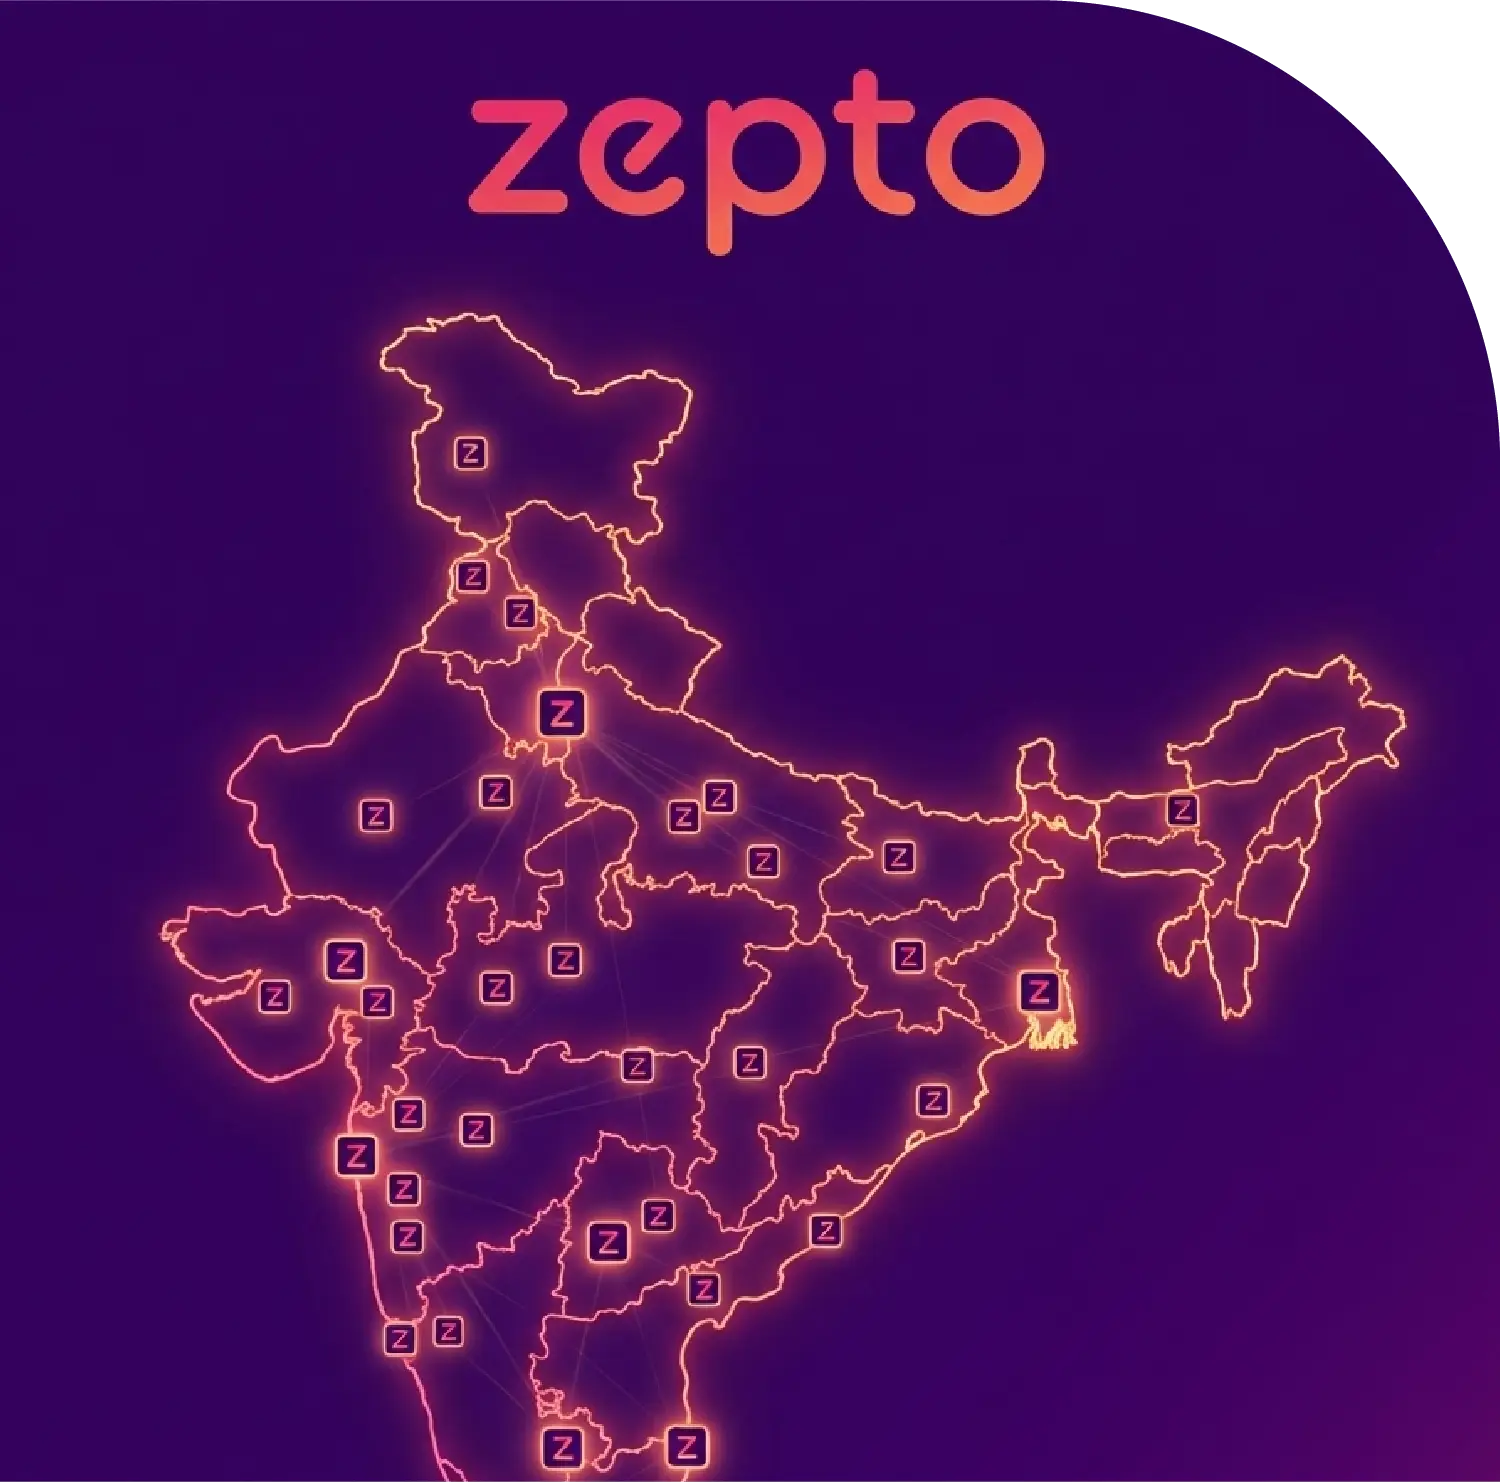
The rapid growth of quick-commerce platforms in India has transformed urban grocery distribution models. Among these, Zepto has built a strong network of dark stores strategically positioned to enable 10-minute deliveries. Understanding the geographic distribution, operational density, and coverage efficiency of these stores has become crucial for investors, retailers, and analytics firms. This is where Zepto Dark Store Location Data Scraping plays a pivotal role in generating actionable business intelligence.
Organizations increasingly Scrape Zepto Dark Store Locations to monitor expansion strategies, hyperlocal penetration, and service radius optimization across Tier 1 and Tier 2 cities. By leveraging automated tools and structured pipelines, businesses can perform Zepto Dark Store Data Extraction to compile accurate datasets including store coordinates, coverage areas, pin code mapping, and service categories.
This research report explores the methodology, datasets, insights, and competitive advantages of scraping Zepto dark store location data, supported with structured tables and analytical interpretations.
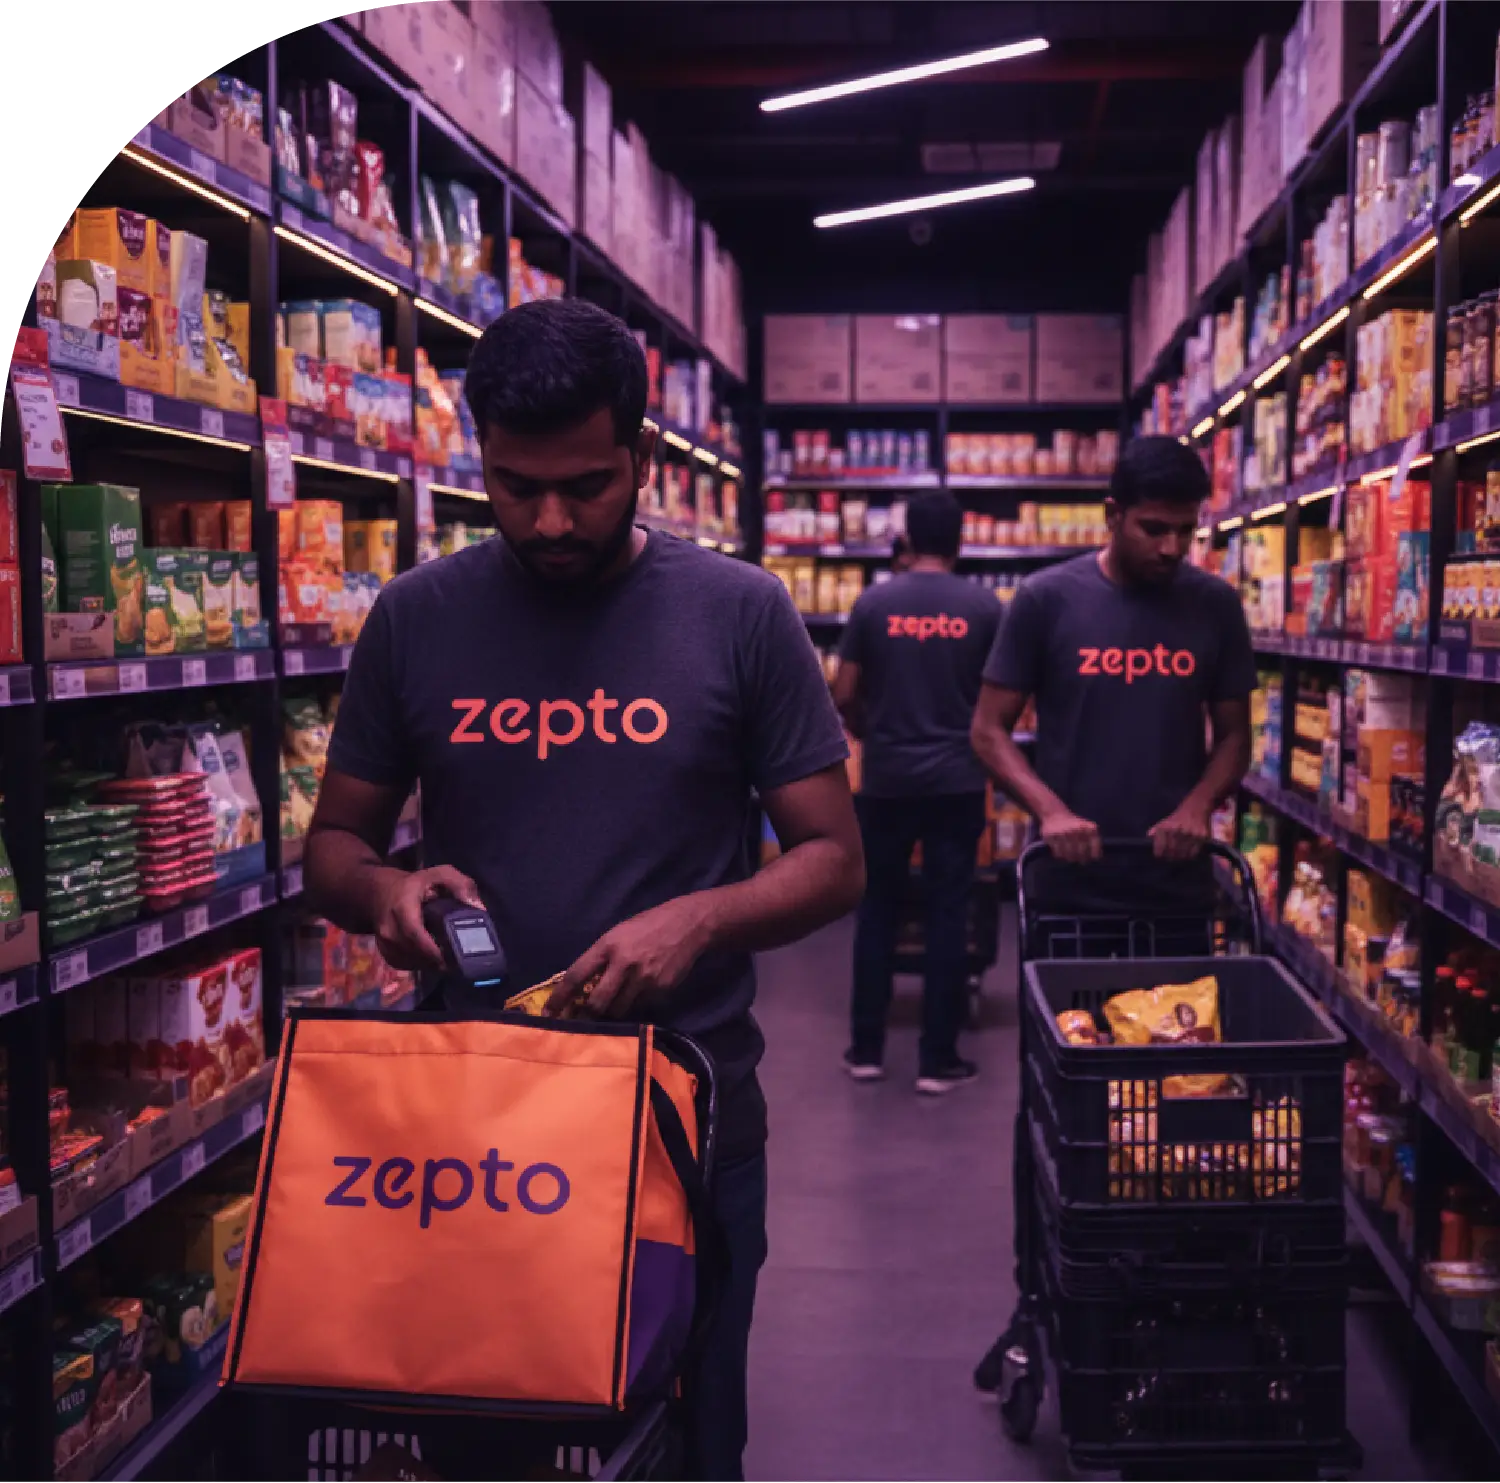
Dark stores are micro-fulfillment centers located within densely populated urban clusters. Unlike traditional retail outlets, these stores operate exclusively for online order fulfillment. Zepto’s success depends heavily on strategic placement of dark stores to ensure minimal delivery time and maximum coverage density.
Key characteristics of Zepto dark stores include:
To analyze this ecosystem, businesses perform Zepto Dark Store Listings Scraping, collecting store names, addresses, operating hours, and geo-coordinates for mapping and analysis.
Using structured data collection techniques, analysts can Extract Zepto Dark Store Details across major cities. Below is a sample dataset illustrating estimated distribution patterns in key Indian markets.
| City | Estimated Dark Stores | Avg Delivery Radius (km) | Coverage Pin Codes | Market Penetration (%) |
|---|---|---|---|---|
| Mumbai | 240 | 2.5 | 512 | 90% |
| Bengaluru | 208 | 2.8 | 464 | 85% |
| Delhi NCR | 272 | 3.0 | 656 | 92% |
| Hyderabad | 152 | 2.7 | 336 | 78% |
| Pune | 120 | 2.6 | 288 | 75% |
This city-level breakdown supports Web Scraping City Wise Zepto Dark Store Location Data, allowing businesses to evaluate urban saturation and identify potential expansion gaps.
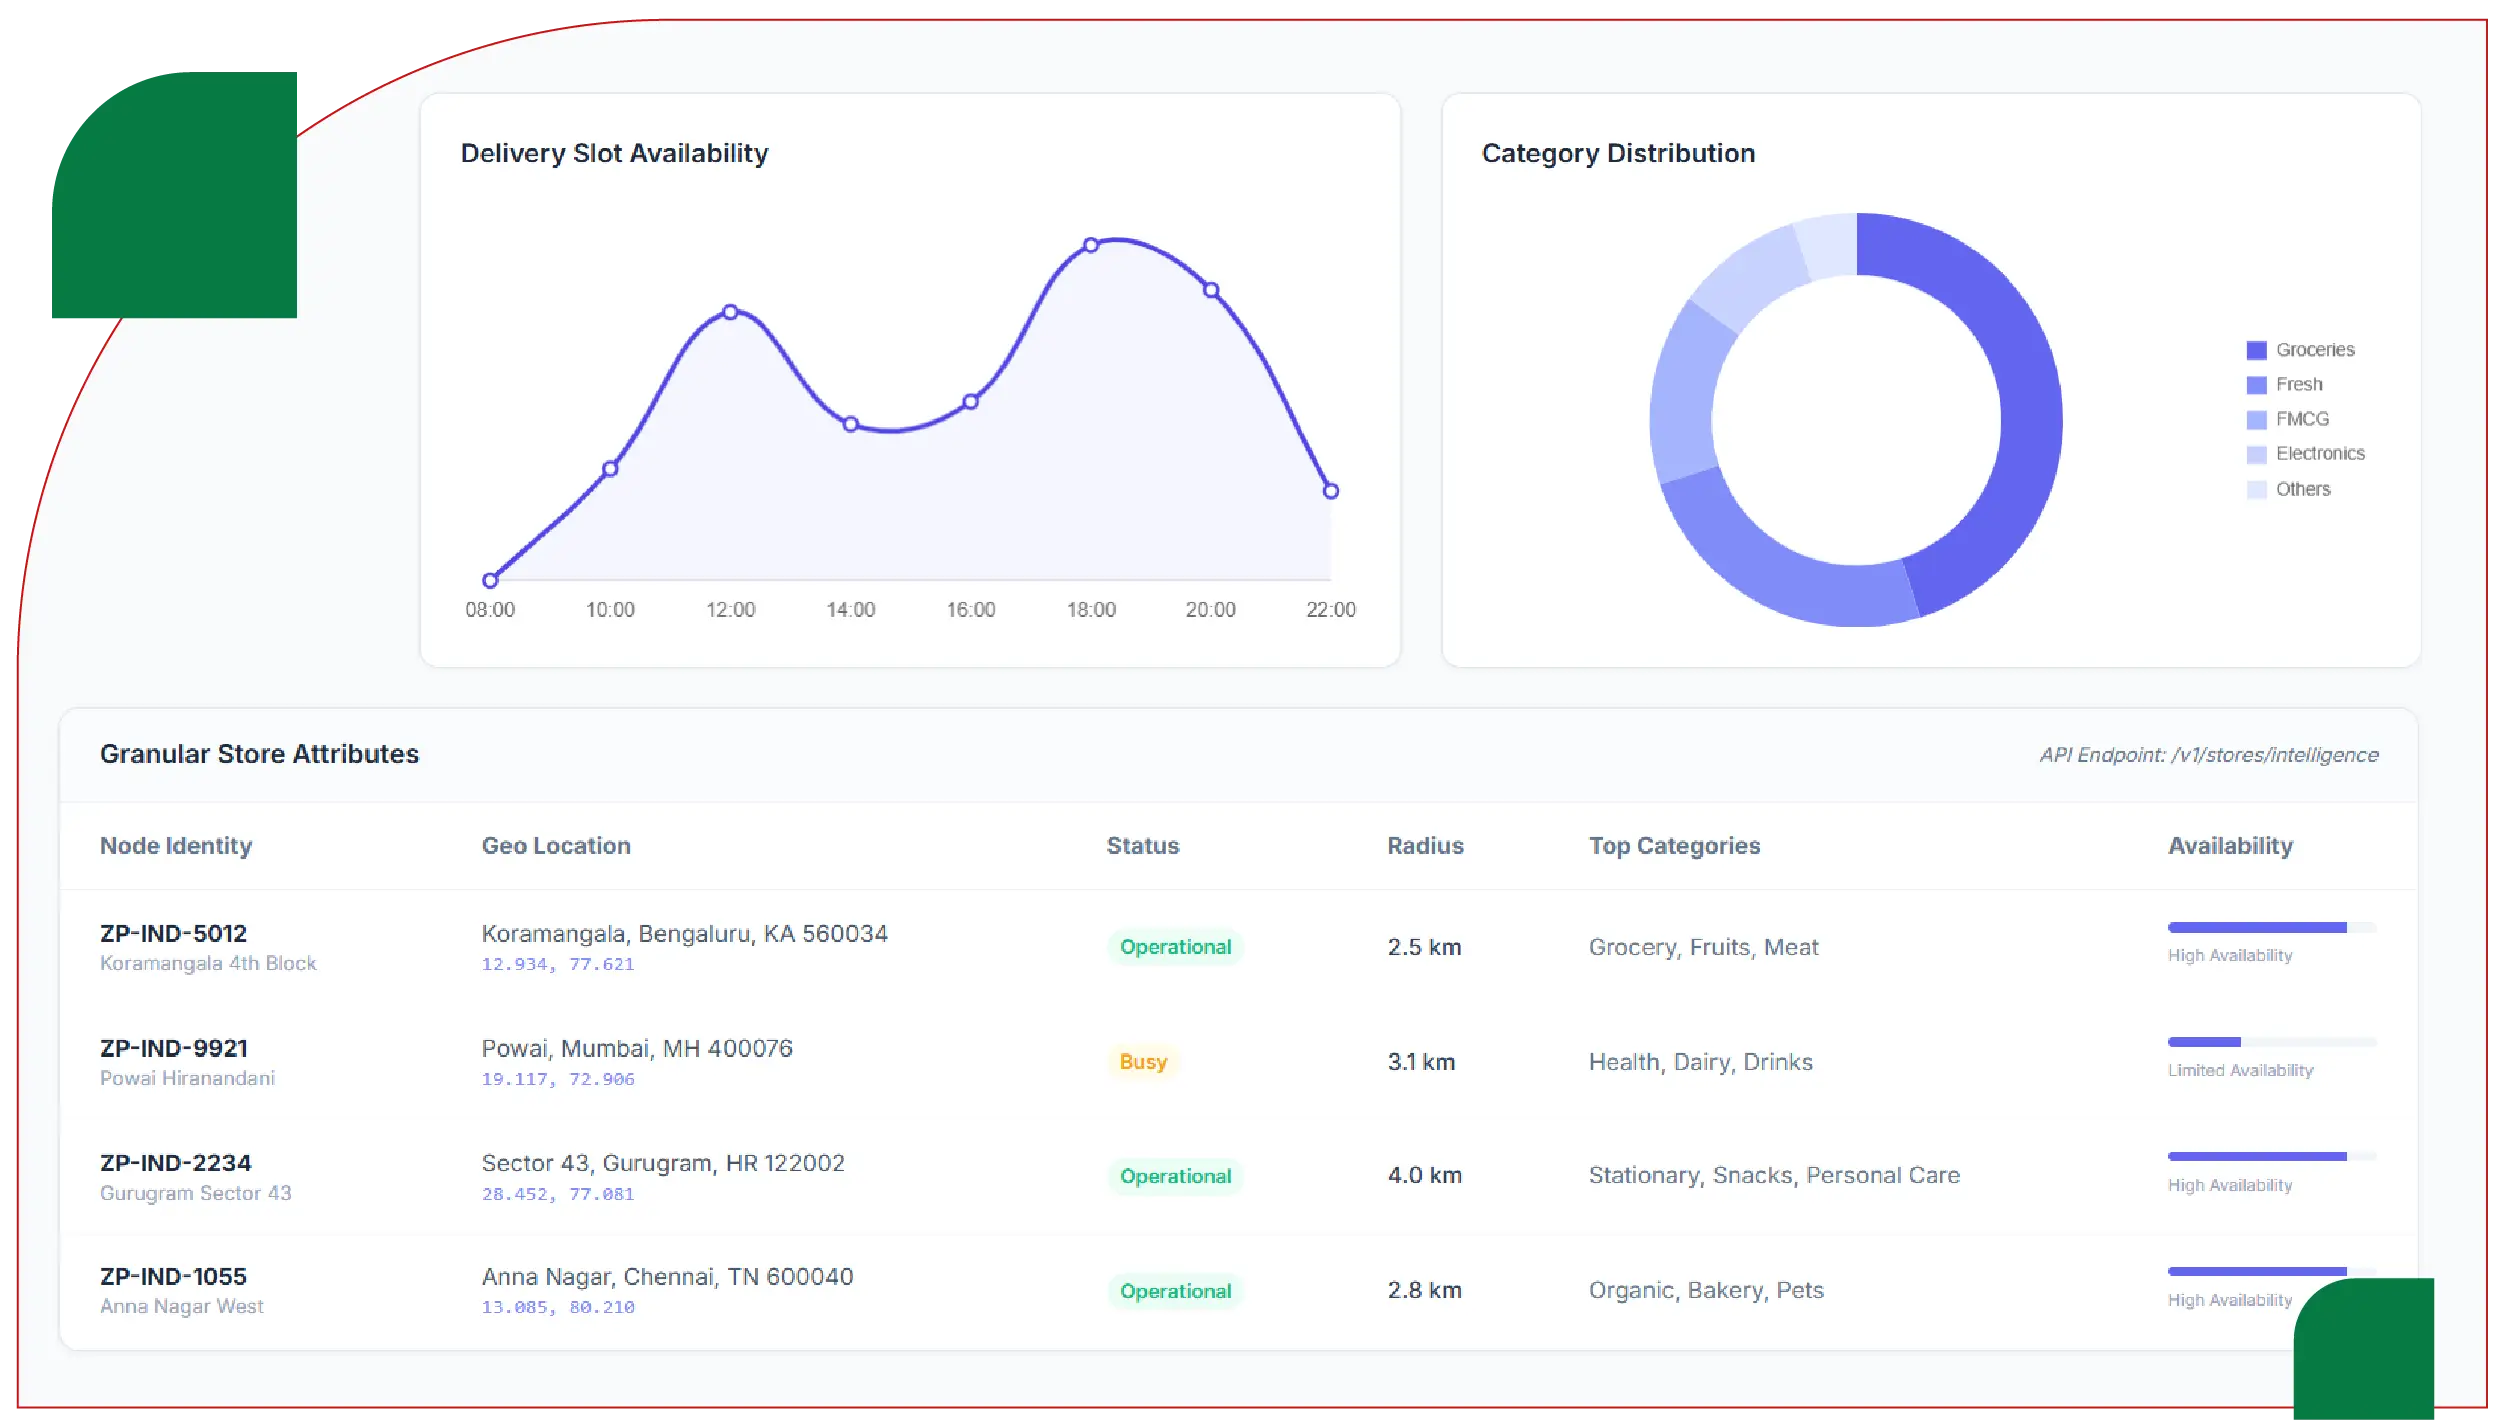
A structured Dark Store Dataset from Zepto typically includes the following attributes:
These attributes are collected using intelligent crawlers and APIs. In many cases, businesses integrate the Zepto Grocery Delivery Scraping API to automate real-time updates.
To ensure accuracy and compliance, the data extraction process generally follows these stages:
Companies that Scrape Online Zepto Grocery Delivery App Data often integrate geolocation simulation to capture service availability across multiple pin codes.
Location scraping becomes more powerful when combined with product and price-level data. For instance, Web Scraping Grocery Data can help correlate store density with SKU availability and pricing patterns.
| City | Avg SKUs per Dark Store | Fast-Moving SKUs (%) | Fresh Produce Share (%) | Out-of-Stock Rate (%) |
|---|---|---|---|---|
| Mumbai | 5,000 | 65% | 20% | 5% |
| Bengaluru | 4,600 | 62% | 22% | 6% |
| Delhi NCR | 5,300 | 68% | 18% | 4% |
| Hyderabad | 4,300 | 60% | 24% | 7% |
| Pune | 4,000 | 58% | 26% | 8% |
By integrating a Grocery Delivery Extraction API, analysts can continuously track store-level inventory and performance metrics.
Location data also enables operational modeling. Below is a hypothetical performance benchmark derived from structured scraping.
| Metric | Mumbai | Bengaluru | Delhi NCR | Hyderabad | Pune |
|---|---|---|---|---|---|
| Avg Delivery Time (mins) | 10 | 11 | 9 | 12 | 13 |
| Orders per Dark Store/Day | 1,400 | 1,200 | 1,500 | 1,000 | 900 |
| Avg Basket Value (₹) | 520 | 490 | 540 | 460 | 430 |
| Repeat Purchase Rate (%) | 72% | 68% | 75% | 62% | 60% |
These performance metrics demonstrate how location intelligence directly impacts fulfillment efficiency and customer retention.
Despite its advantages, scraping dark store data involves certain challenges:
To overcome these, advanced rotation systems, proxy management, and structured API simulation techniques are implemented.
When dark store location data is integrated with pricing, inventory, and demand signals, it forms a powerful analytics ecosystem. Companies often combine store location intelligence with SKU-level data feeds and visualization dashboards for strategic decision-making.
For example, real-time price monitoring across dark stores can be mapped into a centralized dashboard to identify regional price variation, discounting intensity, and stock movement trends.
Zepto’s dark store model represents the backbone of India’s quick-commerce infrastructure. Systematic data collection enables companies to evaluate expansion velocity, hyperlocal density, service coverage, and operational performance with precision.
When businesses implement a structured Grocery Price Tracking Dashboard, they can correlate dark store location intelligence with dynamic pricing insights to uncover deeper market patterns. Combined with advanced Grocery Data Intelligence, dark store scraping transforms raw location data into predictive analytics models for urban commerce strategy.
Ultimately, well-structured Grocery Datasets empower stakeholders to move beyond static reporting and adopt data-driven expansion planning, competitive benchmarking, and operational optimization in the fast-evolving quick-commerce ecosystem.
Are you in need of high-class scraping services? Food Data Scrape should be your first point of call. We are undoubtedly the best in Food Data Aggregator and Mobile Grocery App Scraping service and we render impeccable data insights and analytics for strategic decision-making. With a legacy of excellence as our backbone, we help companies become data-driven, fueling their development. Please take advantage of our tailored solutions that will add value to your business. Contact us today to unlock the value of your data.

