
EDA, or Exploratory Data Analysis, is an approach to analyzing data with the help of visual techniques. It discovers patterns and trends or checks assumptions using statistical summaries and graphical representations.
This blog briefly illustrates how to perform an EDA on Yelp extracted data with the help of Python scripts.
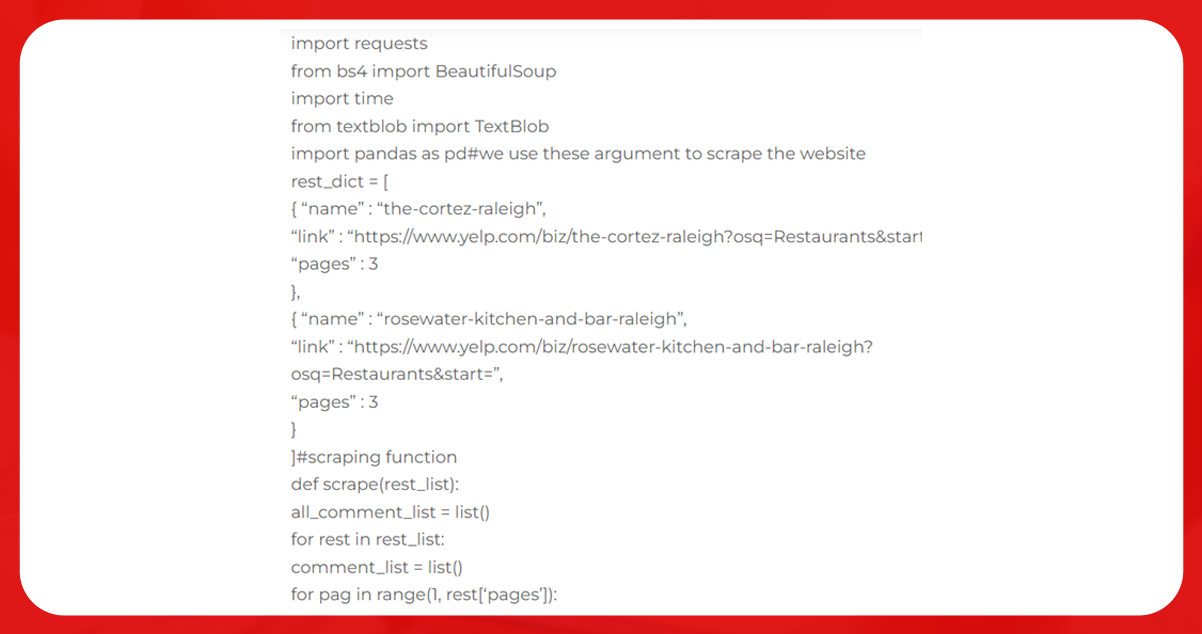
Part 3 indicates that it is the third in a series of articles that extract Yelp restaurant reviews using BeautifulSoup and then extract complete insights from the data using Machine Learning. This article will use the code to extract all the reviews in a list. The script is as follows:
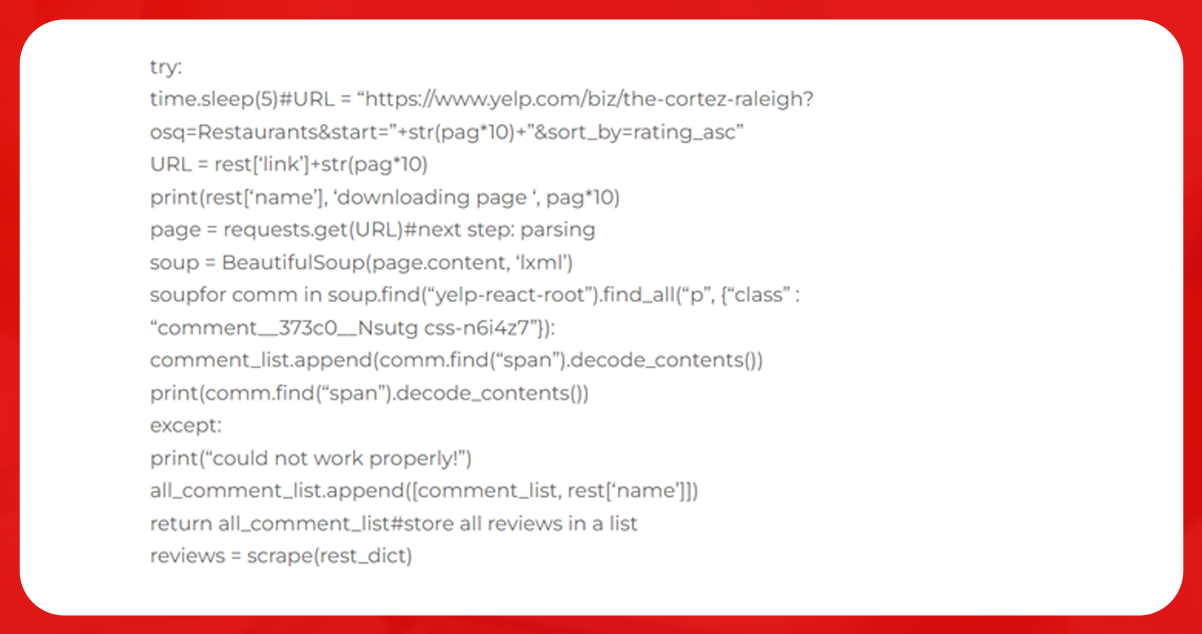
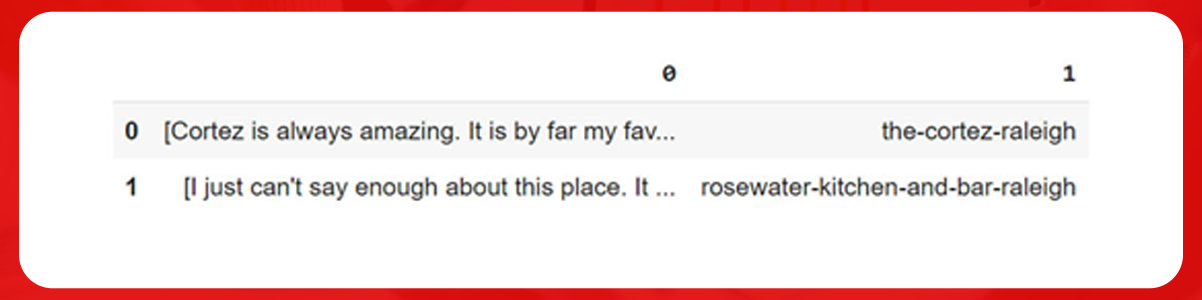
The above script saves the function output in the review’s variable. While printing the variable, the result will be nested in the following pattern.
[[[review], review2], restaurant]], [[review], review2], restaurant2]]Panda will then convert the above pattern into Data Frame.
Converting Data into Data Frame
To hold all the information available in the form of a list using the ratings and their respective elements, we must develop a Data Frame.
Here, we will make this hierarchical list into the Data Frame directly. Finally, we see a column full of listings and another column with a single restaurant title. For correctly updating the data, we are using explode function, which creates a single row for each element of the list used, for example, column 0.
As displayed in the image, the dataset is now correctly structured. Every review has its associated restaurant.
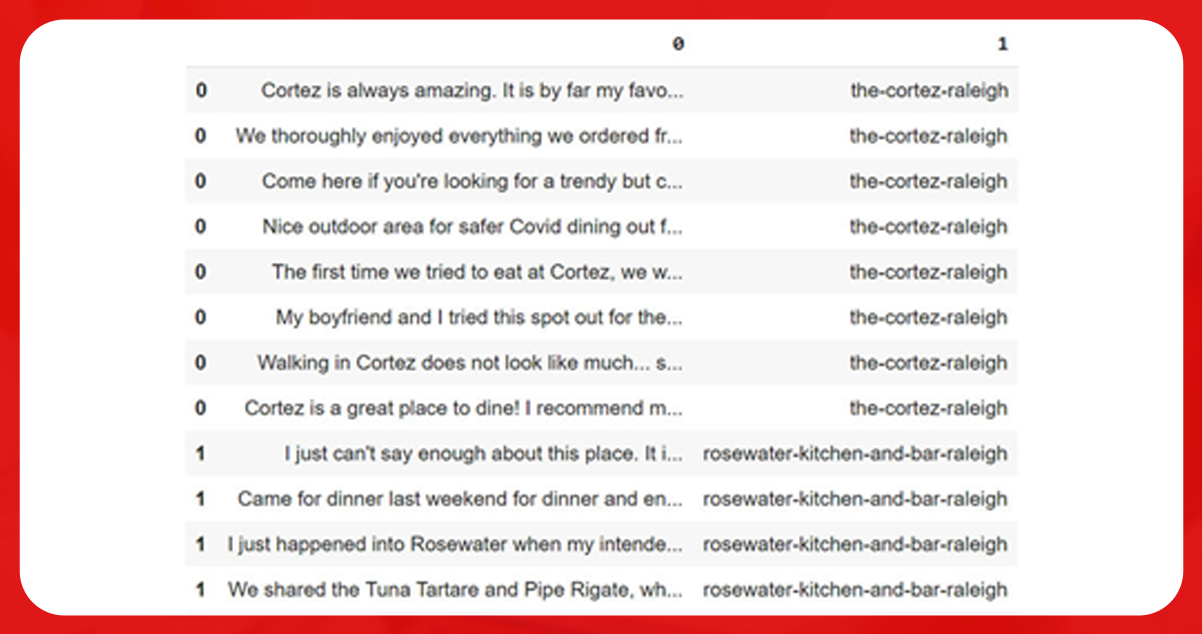
Because the numbering of current samples is 0 and 1, the only requirement left is index resetting.
df = df.reset_index(drop=True)df[0:10]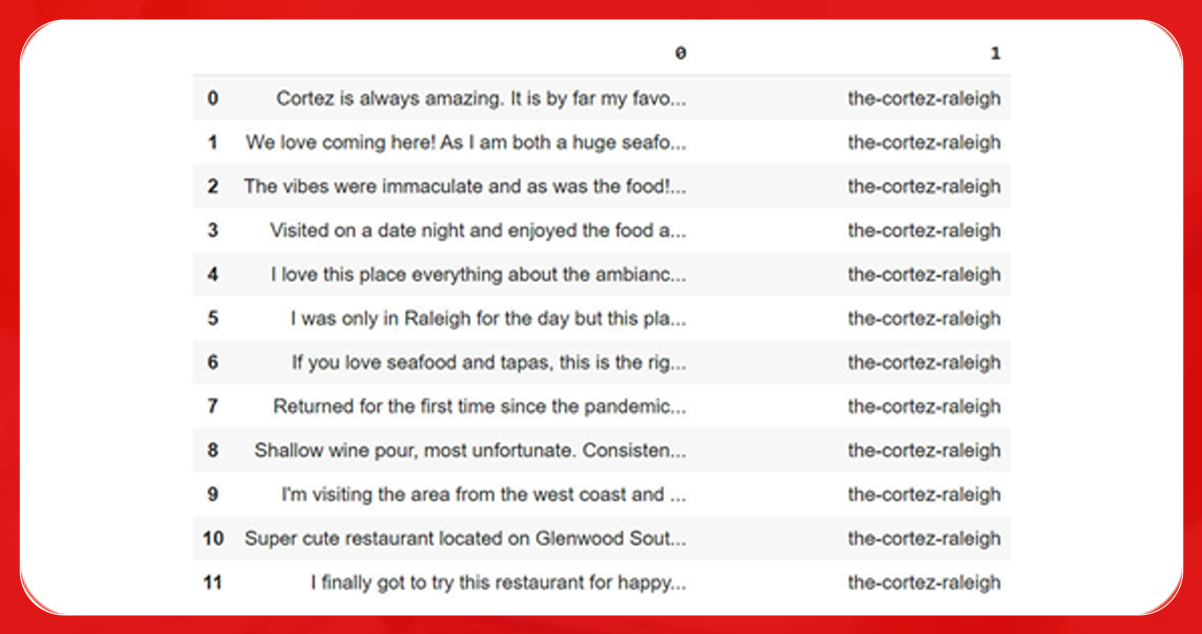
Classify Reviews Using Performance Sentiment Analysis
It is challenging to extract restaurant ratings available for each review on the website. For this purpose, you require sentiment analysis to discover a solution to the missing information. The NLP’s model interfaces related to values will replace each review’s star rating.
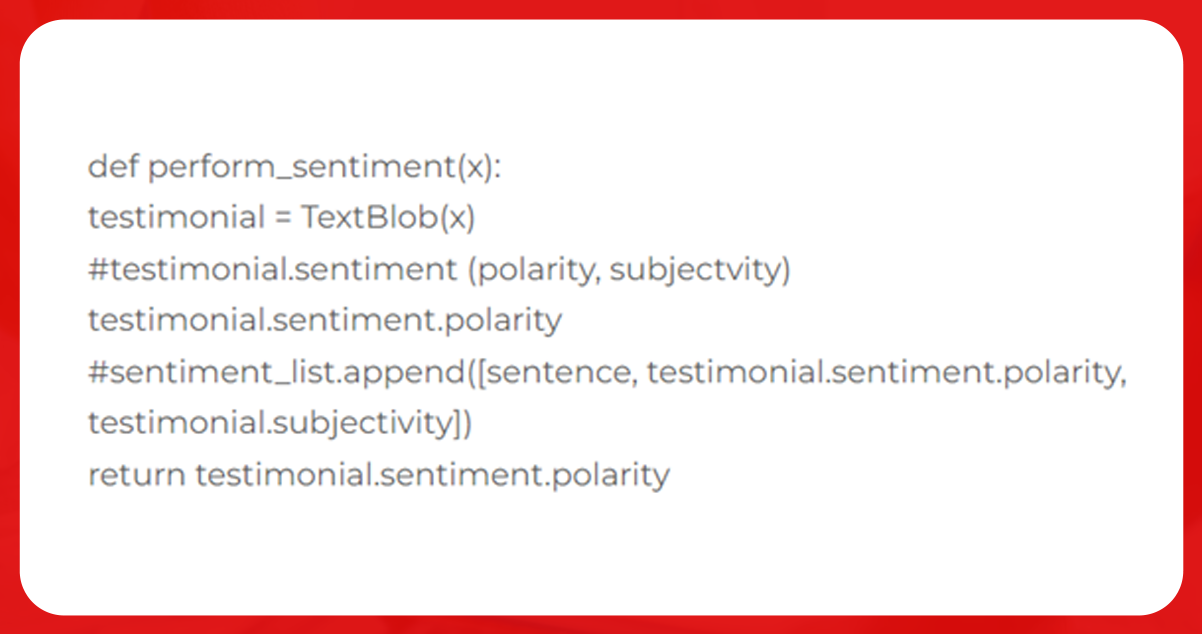
Here, we will use TestBlob, a simple library that comprises a pre-trained algorithm for the task. As we need to apply it to each review, we will first develop a function that will return the estimated sentiment of a paragraph in a range of -1 to 1.
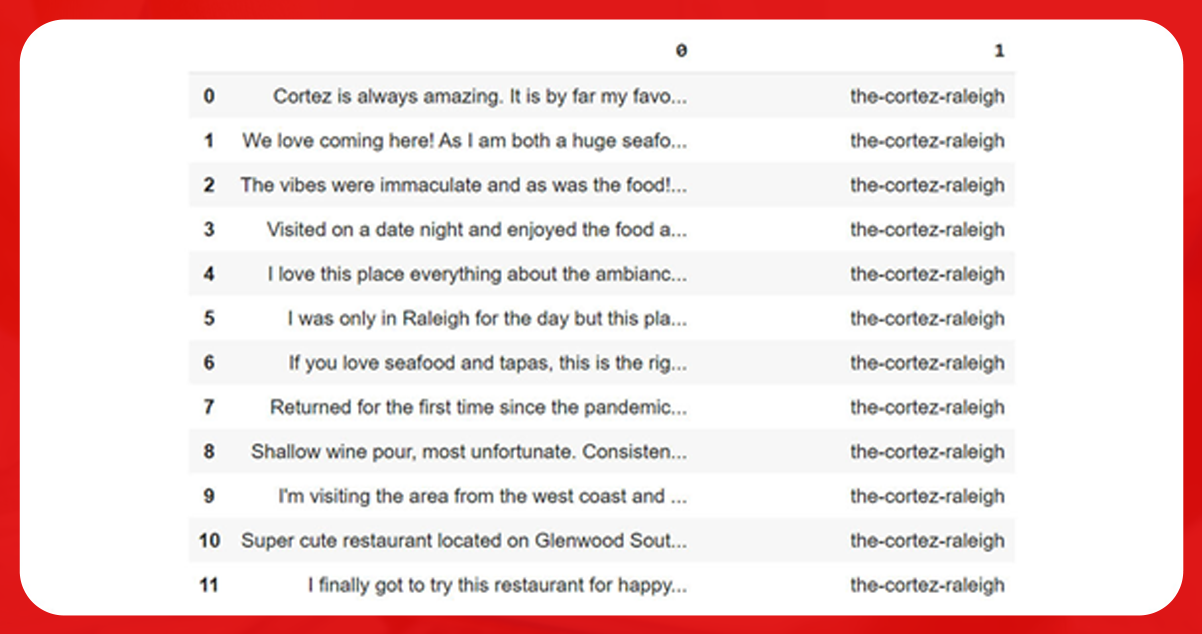
After developing the function, we will use pandas and then apply the method to add a new dataset column to hold the algorithm analysis results. The sort values method will then sort all the reviews starting with the negative ones.
The final dataset will appear like this:
Word Frequency Extraction
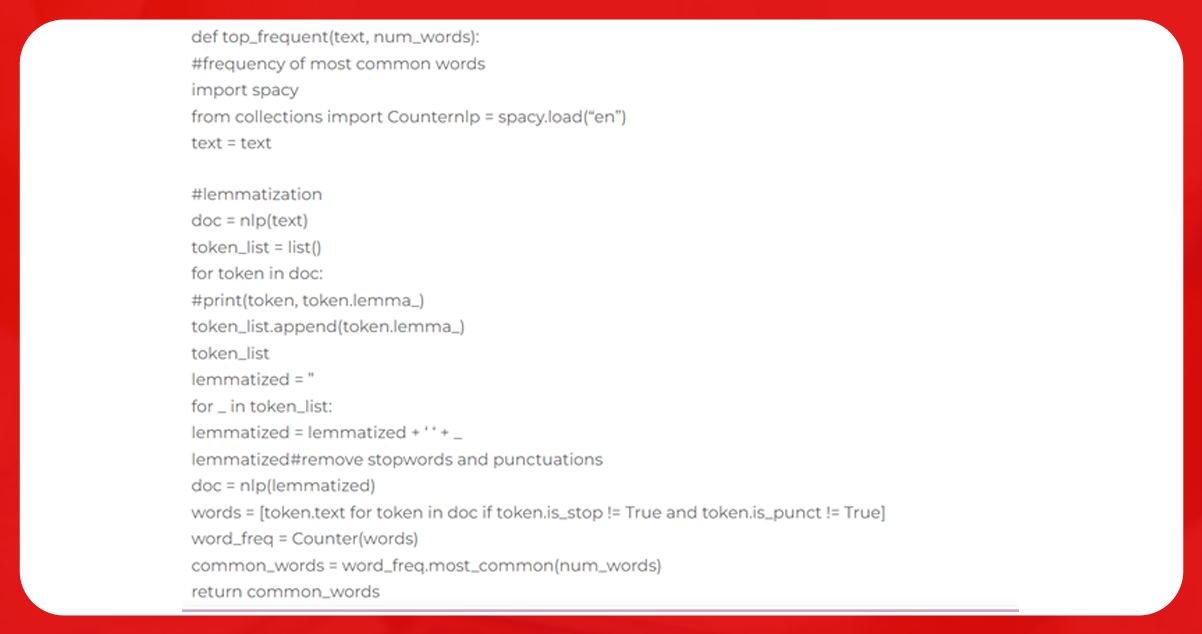
We will extract the most prominently used words in a dataset division. Although some words have the same root, like ate or eating, the algorithm will not place them in a similar category because they are different when converted to binary. Hence, we found a solution to this difficulty by employing lemmatization, which is an NLP pre-processing approach.
Lemmatizers are the basic models that are pre-trained before building. Lemmatization can isolate the core of any existing word, remove potential variation, and normalize the data. For importing a lemmatizer, we are using the spacy library.
!pip install spacy
Spacy is an open-source NLP library that consists of a lemmatizer and several pre-trained models. It will lemmatize almost all the words in a single message and provide each term’s frequency. We will then arrange the results in ascending order to identify which word appears the most in the evaluations.
Next, we will extract the most common words from the worst-rated reviews rather than the complete reviews. Place the worst reviews in the front by sorting all the information. The remaining one will create a unique string containing all the reviews. We use a joint function to convert the review list into a string.
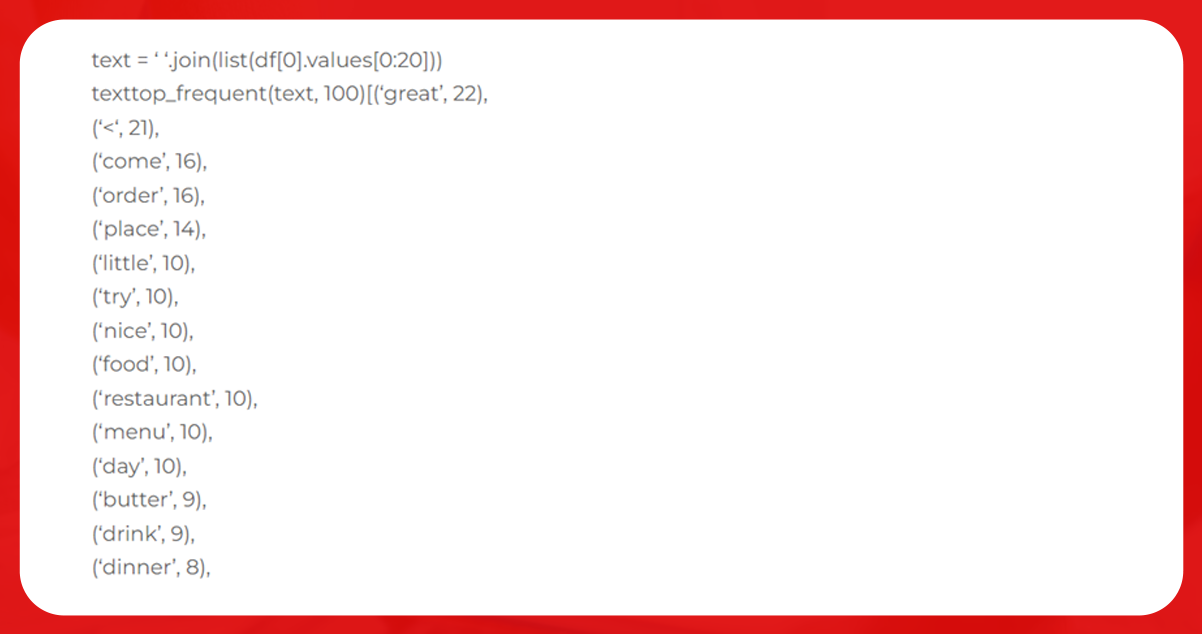
EDA on Yelp Dataset
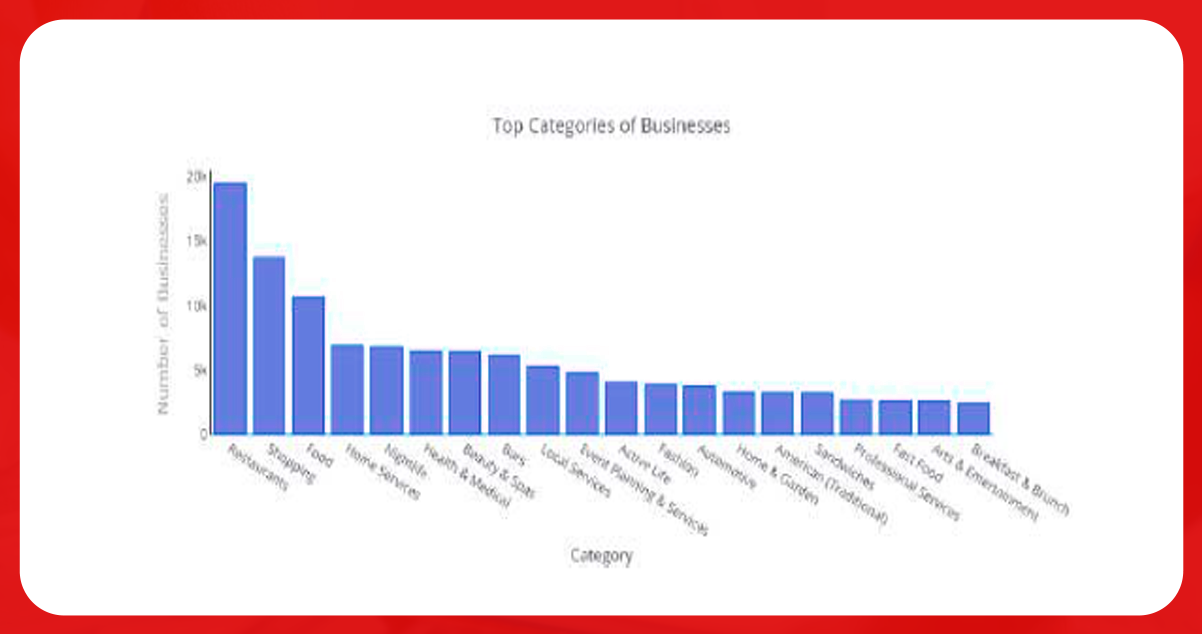
Plot the graph using Plotly and Cufflinks, Python’s library. The below figure shows that the restaurant is in the top category. In further analysis, filter the restaurant dataset to understand the best restaurants, which category is prevalent, etc.
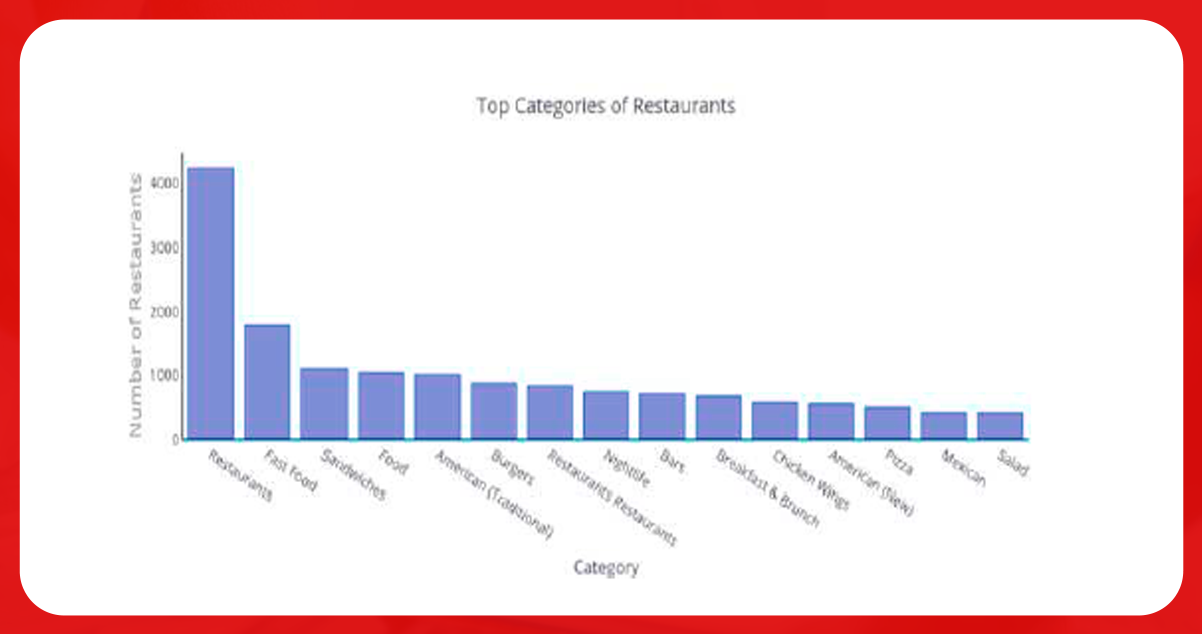
The figure below shows the most famous categories of fast food restaurants’ sandwiches and American.
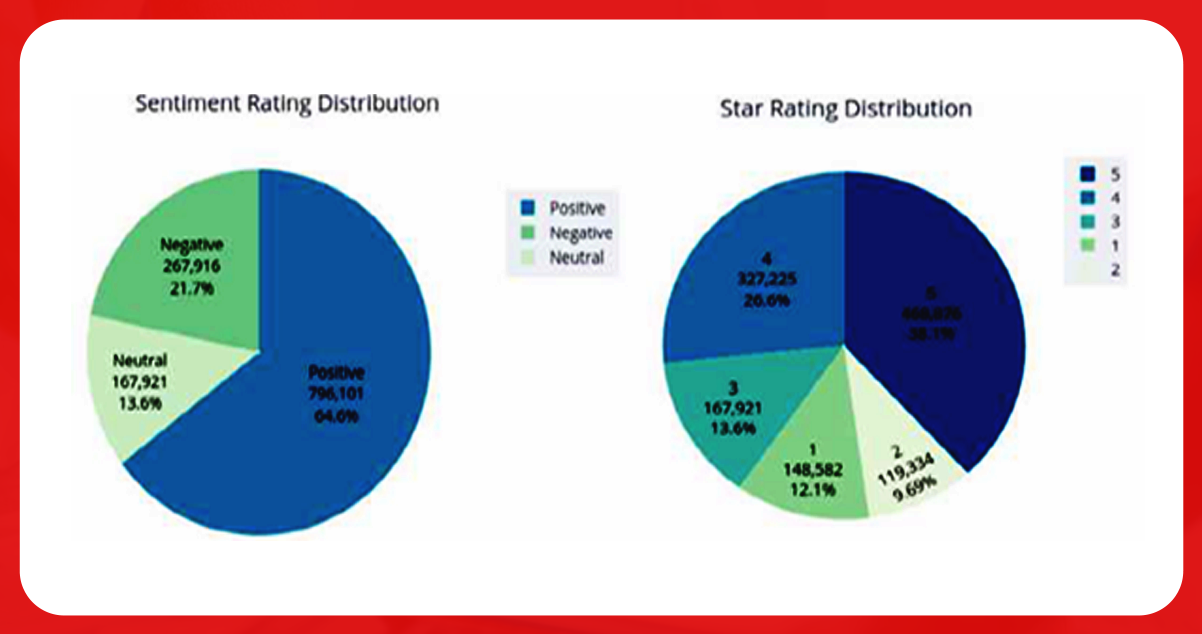
Understand the ratings of the restaurants by classifying the ratings into positive, negative, and neutral. The 4-star and above corresponds to positive, 2-star and below means negative, and 2-4 stars mean neutral. The figure below shows that positive reviews are high and negative reviews are low.
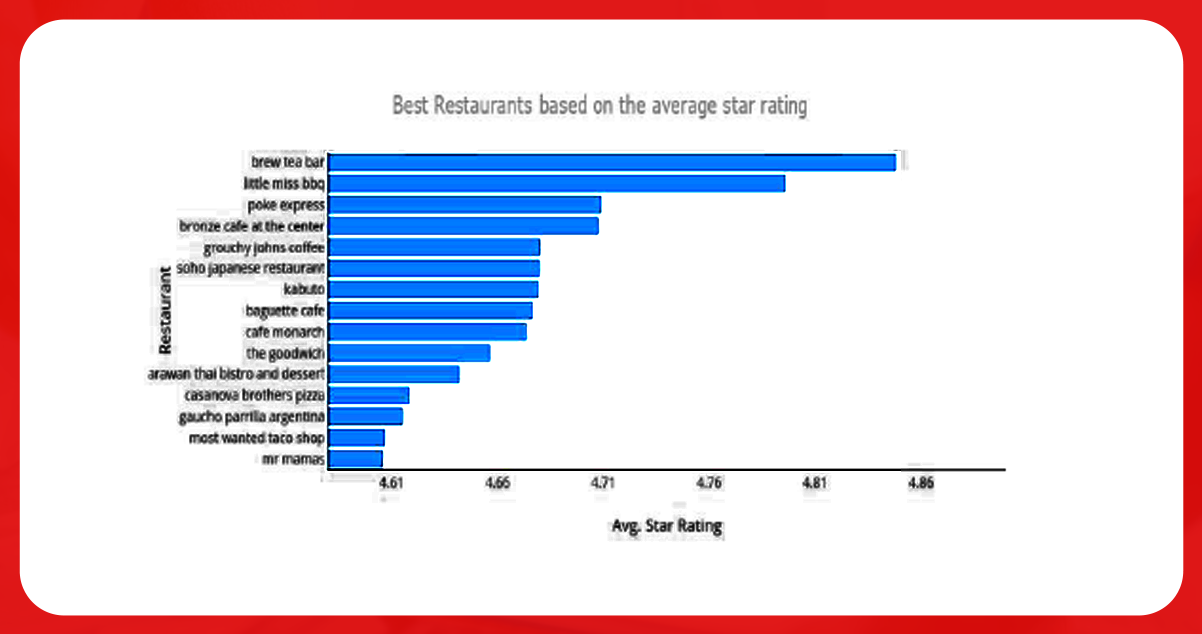
The following figure represents the best restaurants based on their average star ratings and indicates how EDA works best in narrowing down the dataset to get the best restaurants.
Conclusion:
Data understanding is essential to make informed decisions, and EDA works best. EDA on Yelp extracted data helps availing several insights like the most crucial category, highly demanding restaurant type, high and low-rated restaurants, etc.
For more information, get in touch with Food Data Scrape now! You can also reach us for all your food data scraping and mobile app data scraping service requirements.

