The Brief: Acquisition Diligence in a Fragmented Market
The client — a European hospitality investor with a track record of restaurant roll-ups in continental Europe — had identified the UK as its next priority market. The UK hospitality sector had been through several disruptive years and the investor believed the moment was right to consolidate fragmented mid-tier operators into a stronger combined platform.
The challenge was visibility. The investor could easily list the headline chains — Wagamama, Nando's, Pizza Express, Wahaca, and dozens of others — but those were not the acquisition targets. The targets were independents and small regional groups with 3 to 15 outlets that operated below the radar of broker networks and investment-bank coverage. Identifying those operators required visibility into the long tail, not just the visible chains.
Standard sources fell short. Industry reports covered the top 100 operators but ignored independents. Mapping services listed outlets but lacked operator attribution. Existing M&A databases were stale and London-skewed. The investor needed a UK-wide restaurant database that captured every meaningful outlet, attributed it to a parent operator where one existed, and made the chain-versus-independent split immediately analyzable.
They engaged a specialist data partner to deliver it.
Methodology: How the Chain + Independent Database Was Built

- Multi-source aggregation. Public restaurant listings, delivery platform listings (Deliveroo, Just Eat, Uber Eats UK), chain corporate directories, mapping data, and review platform records were combined into a single harmonized layer. Each source was tagged so analysts could trace any record back to its origin.
- Operator attribution. The defining feature of the database was its operator-attribution layer. Every outlet was matched to a parent operator where applicable — recognized chains, regional groups, independent multi-site operators, and standalone independents were each classified explicitly. This taxonomy turned a flat outlet list into an acquisition-ready operator landscape.
- City and regional anchoring. Outlets were captured across all major UK metros including London (with borough-level resolution), Manchester, Birmingham, Leeds, Glasgow, Edinburgh, Bristol, Liverpool, Newcastle, Sheffield, Nottingham, Cardiff, and Belfast, plus the long tail of secondary towns.
- Menu capture. Where menu data was publicly available, dish-level records — name, description, price in GBP, category, dietary flags — were captured and linked to the parent outlet. Menu refresh was prioritized for delivery-platform-active operators where pricing changed frequently.
- Cuisine taxonomy. Each outlet was mapped into a harmonized cuisine taxonomy spanning British pub-style, Italian, Indian, Chinese, Thai, Japanese, Korean, American, Mexican, Mediterranean, Middle Eastern, vegetarian and vegan specialists, dessert and cafe, and emerging categories.
- Refresh cadence. Active delivery-platform outlets refreshed weekly; brick-and-mortar-only outlets refreshed monthly. New openings and closures triggered near-real-time updates where signal strength allowed — particularly important for the investor's diligence work, since outlet count and growth velocity were key acquisition signals.
- Quality assurance. Every record passed schema validation, address normalization, operator-attribution audit, menu-link verification, and outlier detection before reaching client systems.
Sample Data: What the Database Captured
The following sample tables illustrate the structure and depth of the UK Restaurant Database.
Sample 1: Restaurant Density by Region
| Region | Total Outlets | Chains | Independents | Independent Share |
|---|---|---|---|---|
| Greater London | 24,800 | 6,200 | 18,600 | 75.0% |
| North West (Manchester, Liverpool) | 12,400 | 3,900 | 8,500 | 68.5% |
| West Midlands (Birmingham) | 9,600 | 3,100 | 6,500 | 67.7% |
| Yorkshire (Leeds, Sheffield) | 9,100 | 3,000 | 6,100 | 67.0% |
| Scotland (Glasgow, Edinburgh) | 8,700 | 2,700 | 6,000 | 69.0% |
| South West (Bristol, Bath) | 6,900 | 2,200 | 4,700 | 68.1% |
| North East (Newcastle) | 4,800 | 1,600 | 3,200 | 66.7% |
| Wales (Cardiff) | 4,500 | 1,500 | 3,000 | 66.7% |
| Northern Ireland (Belfast) | 3,200 | 1,000 | 2,200 | 68.8% |
Sample 2: Cuisine Mix Across the UK
| Cuisine Category | Active Outlets | Share of Total |
|---|---|---|
| British Pub / Casual British | 18,400 | 21.5% |
| Indian | 12,800 | 15.0% |
| Italian / Pizza | 11,200 | 13.1% |
| Cafe / Coffee | 8,400 | 9.8% |
| Chinese | 6,900 | 8.1% |
| Asian Fusion / Pan-Asian | 5,200 | 6.1% |
| Turkish / Middle Eastern | 4,300 | 5.0% |
| Thai | 2,800 | 3.3% |
| American Casual | 2,600 | 3.0% |
| Vegetarian / Vegan | 1,900 | 2.2% |
| Other | 11,200 | 12.9% |
Sample 3: Regional Pricing Benchmarks (Casual-Dining Main Course in GBP)
| Region | Chain Average | Independent Average | Independent Premium |
|---|---|---|---|
| Greater London | £14.80 | £17.60 | +18.9% |
| South East | £13.20 | £15.40 | +16.7% |
| North West | £11.40 | £13.10 | +14.9% |
| Yorkshire | £11.10 | £12.80 | +15.3% |
| Scotland | £12.50 | £14.40 | +15.2% |
| West Midlands | £11.30 | £12.90 | +14.2% |
| Wales | £10.80 | £12.40 | +14.8% |
| Northern Ireland | £10.50 | £12.10 | +15.2% |
Sample 4: Mid-Tier Operator Profile Sample
| Operator | Outlets | Cuisine | Regions Present | Estimated Tier |
|---|---|---|---|---|
| Operator A | 12 | Asian Fusion | London + Manchester + Leeds | Roll-up candidate |
| Operator B | 8 | Italian Casual | London + Bristol + Bath | Roll-up candidate |
| Operator C | 6 | Indian Modern | London + Birmingham | Boutique add-on |
| Operator D | 14 | British Casual | NW + Yorkshire | Platform candidate |
| Operator E | 5 | Mediterranean | London + South East | Boutique add-on |
| Operator F | 11 | Thai | Multi-region | Roll-up candidate |
Sample 5: Operator-Attribution Confidence
| Confidence Tier | Share of Records | Use Case |
|---|---|---|
| Verified chain / group | 32% | Direct M&A targeting |
| Probable group affiliation | 14% | Secondary diligence |
| Single-site independent | 47% | Long-tail mapping |
| Unclear / under review | 7% | Manual investigation required |
These tables represent a portion of the full UK dataset, which captured outlet, operator, menu, pricing, and cuisine detail across the entire restaurant landscape.
Key Findings
The database surfaced several findings that directly shaped the client's acquisition strategy.
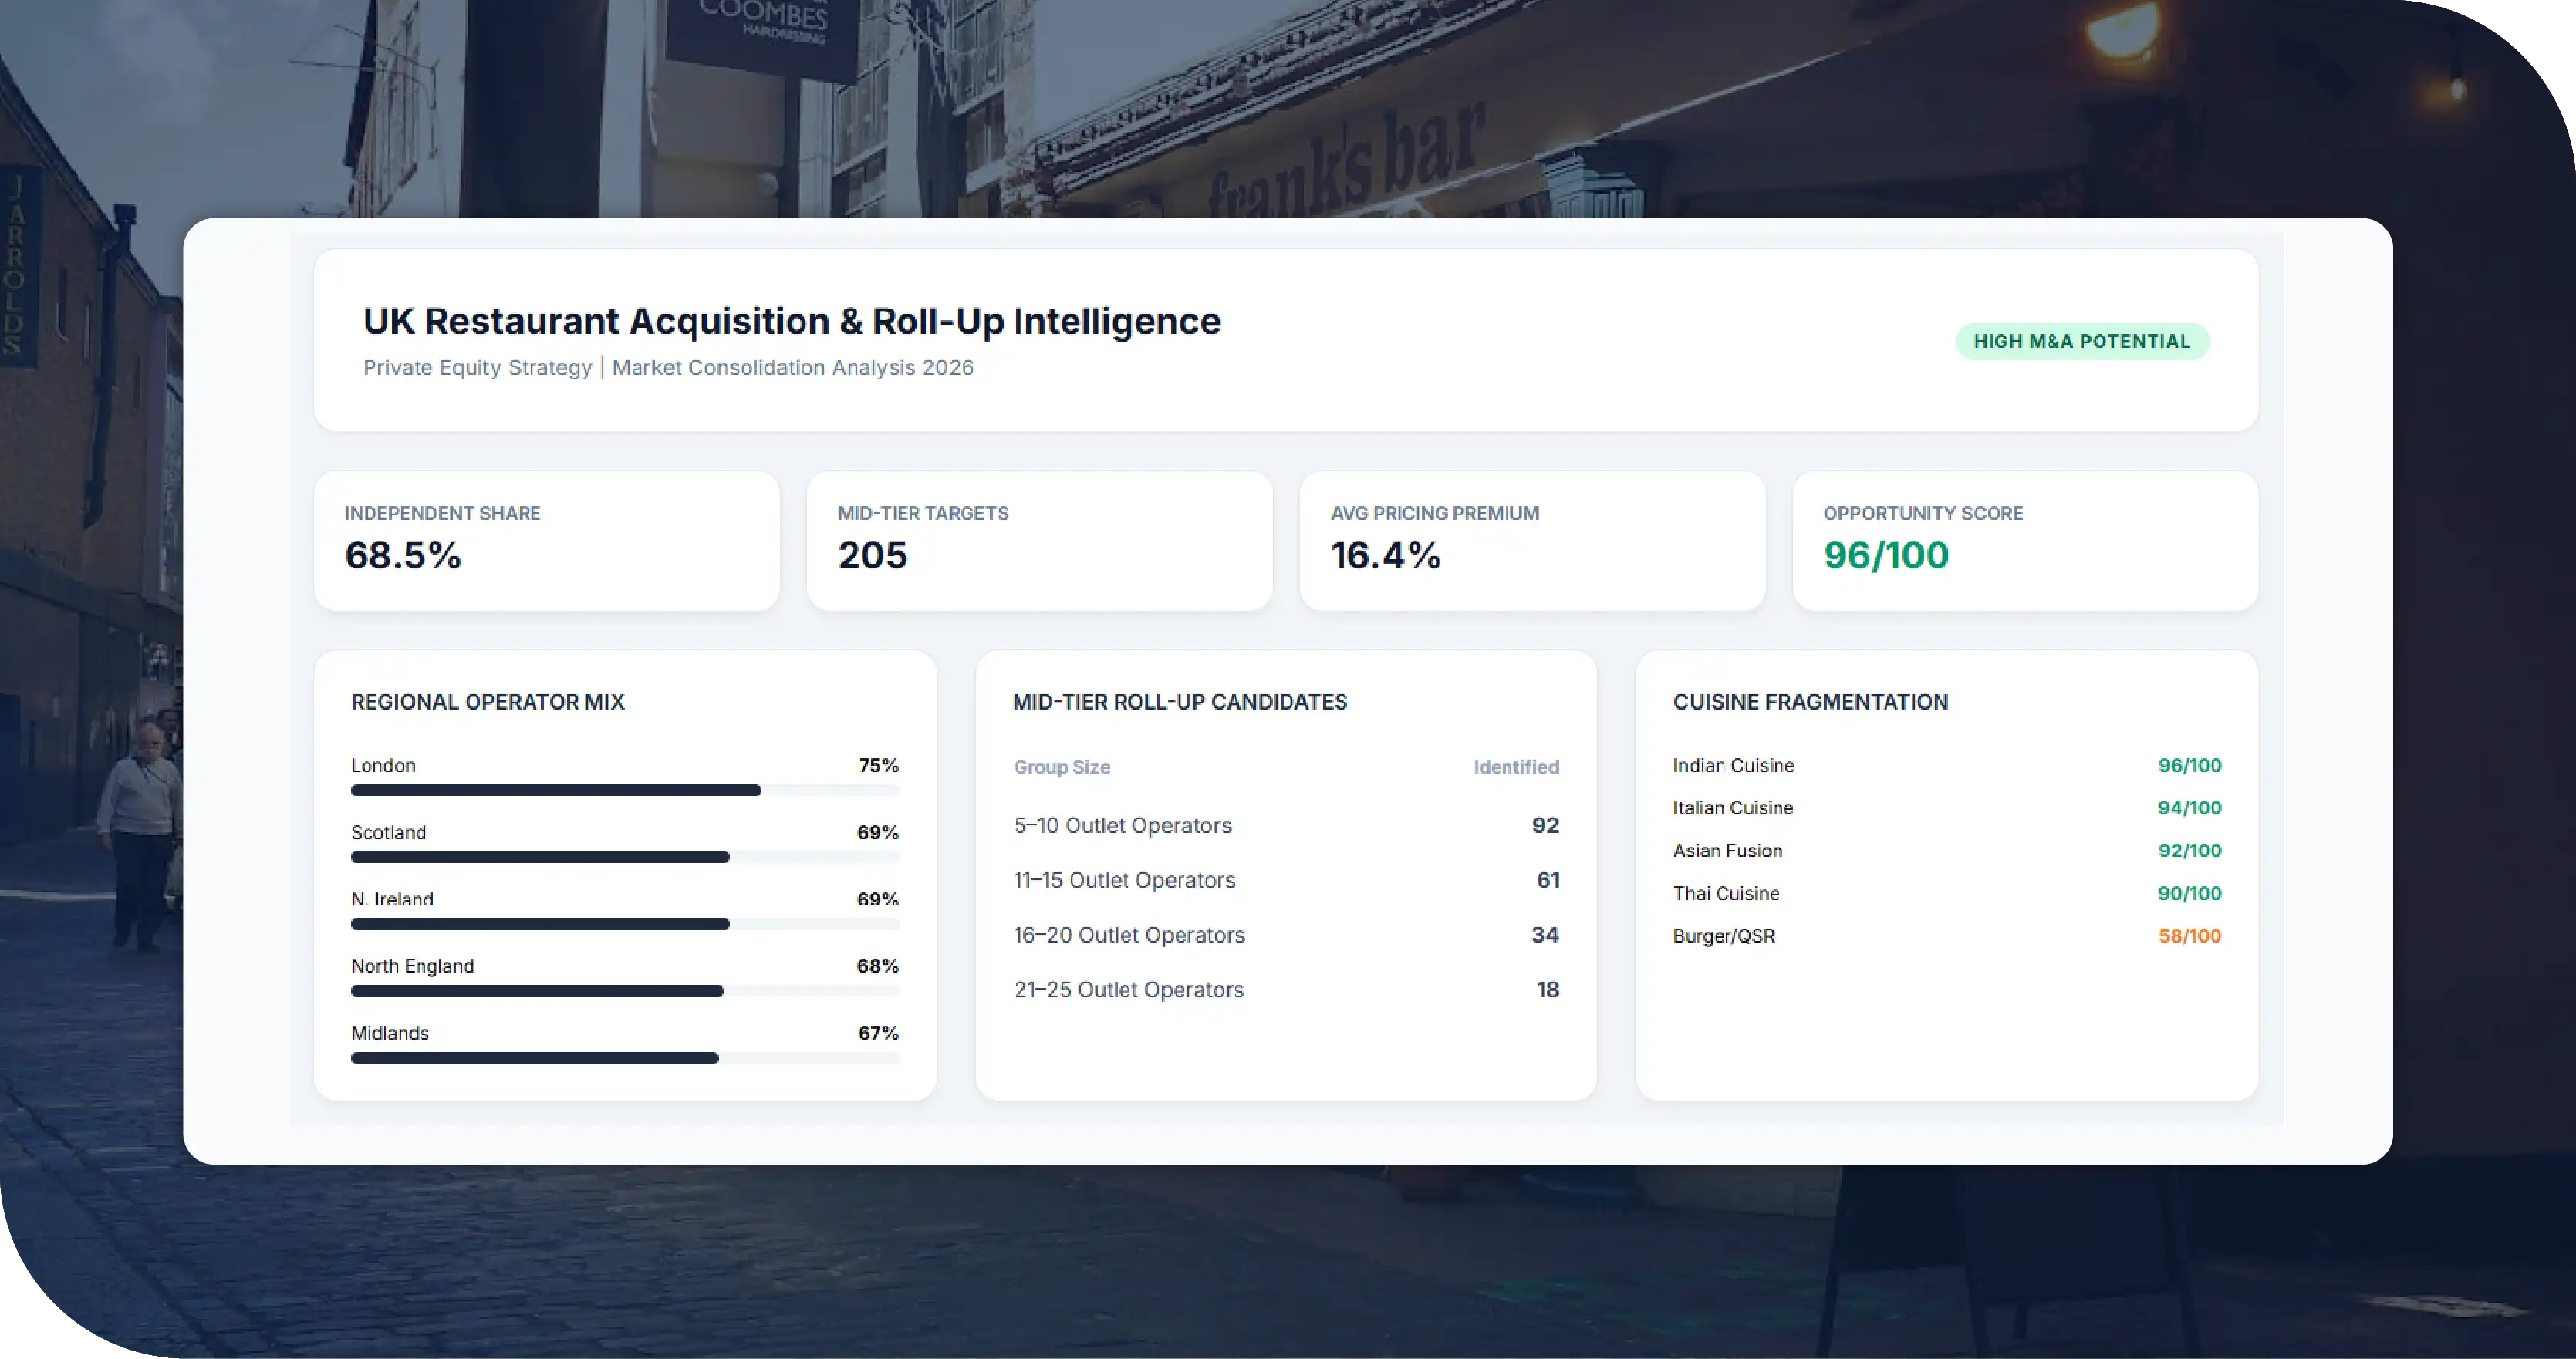
- Independent operators dominate every UK region. Even in London — the most chain-heavy market — independents accounted for 75 percent of outlets. Regional independent shares clustered around 67 to 69 percent. For a roll-up investor, this confirmed that the acquisition opportunity sat squarely in the long tail, not in competing for headline chains.
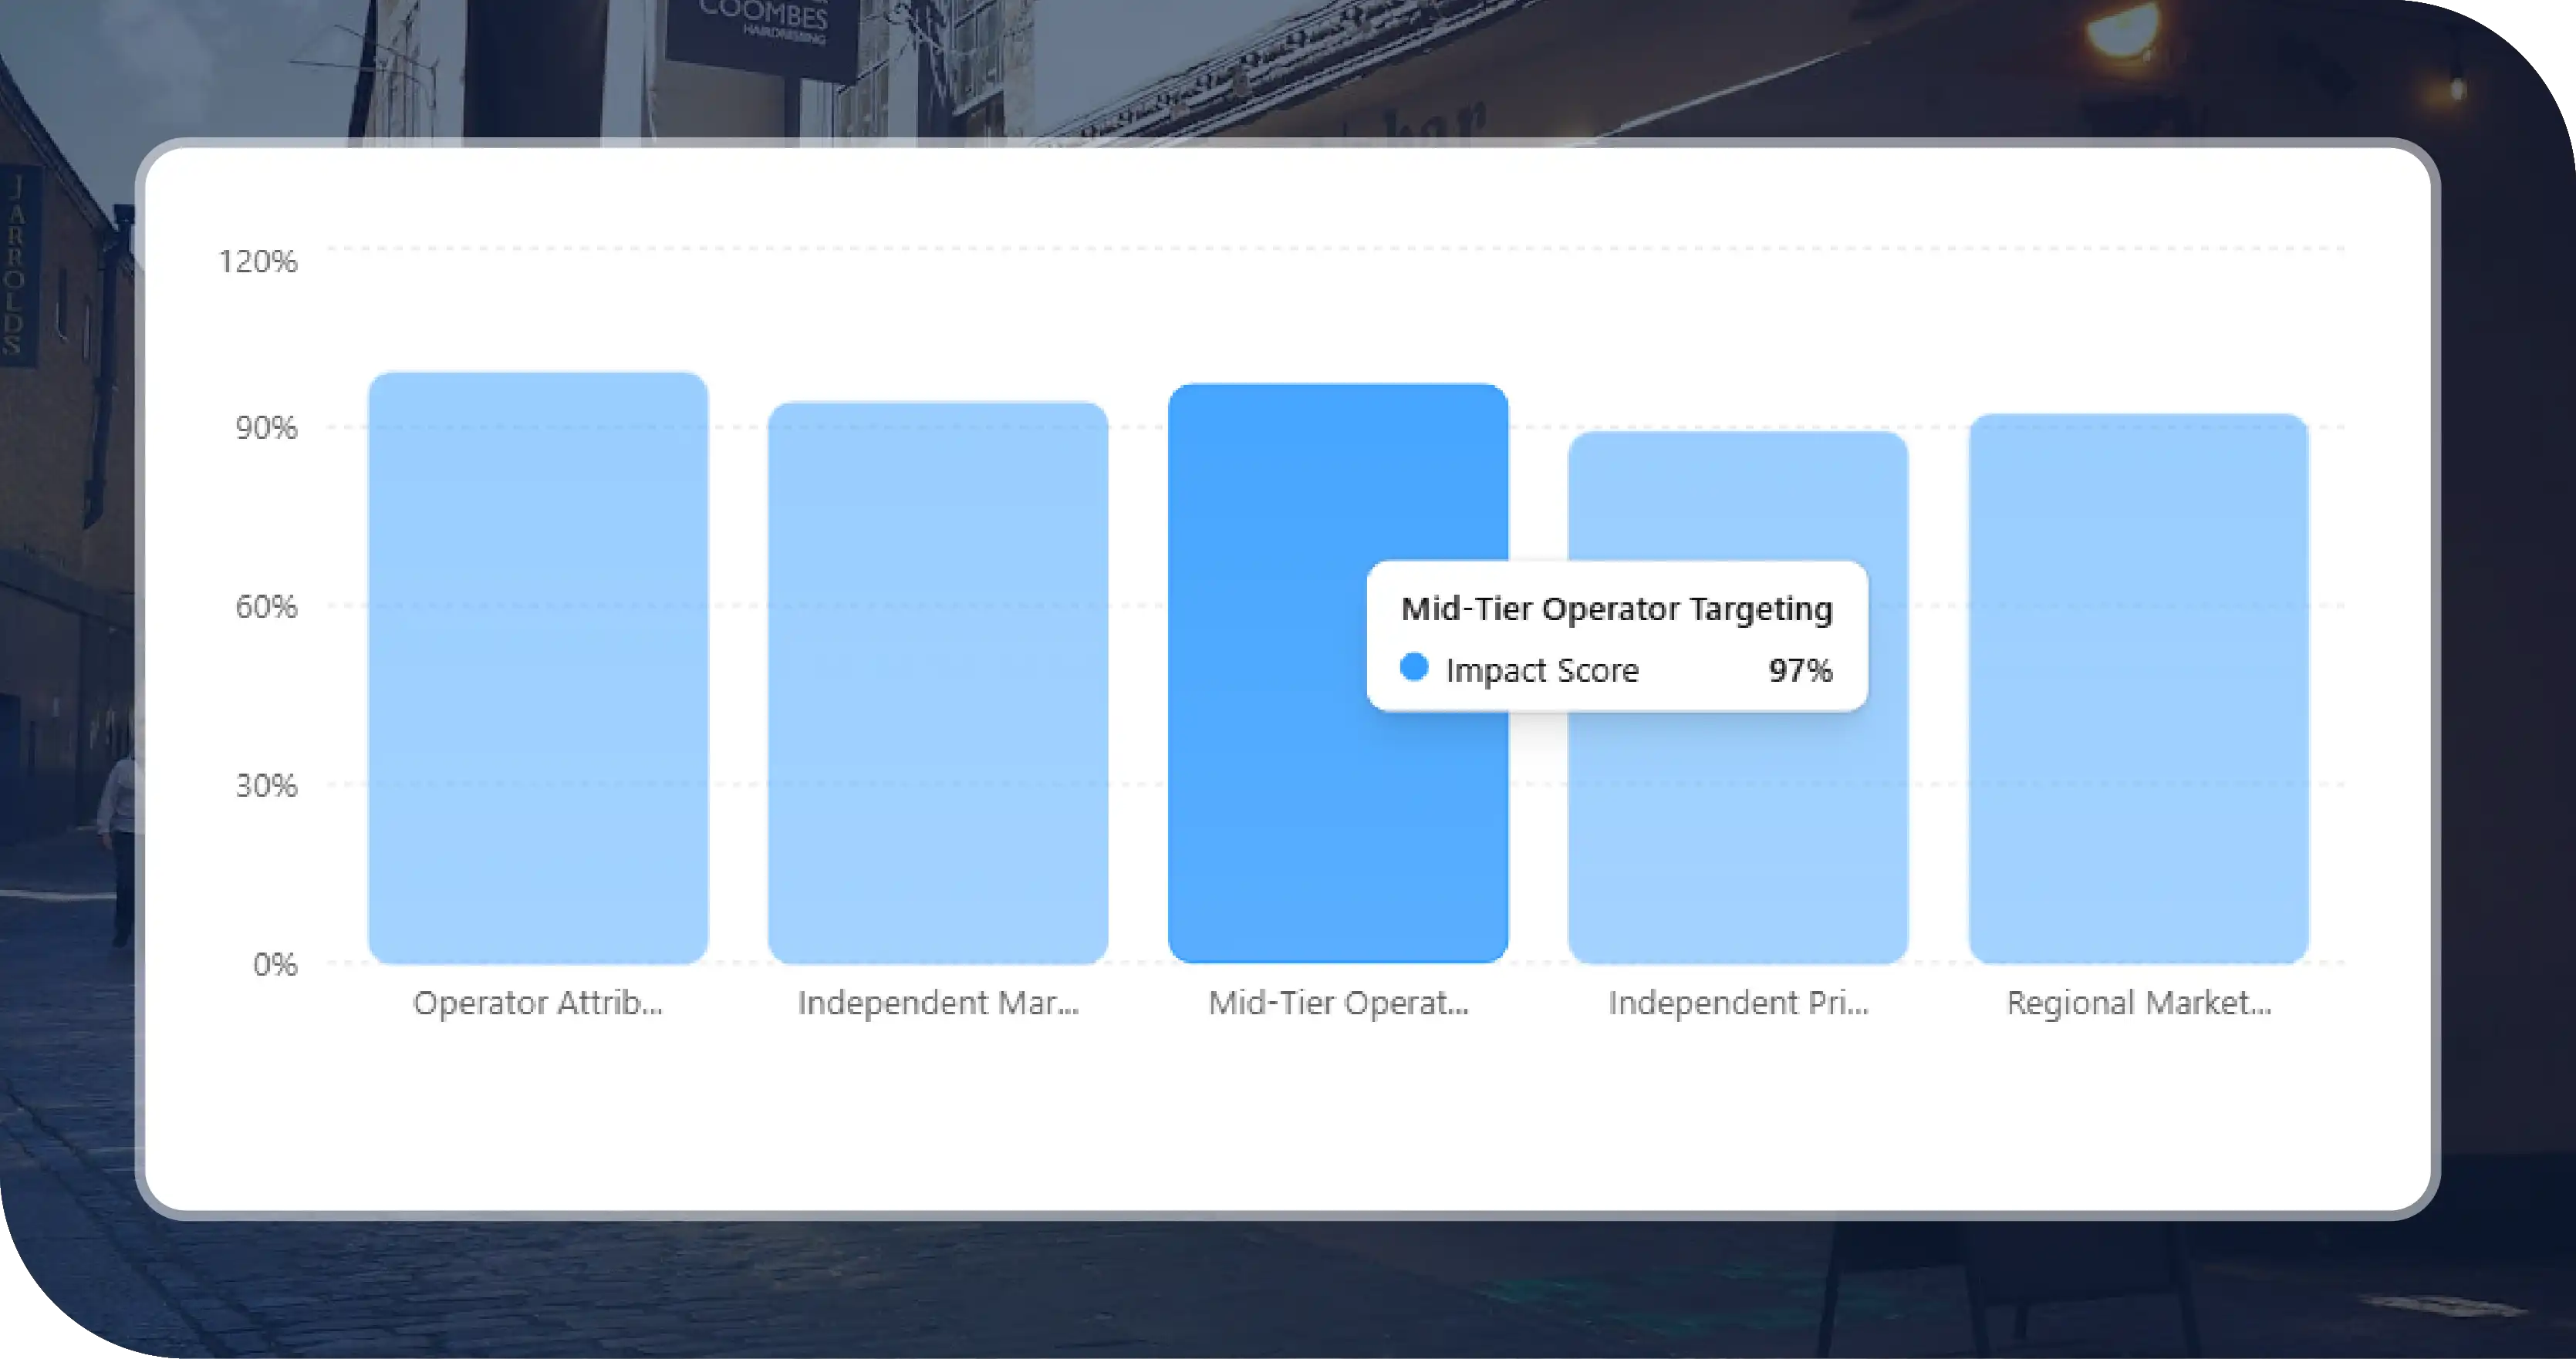
- Mid-tier multi-site operators are surprisingly numerous outside London. The database identified more than 200 operators running 5 to 25 outlets — a category broker networks routinely undercount. These mid-tier operators became the investor's primary roll-up candidate pool.
- Independent pricing premium is consistent across regions. Independents priced casual-dining mains 14 to 19 percent above chain equivalents in every region, with London showing the highest premium at 18.9 percent. This consistency told the investor that independent pricing power was structural, not regional anomaly.
- Indian and Italian categories are particularly fragmented. Both categories showed high outlet density, low chain concentration, and a deep mid-tier operator layer — characteristics that often produce attractive roll-up economics.
- Asian fusion and Thai operators are under-consolidated. Both categories had several multi-site operators in the 6-to-15-outlet range but no dominant national chain. For an investor building a regional Asian-cuisine platform, these categories offered cleaner roll-up paths than more mature segments.
- Scotland and Northern Ireland show distinct competitive dynamics. Both nations had lower chain density and stronger independent operator multi-site groups than equivalent English regions, suggesting that a regionally-led roll-up strategy would likely outperform a generic UK-wide approach.
- Operator attribution confidence determines diligence cost. With 32 percent of records verified-chain and 14 percent probable-group, more than half the operator-attribution work was reliable from day one. The remaining records were prioritized for manual diligence based on acquisition relevance.
How the Client Used the Findings
Armed with the UK Restaurant Database, the client made three concrete decisions.
First, they shifted acquisition focus from London-only to multi-region. The data made clear that strong mid-tier operators existed across the North West, Yorkshire, and Scotland — markets the investor had previously underweighted. Instead of a London-centric roll-up, they built a multi-region acquisition map.
Second, they prioritized Indian, Italian, and Asian fusion as initial roll-up categories. The fragmentation, deep mid-tier layer, and absence of dominant chains in these categories produced the cleanest roll-up economics. The investor sequenced its acquisition pipeline accordingly.
Third, they built a longlist of 47 named operators as initial outreach targets. The database's operator-attribution layer allowed the investor to move directly from analysis to outreach without an additional research phase — accelerating the diligence cycle by months.
The result was an acquisition program grounded in operator-level evidence rather than broker-level chatter — exactly the outcome the engagement was designed to deliver.
Why the Data Approach Mattered
The alternative to a comprehensive operator-attributed database would have been the traditional approach: broker networks, industry conferences, and intuition. That approach would have surfaced the same dozen headline operators every other investor was already chasing — driving valuations up and competitive returns down.
The UK Restaurant Database changed the decision entirely. By providing operator-attributed coverage of the long tail, the database revealed roll-up targets that broker networks were not actively marketing. This is the core value of comprehensive restaurant data: it surfaces opportunity that intuition and broker chatter cannot.
Lessons for Other Markets
- Operator attribution is the difference between an outlet list and a deal pipeline. Without parent-operator attribution, even a comprehensive outlet database cannot directly support acquisition targeting. Attribution is the single most valuable analytical layer for M&A use cases.
- Independents dominate most national markets. Most national restaurant markets have independent shares of 60 to 80 percent. Strategies built around chain-only data systematically miss the majority of the market.
- Mid-tier operators are the M&A sweet spot. Operators running 5 to 25 outlets are typically too small for broker attention but too large to be invisible. Capturing this band reliably is where roll-up opportunity concentrates.
- Pricing premium for independents is remarkably consistent. Across most national markets, independents sustain a 12 to 20 percent pricing premium over chains. This premium is structural and should be modeled into post-acquisition pricing strategy.
- Regional dynamics matter more than national averages. National averages obscure roll-up opportunity. Regional and city-level analysis routinely reveals competitive structures that look very different from the national picture.
These lessons illustrate why comprehensive, operator-attributed restaurant data repays its cost many times over.
Engagement Outcomes at a Glance
| Outcome Area | Before the Database | After Acting on the Database |
|---|---|---|
| Geographic focus | London-centric | Multi-region (NW, Yorkshire, Scotland prioritized) |
| Cuisine prioritization | Generic casual dining | Indian, Italian, Asian fusion sequenced |
| Acquisition longlist | Broker-dependent | 47 directly identified operators |
| Diligence cycle | Multi-month research phase | Compressed by months |
| Roll-up thesis | Generic UK consolidation | Regional, category-specific platform builds |
The engagement converted a broker-dependent, London-centric thesis into a disciplined, multi-region, operator-attributed acquisition program.
Why Choose Food Data Scrape
Building a UK-wide chain + independent restaurant database with operator attribution is a specialized undertaking. It requires multi-source aggregation across public listings, delivery platforms, mapping services, and corporate directories; rigorous deduplication; operator-attribution logic that correctly distinguishes chains, regional groups, multi-site independents, and single-site operators; menu capture in GBP; harmonized cuisine taxonomy; and sustained refresh capacity to keep pace with UK industry churn. Most internal teams and most generalist data providers lack the operator-attribution capability that makes such a database actually useful for M&A.
We bring managed infrastructure, ethical and compliant data collection practices, and deep domain expertise in restaurant and food-service data. Advantages include compliance-first architecture, scalable extraction across millions of public pages daily, operator-attribution logic, harmonized cuisine taxonomies, fully customizable refresh cadence, dedicated analyst support familiar with UK restaurant market dynamics, and out-of-the-box dashboards highlighting chain-versus-independent patterns, operator groupings, and pricing tiers. The team has supported hospitality investors, national restaurant chains, franchise groups, FMCG suppliers, real estate developers, and research consultancies — bringing the practical experience of how comprehensive restaurant data drives real commercial outcomes.
Conclusion
The UK Restaurant Database Case Study demonstrates how chain-plus-independent operator-attributed data transforms an M&A roll-up program. By capturing every meaningful outlet across the UK and attributing it to a parent operator, the database revealed where the real acquisition opportunity sat — in the multi-region, mid-tier, fragmented-category long tail that broker networks routinely undercount. The investor moved from a London-centric, broker-dependent thesis to a multi-region, category-sequenced, operator-attributed program in a single engagement cycle.
For any hospitality investor, restaurant group, franchise developer, or research firm evaluating UK restaurant markets, the lesson is consistent: structured, operator-attributed restaurant data turns acquisition planning from a broker-led gamble into a disciplined commercial program.
If you are ready to base your next UK acquisition decision on operator-attributed ground-truth data, get in touch with our team today.

