Introduction: Two Vietnamese Cities, Two Food Delivery Universes
Vietnam's food and beverage landscape is shaped by two dominant urban centers — Ho Chi Minh City (HCMC) in the south and Hanoi in the north — each with distinct cuisines, consumer behaviors, and pricing dynamics. GrabFood Vietnam has become the leading digital window into how these two cities eat, listing tens of thousands of merchants across every district from District 1 in HCMC to Hoan Kiem in Hanoi.
For restaurant brands, franchise operators, FMCG suppliers, investors, and research firms, understanding how delivery zones differ between HCMC and Hanoi is foundational. The two cities are often discussed as a single Vietnam market, but the data tells a different story — different cuisine preferences, different pricing baselines, different promotional intensity, and different growth patterns. Acting on aggregate Vietnam data without distinguishing between HCMC and Hanoi leads to misaligned investment.
That gap is exactly where Food Data Scrape delivers. Our infrastructure captures GrabFood Vietnam data across both cities every day, harmonizing district-level demand patterns, merchant counts, and pricing into a single comparable dataset. This blog explores how HCMC and Hanoi differ on GrabFood, what the data reveals, and how stakeholders can put the intelligence to work.
Two Cities, Two Food Cultures
To understand why HCMC and Hanoi require separate analysis, you need to understand their cultural and culinary differences.
HCMC (formerly Saigon) is the south's economic engine, famous for southern Vietnamese cuisine — sweeter, lighter, herb-forward — alongside an enormous footprint of international cuisines reflecting the city's cosmopolitan history. Districts like District 1, District 2 (Thao Dien), District 7 (Phu My Hung), and Binh Thanh host concentrated F&B activity, while District 3 and District 5 offer high-density local cuisine clusters.
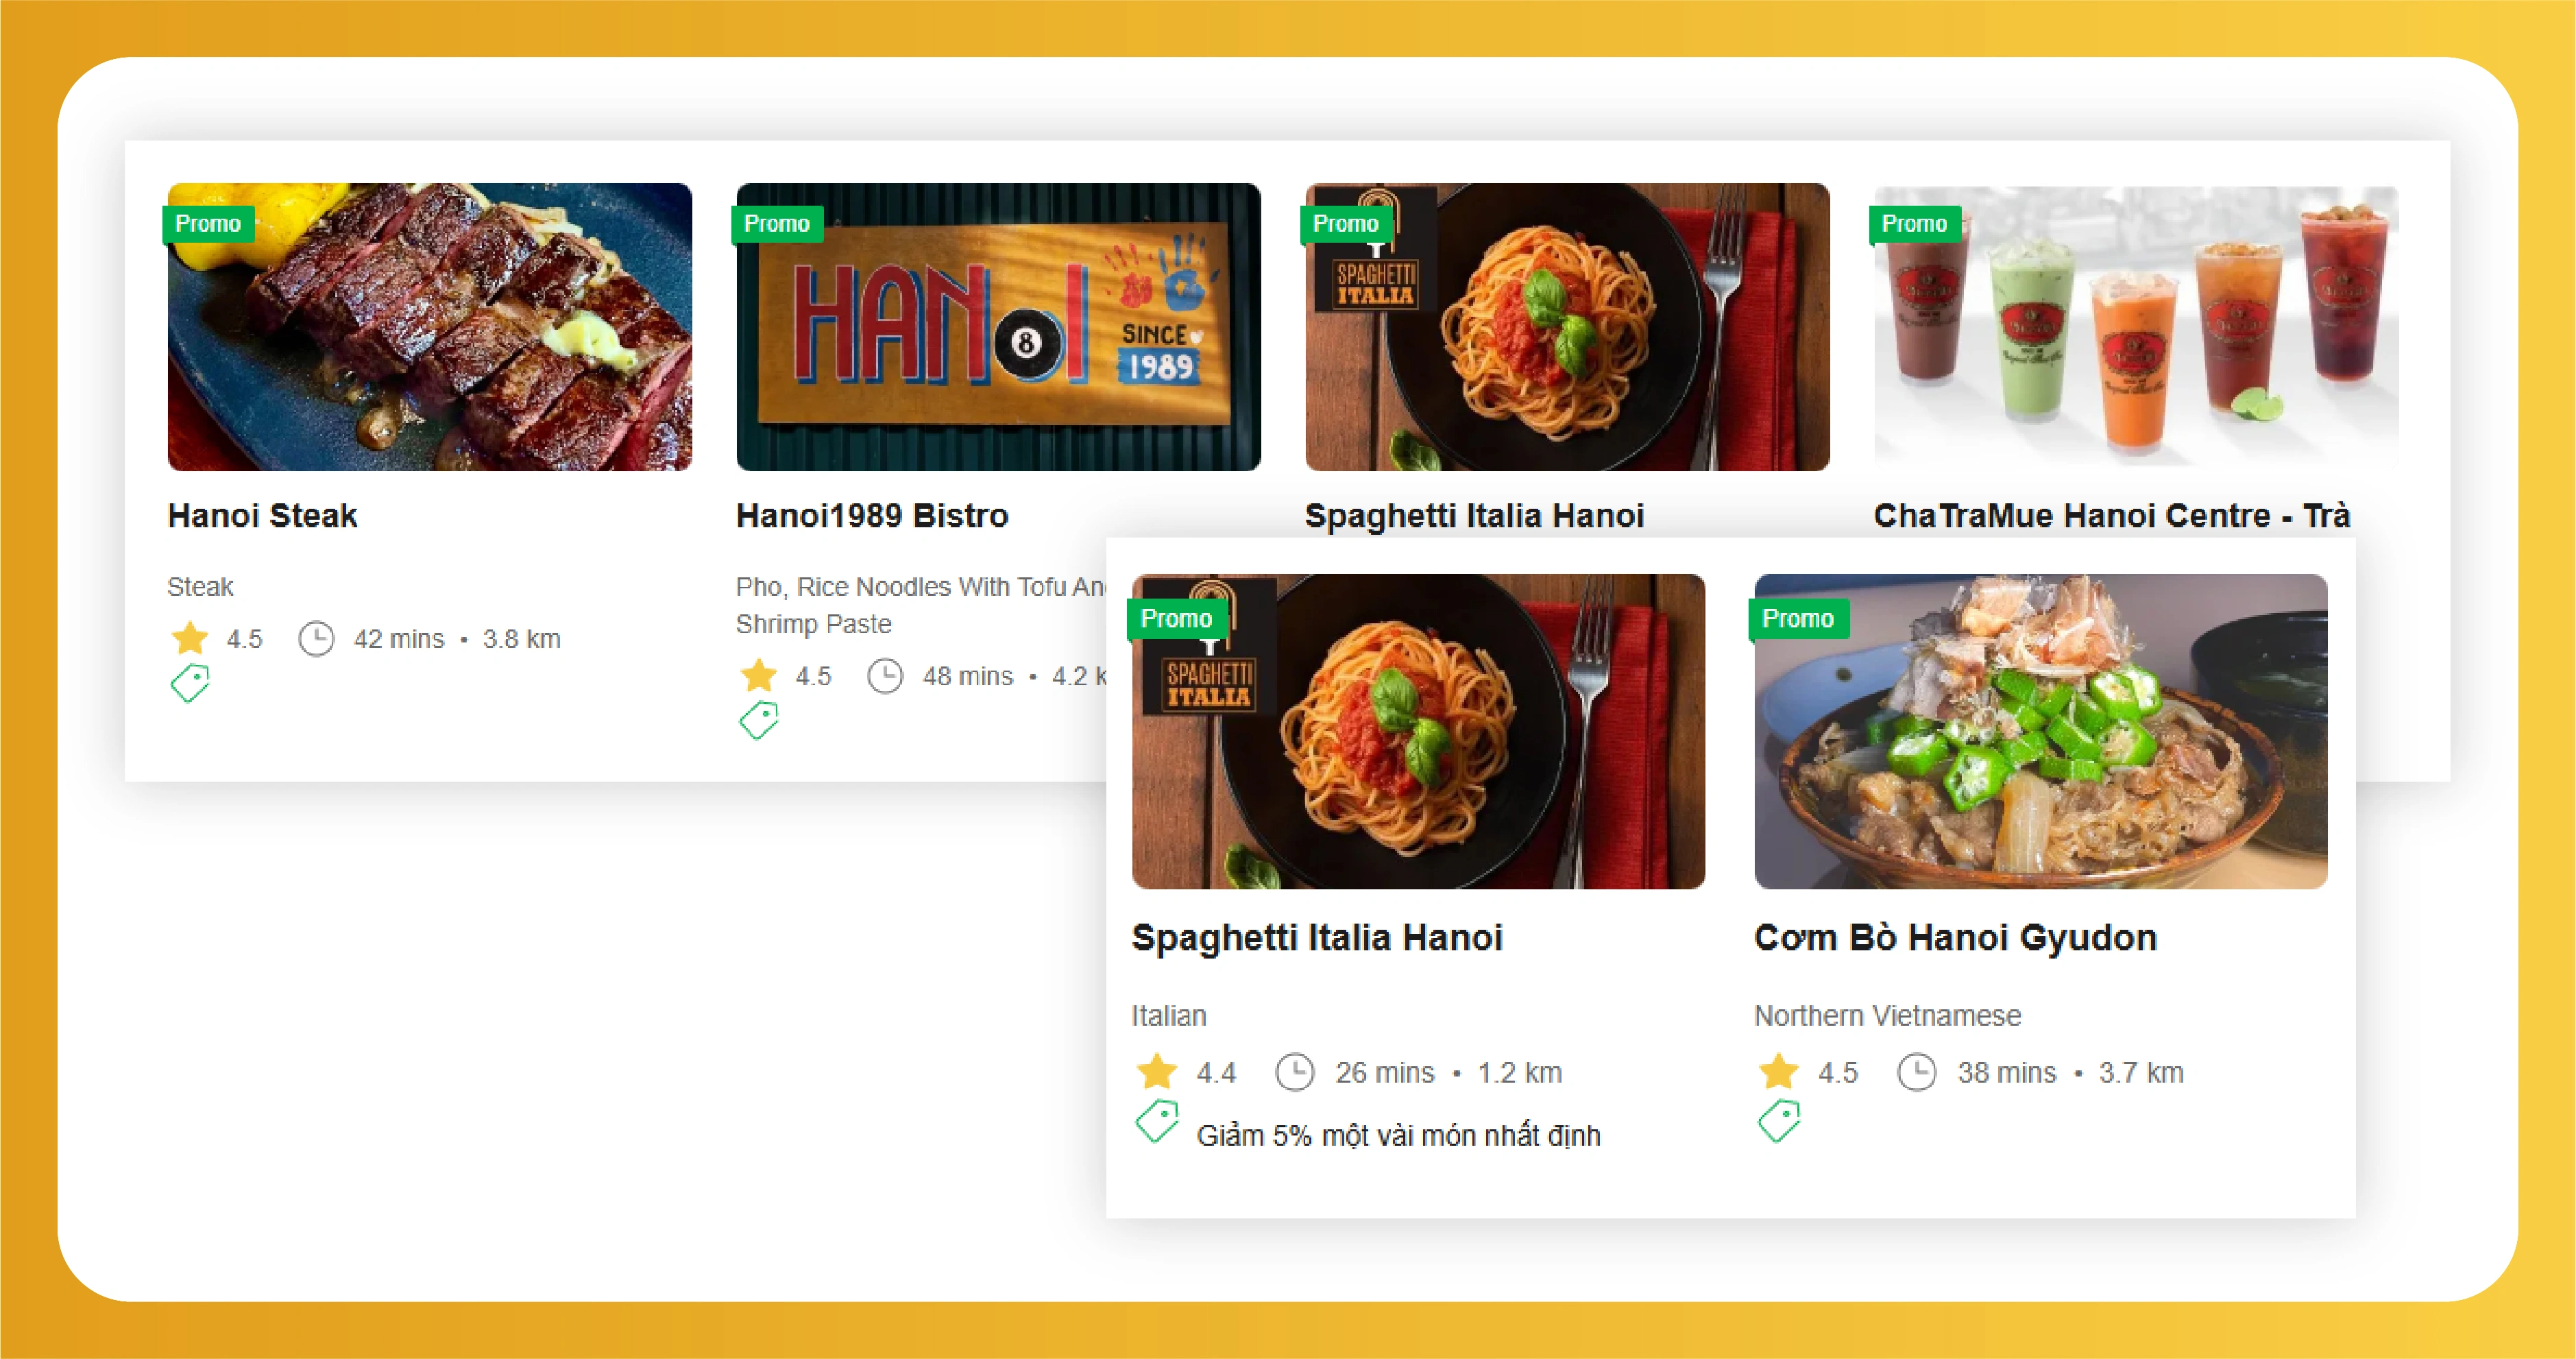
Hanoi in the north is the country's political and cultural capital, with cuisine that skews more savoury, broth-forward, and traditional. Pho originated here. Hoan Kiem, Ba Dinh, Tay Ho, Cau Giay, and Dong Da are major F&B districts, each with distinct character — Tay Ho hosts a large expat community; Hoan Kiem combines traditional Vietnamese with significant tourist flow; Cau Giay is a fast-growing residential and commercial hub.
Pricing in HCMC tends to run slightly above Hanoi for equivalent dishes, reflecting HCMC's larger expatriate community, higher rents in District 1 and District 7, and more aggressive Western-style positioning by international chains. Hanoi's price floor for traditional dishes is notably lower, while premium concepts price competitively with HCMC's premium tier.
Why HCMC vs Hanoi Zone Analysis Matters
A robust analysis of Vietnam delivery zones comparing HCMC and Hanoi at the district level unlocks insights that aggregate Vietnam data cannot deliver.
Demand patterns differ structurally: Pho merchants in Hanoi often outnumber HCMC pho merchants by 2x to 3x in equivalent residential districts, while HCMC leads on cuisines like Italian, Korean, and Western. Understanding these structural differences is essential for franchise planning.
Pricing baselines differ: A bowl of pho can list at 45,000 VND in Hanoi's Dong Da district and 70,000 VND in HCMC's District 1. International chain pricing also diverges. Brands operating in both cities must price intentionally.
Promotional intensity varies: HCMC's larger expat market and more competitive cloud kitchen scene drive higher promotional activity on certain categories; Hanoi's traditional cuisine sector sees lower promotional intensity, reflecting differing consumer expectations.
Cuisine concentration is district-specific: Within each city, cuisines cluster sharply. Identifying which districts in each city anchor each cuisine informs both new entry and franchise expansion decisions.
Tourist-flow effects matter in specific zones: Hanoi's Hoan Kiem and HCMC's District 1 both see meaningful tourist-driven demand that affects merchant pricing and assortment in observable ways.
Cloud kitchen footprint differs: HCMC has a deeper cloud kitchen sector than Hanoi, with virtual brands operating across multiple districts. This affects competitive intensity in delivery-native categories.
How the Data Is Captured
Our infrastructure is purpose-built to Extract Vietnam Restaurant Data from GrabFood at scale. The methodology rests on six pillars designed to deliver clean, district-aware, continuously refreshed intelligence.
District-level anchoring: In HCMC we anchor across District 1, District 2 (Thao Dien), District 3, District 5, District 7 (Phu My Hung), District 10, Binh Thanh, and Phu Nhuan. In Hanoi we anchor across Hoan Kiem, Ba Dinh, Tay Ho, Cau Giay, Dong Da, Hai Ba Trung, and Thanh Xuan.
Cuisine taxonomy: Each merchant and dish is mapped into a harmonized cuisine taxonomy covering Vietnamese (regional sub-categories — Northern, Central, Southern), Chinese, Japanese, Korean, Western, Italian, Indian, halal-friendly, plant-based, dessert/beverage, and emerging categories.
Currency and tax handling: Records are stored in VND with explicit tax flags.
Language handlingListings appear in Vietnamese and English. Our parsing layer handles both and normalizes brand and dish names so the same merchant is recognizable across language presentations.
Refresh cadence: Top-velocity merchants refresh daily; long-tail merchants refresh weekly. Promotional changes and new launches trigger near-real-time recapture.
Quality assurance: Every record passes schema validation, merchant disambiguation, cuisine reclassification, and outlier detection.
GrabFood Vietnam API scraping supports filtering by city, district, cuisine, brand, price band, and date range, enabling sophisticated zone-level analysis.
Sample HCMC vs Hanoi Data
Below are representative samples drawn from a typical Vietnam restaurant intelligence dataset. All prices in VND.
Sample 1: City-Level Pricing for Equivalent Dishes
| Dish | HCMC Avg | Hanoi Avg | Delta |
|---|---|---|---|
| Pho Bo (Beef Pho) | 70,000 | 55,000 | +27% HCMC |
| Banh Mi (Standard) | 35,000 | 28,000 | +25% HCMC |
| Com Tam Suon | 65,000 | 50,000 | +30% HCMC |
| Bun Cha | 60,000 | 50,000 | +20% HCMC |
| Pasta (Western chain) | 165,000 | 155,000 | +6% HCMC |
| Korean BBQ Set | 320,000 | 290,000 | +10% HCMC |
Sample 2: District-Level Merchant Density
| City | District | Vietnamese | Western | Japanese | Korean |
|---|---|---|---|---|---|
| HCMC | District 1 | 1,840 | 620 | 480 | 380 |
| HCMC | Thao Dien (D2) | 720 | 520 | 280 | 240 |
| HCMC | Phu My Hung (D7) | 980 | 410 | 320 | 290 |
| HCMC | Binh Thanh | 1,520 | 220 | 180 | 140 |
| Hanoi | Hoan Kiem | 2,210 | 380 | 290 | 220 |
| Hanoi | Tay Ho | 680 | 410 | 240 | 190 |
| Hanoi | Cau Giay | 1,580 | 180 | 160 | 130 |
| Hanoi | Dong Da | 1,890 | 140 | 120 | 95 |
Sample 3: Promotional Activity by City and Cuisine
| Cuisine | HCMC Promo Activity | Hanoi Promo Activity |
|---|---|---|
| Vietnamese Traditional | 18% | 12% |
| Western Casual | 38% | 28% |
| Japanese | 32% | 26% |
| Korean | 41% | 34% |
| Cafe / Bubble Tea | 58% | 49% |
| Pizza | 52% | 42% |
| Cloud Kitchen Virtual Brands | 48% | 31% |
Sample 4: Top 5 Cuisines by Active Merchant Count
| Rank | HCMC | Active Merchants | Hanoi | Active Merchants |
|---|---|---|---|---|
| 1 | Vietnamese Traditional | 6,820 | Vietnamese Traditional | 7,490 |
| 2 | Cafe / Beverage | 2,810 | Cafe / Beverage | 2,490 |
| 3 | Western | 1,640 | Cloud Kitchen Virtual | 1,180 |
| 4 | Japanese | 1,480 | Western | 1,120 |
| 5 | Korean | 1,290 | Japanese | 1,080 |
These tables represent a small slice of the millions of records captured monthly across GrabFood Vietnam
What the Data Reveals
Several consistent patterns emerge from systematic HCMC vs Hanoi GrabFood analysis.
HCMC consistently prices above Hanoi on traditional dishes: The pricing gap on pho, banh mi, and com tam runs 20 to 30 percent on average — a structural pattern reflecting different operating costs, expat consumer mix, and brand positioning. International chains show smaller gaps (5 to 10 percent), reflecting more centralized pricing.
Hanoi leads on Vietnamese traditional density: Despite a smaller overall market, Hanoi shows higher Vietnamese traditional merchant counts than HCMC in equivalent districts, reflecting deeper cultural integration of traditional cuisine into daily life.
HCMC dominates international cuisine concentration: Western, Japanese, Korean, and Italian merchant counts in HCMC's expat-heavy districts (D1, Thao Dien, Phu My Hung) significantly exceed equivalent Hanoi districts.
Cloud kitchen footprint is meaningfully larger in HCMC: Virtual brand merchant counts in HCMC outpace Hanoi by 30 to 50 percent, reflecting HCMC's more developed cloud kitchen ecosystem and higher delivery-native demand.
Tay Ho behaves more like HCMC's Thao Dien than other Hanoi districts: Hanoi's expat-heavy Tay Ho district shows pricing and cuisine concentration patterns much closer to HCMC's Thao Dien than to other Hanoi districts, reflecting shared demographic dynamics.
Promotional intensity is higher in HCMC across most categories: Whether it is cloud kitchen virtual brands, pizza, Korean, or cafes, HCMC merchants run more frequent and slightly deeper promotions than Hanoi equivalents.
Use Cases for Vietnam Delivery Zone Data
The applications of structured Vietnam restaurant market analysis span the food and beverage value chain.
Vietnamese restaurant brands use the data to benchmark district-specific pricing, identify under-served zones, and time menu launches. International chains entering Vietnam use the data to plan city-by-city and district-by-district rollout sequences. Franchise consultants deliver Vietnam clients defensible expansion recommendations backed by hard data. Cloud kitchen operators identify which districts have headroom for new virtual brands. FMCG and ingredient suppliers track dish-level adoption patterns across the two cities. Investors validate Vietnamese F&B growth assumptions during due diligence. Tourism boards and government agencies monitor restaurant sector evolution.
Schema and Coverage
A typical record includes merchant name, brand affiliation, address and geocoordinates, city and district, opening hours, average consumer rating and review count, cuisine taxonomy, regional Vietnamese sub-category (Northern, Central, Southern) where applicable, dish names in Vietnamese and English where useful, dish-level pricing in VND, tax flag, promotional flags, cloud kitchen flag, image URLs, and capture timestamp. Coverage spans all priority districts in HCMC and Hanoi, with anchor sets configurable for Danang, Hai Phong, Can Tho, and other secondary cities at client request.
Why Choose Food Data Scrape
Capturing reliable Vietnam GrabFood intelligence is harder than it appears. Bilingual listings require careful Vietnamese-English parsing, district-based personalization affects what consumers see, regional cuisine taxonomy (Northern vs Central vs Southern) requires linguistic and culinary context, and pricing shifts frequently during peak meal windows. Most internal teams underestimate the engineering and Vietnamese market context required to deliver trustworthy data.
We bring managed infrastructure, ethical and compliant data collection practices, and deep domain expertise in Vietnamese and Southeast Asian F&B. Advantages include compliance-first architecture, scalable extraction across millions of public pages daily, Vietnamese-English bilingual parsing, fully customizable harmonized schemas including regional cuisine sub-taxonomies, near-real-time refresh on priority merchants, cloud kitchen identification logic, dedicated analyst support familiar with HCMC and Hanoi dynamics, and out-of-the-box dashboards highlighting city-by-city and district-by-district patterns.
Conclusion: One Country, Two Markets, One Data Strategy
HCMC and Hanoi are not one Vietnam — they are two distinct food delivery markets that demand distinct commercial strategies. HCMC leads on international cuisine density, cloud kitchen footprint, premium pricing, and promotional intensity. Hanoi anchors traditional Vietnamese culinary depth with lower price floors and more measured promotional dynamics. Both cities offer enormous F&B opportunity — but the brands that succeed are those that recognize the differences and act on data rather than assumption.
Our team transforms GrabFood Vietnam's public catalog into structured intelligence ready to power strategy across both cities. Whether you need a one-time HCMC vs Hanoi benchmarking study, a recurring competitive dashboard, or an always-on data feed integrated into your business intelligence stack, we configure a delivery model that fits your workflow. If you are ready to act on real Vietnam restaurant data instead of intuition, get in touch with our team today.

