
Specialized
Cloud & Dark Kitchen TrackingHOT
Cloud & Dark Kitchen Tracking identifies virtual brands, ghost kitchens, and menu overlaps across delivery platforms by address.
// virtual brands resolved to physical kitchens
Overview
What is cloud & dark kitchen tracking?
Cloud and dark kitchen tracking is the detection and mapping of delivery-only food brands — virtual brands and ghost kitchens — that operate without a traditional storefront. It resolves these brands back to the physical kitchens they share, revealing how many brands run from a single address.
The number of brands on a delivery app no longer reflects the number of real kitchens behind them. A single dark kitchen can launch a dozen virtual brands, each with its own listing and near-identical menu. For competitive analysts, investors and marketplace integrity teams, that illusion distorts market share, diligence and listing quality. Kitchen tracking clusters delivery-only listings by shared address, counts brands per kitchen, and scores menu overlap across sibling brands. Built across delivery platforms in 15 markets, it cuts through the storefront illusion to show the real operating footprint behind the brands.
Capabilities
See behind the storefront
Virtual brands multiply fast. We map them back to real kitchens.
Virtual brand detection
Identify delivery-only brands operating without a storefront.
Shared-kitchen mapping
Group multiple brands operating from the same address.
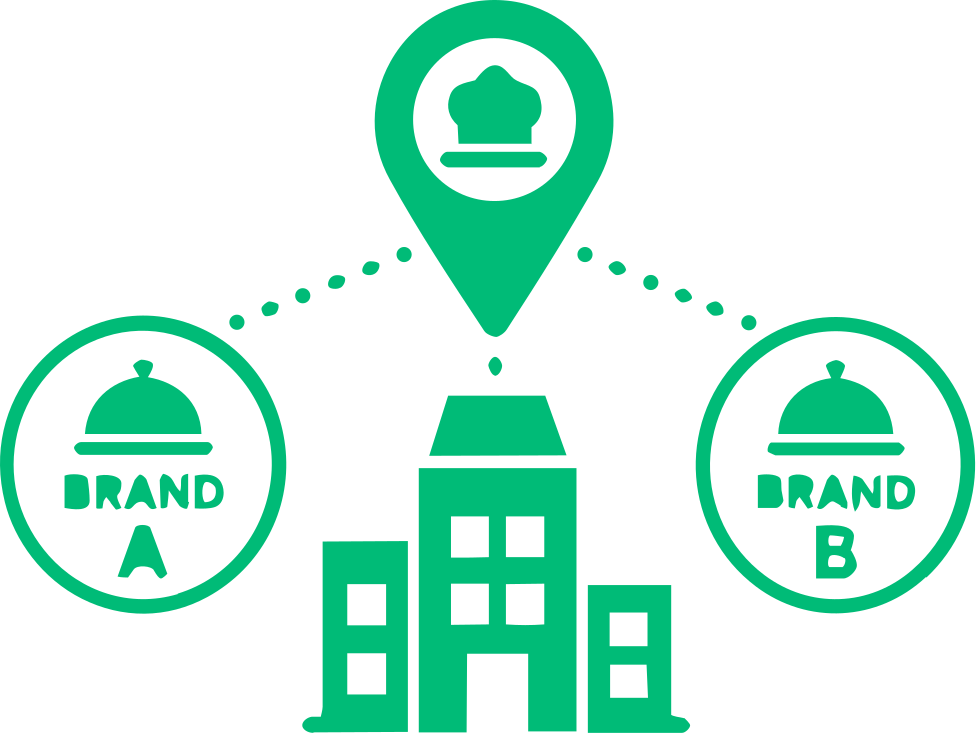
Brand-per-address
Count how many virtual brands share each kitchen.
Menu overlap
Detect near-identical menus across sibling brands.
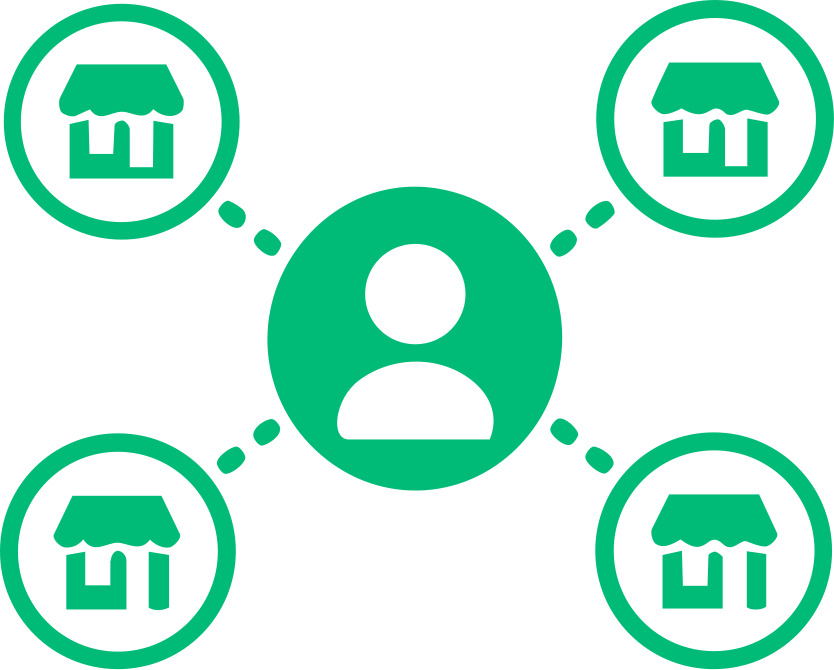
Operator linking
Connect brands run by the same operator across locations.
Expansion tracking
Watch new virtual brands launch over time.
What's included
Every kitchen tracker ships with
Standard fields and outputs. Anything here can be extended, trimmed or customized to your scope.
Methodology
How does cloud & dark kitchen tracking work?
From scattered listings to a real kitchen map, in four steps.
1 · Collect listings
Delivery-only listings are gathered across platforms.
2 · Cluster by address
Listings are grouped to shared physical kitchens.
3 · Score overlap
Brand counts and menu-overlap scores are computed.
4 · Deliver
The kitchen map arrives as CSV, JSON or API.
Who it's for
Get answers like
Real questions our kitchen tracker answers for teams across the food economy.
"How many brands share a kitchen?"
Brand-per-address clustering.
"Is this brand a real footprint?"
Virtual vs physical resolution.
"Are menus duplicated?"
Menu-overlap scoring across brands.
Why FoodDataScrape
Why teams choose us for this
- Resolves virtual brands to shared physical kitchens
- Brand-per-address counts and menu-overlap scores
- Tracks new virtual-brand launches over time
- Free proof-of-concept on a market you choose
Delivery & integration
How is the data delivered?
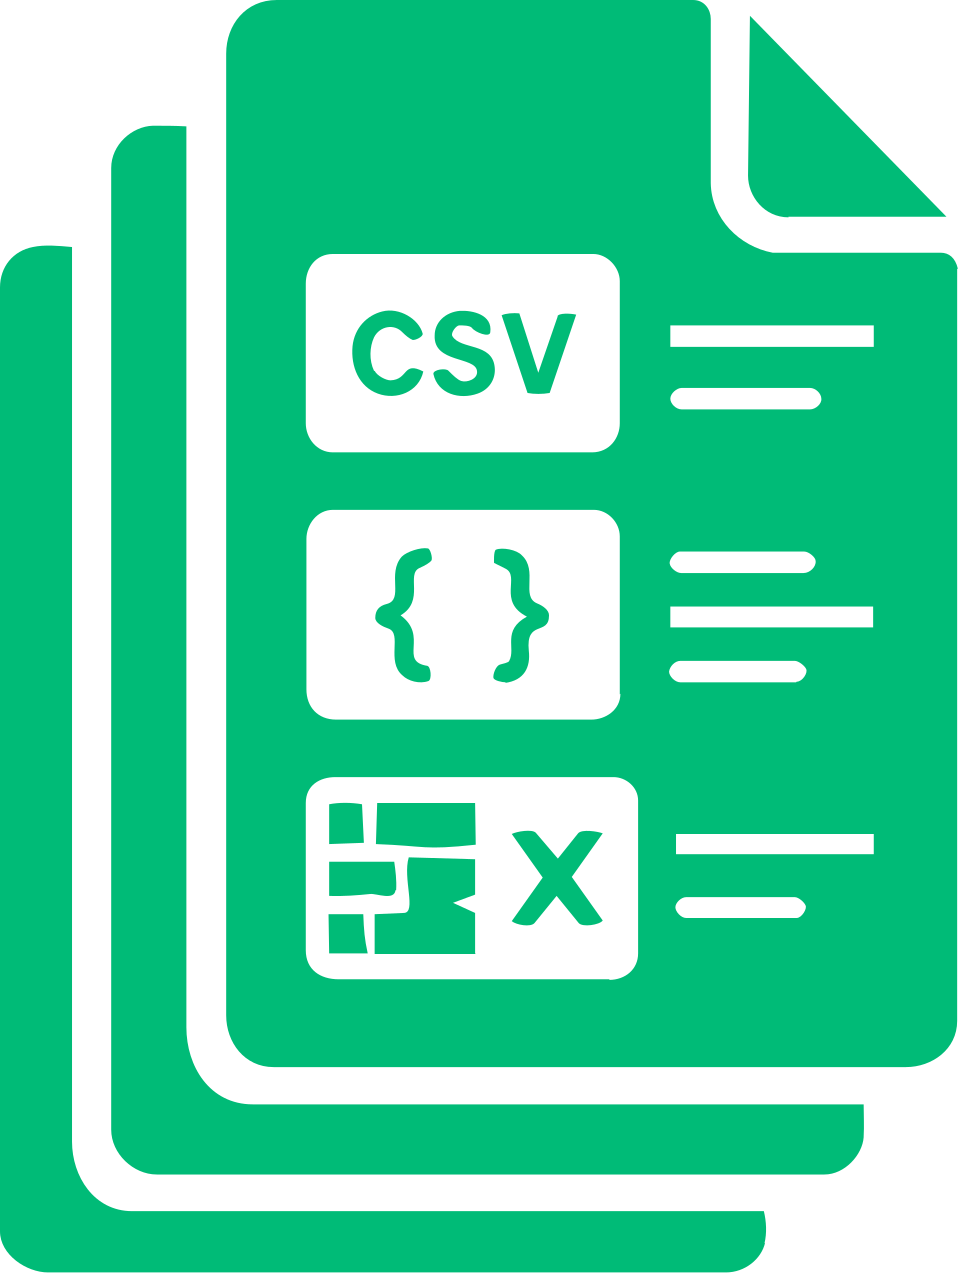
Formats
CSV, JSON or direct API — pick what plugs into your stack. Custom schemas on request.

Refresh cadence
One-time pull, daily, weekly or real-time feeds, scoped to how fast your decisions move.
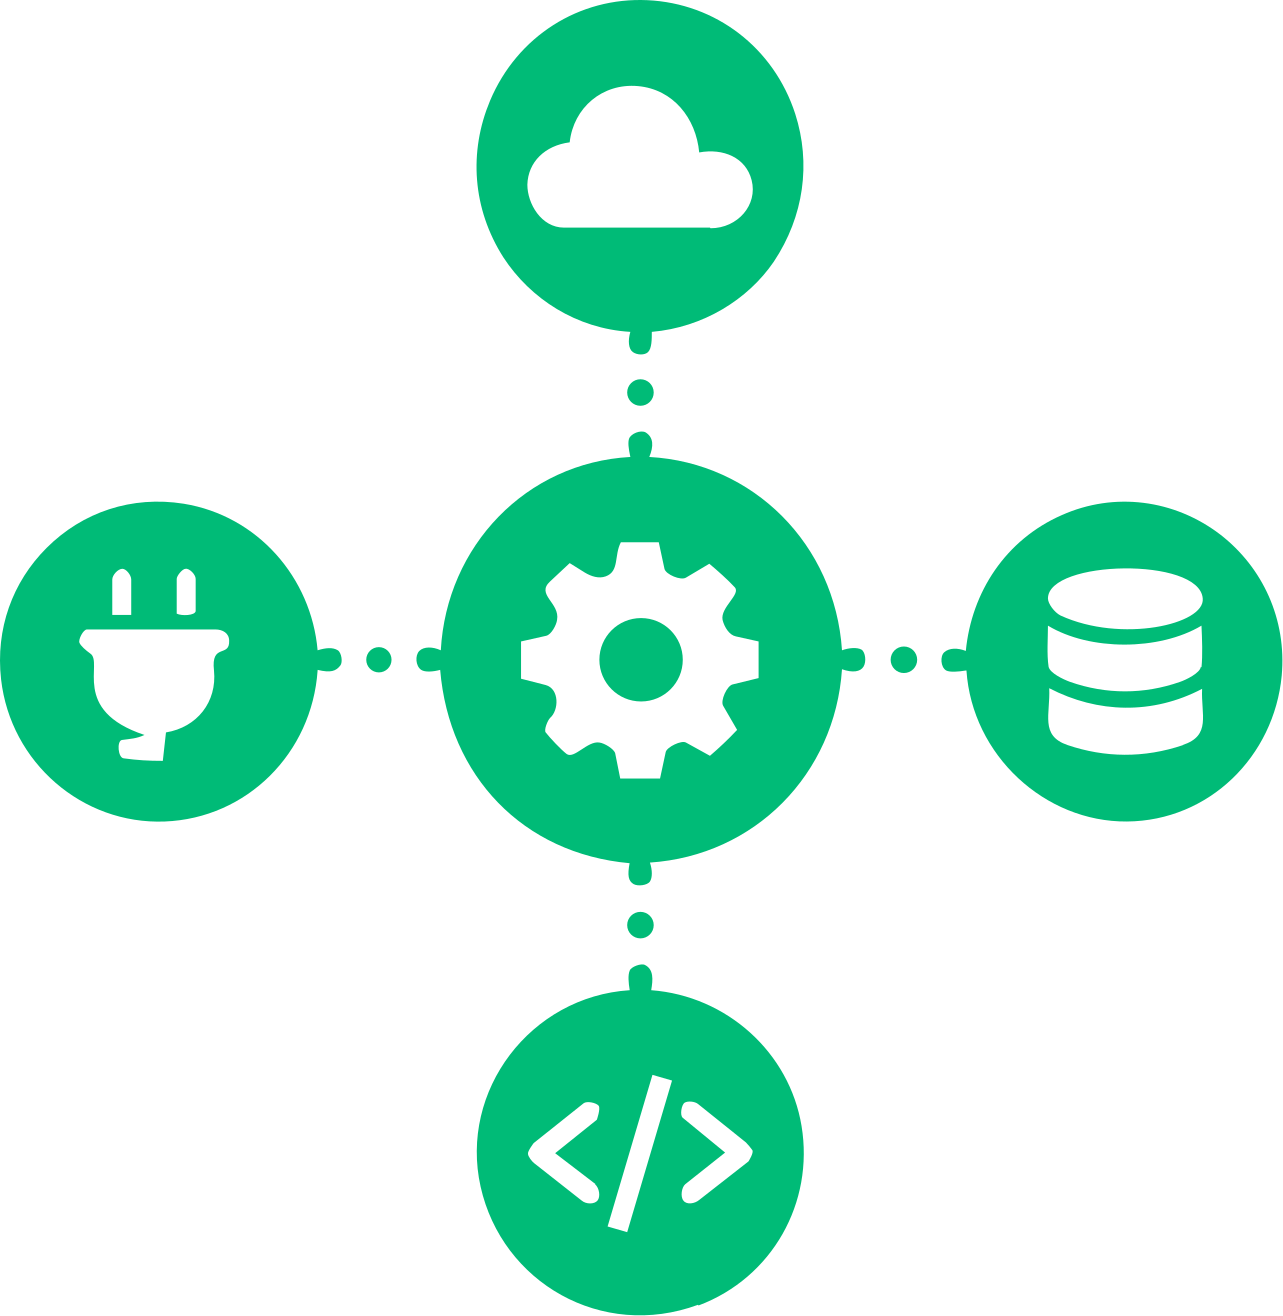
Integration
Drop into BI tools, data warehouses or apps. Webhooks and scheduled exports supported.
Questions
Frequently asked questions
By resolving delivery-only listings to shared physical addresses and clustering them.
Yes — brand-per-address counts and menu-overlap scores are provided.
Major delivery marketplaces across our 15 markets, with custom additions on request.
Yes — first-seen dates let you watch new virtual brands appear.
Where signals allow, brands run by the same operator can be connected.
As CSV, JSON or API on your cadence.
Map the ghost-kitchen economy
Tell us the market. We'll return a free sample brand-per-kitchen map.



