
Introduction
Here is an uncomfortable arithmetic problem for anyone who monitors competitor pricing.
Suppose a platform adjusts prices on a given SKU an average of four times a day — a morning price, a lunch-hour adjustment, an evening peak price, a late-night discount. Suppose your team performs a diligent daily spot-check at 10 a.m. across a sample of your top fifty SKUs.
You are observing one price out of four, on fifty SKUs out of a range that might run to two thousand. Your effective coverage of your own price landscape is a fraction of one percent, and the single observation you do capture is systematically biased toward whatever the platform charges mid-morning on a weekday.
You are not monitoring prices. You are taking a photograph of one corner of a room and concluding you understand the building.
This is not a hypothetical failure. It is how the majority of food and grocery brands still operate, and it made a certain amount of sense in an era when retail prices moved seasonally. That era ended. Quick commerce platforms now adjust prices sub-hourly. Delivery platforms run promotions that start and end within a single day. Grocery e-commerce reprices in response to competitor moves within hours.
Real-Time Food Price Monitoring is the response. At FoodDataScrape, we crawl 220M+ pages of food data every week, with high-frequency price capture across delivery platforms, quick commerce apps and grocery e-commerce. This article explains why prices now move as fast as they do, what a real-time feed actually captures, and what it costs businesses to keep guessing.
Why Food Prices Move So Much Faster Than They Used To
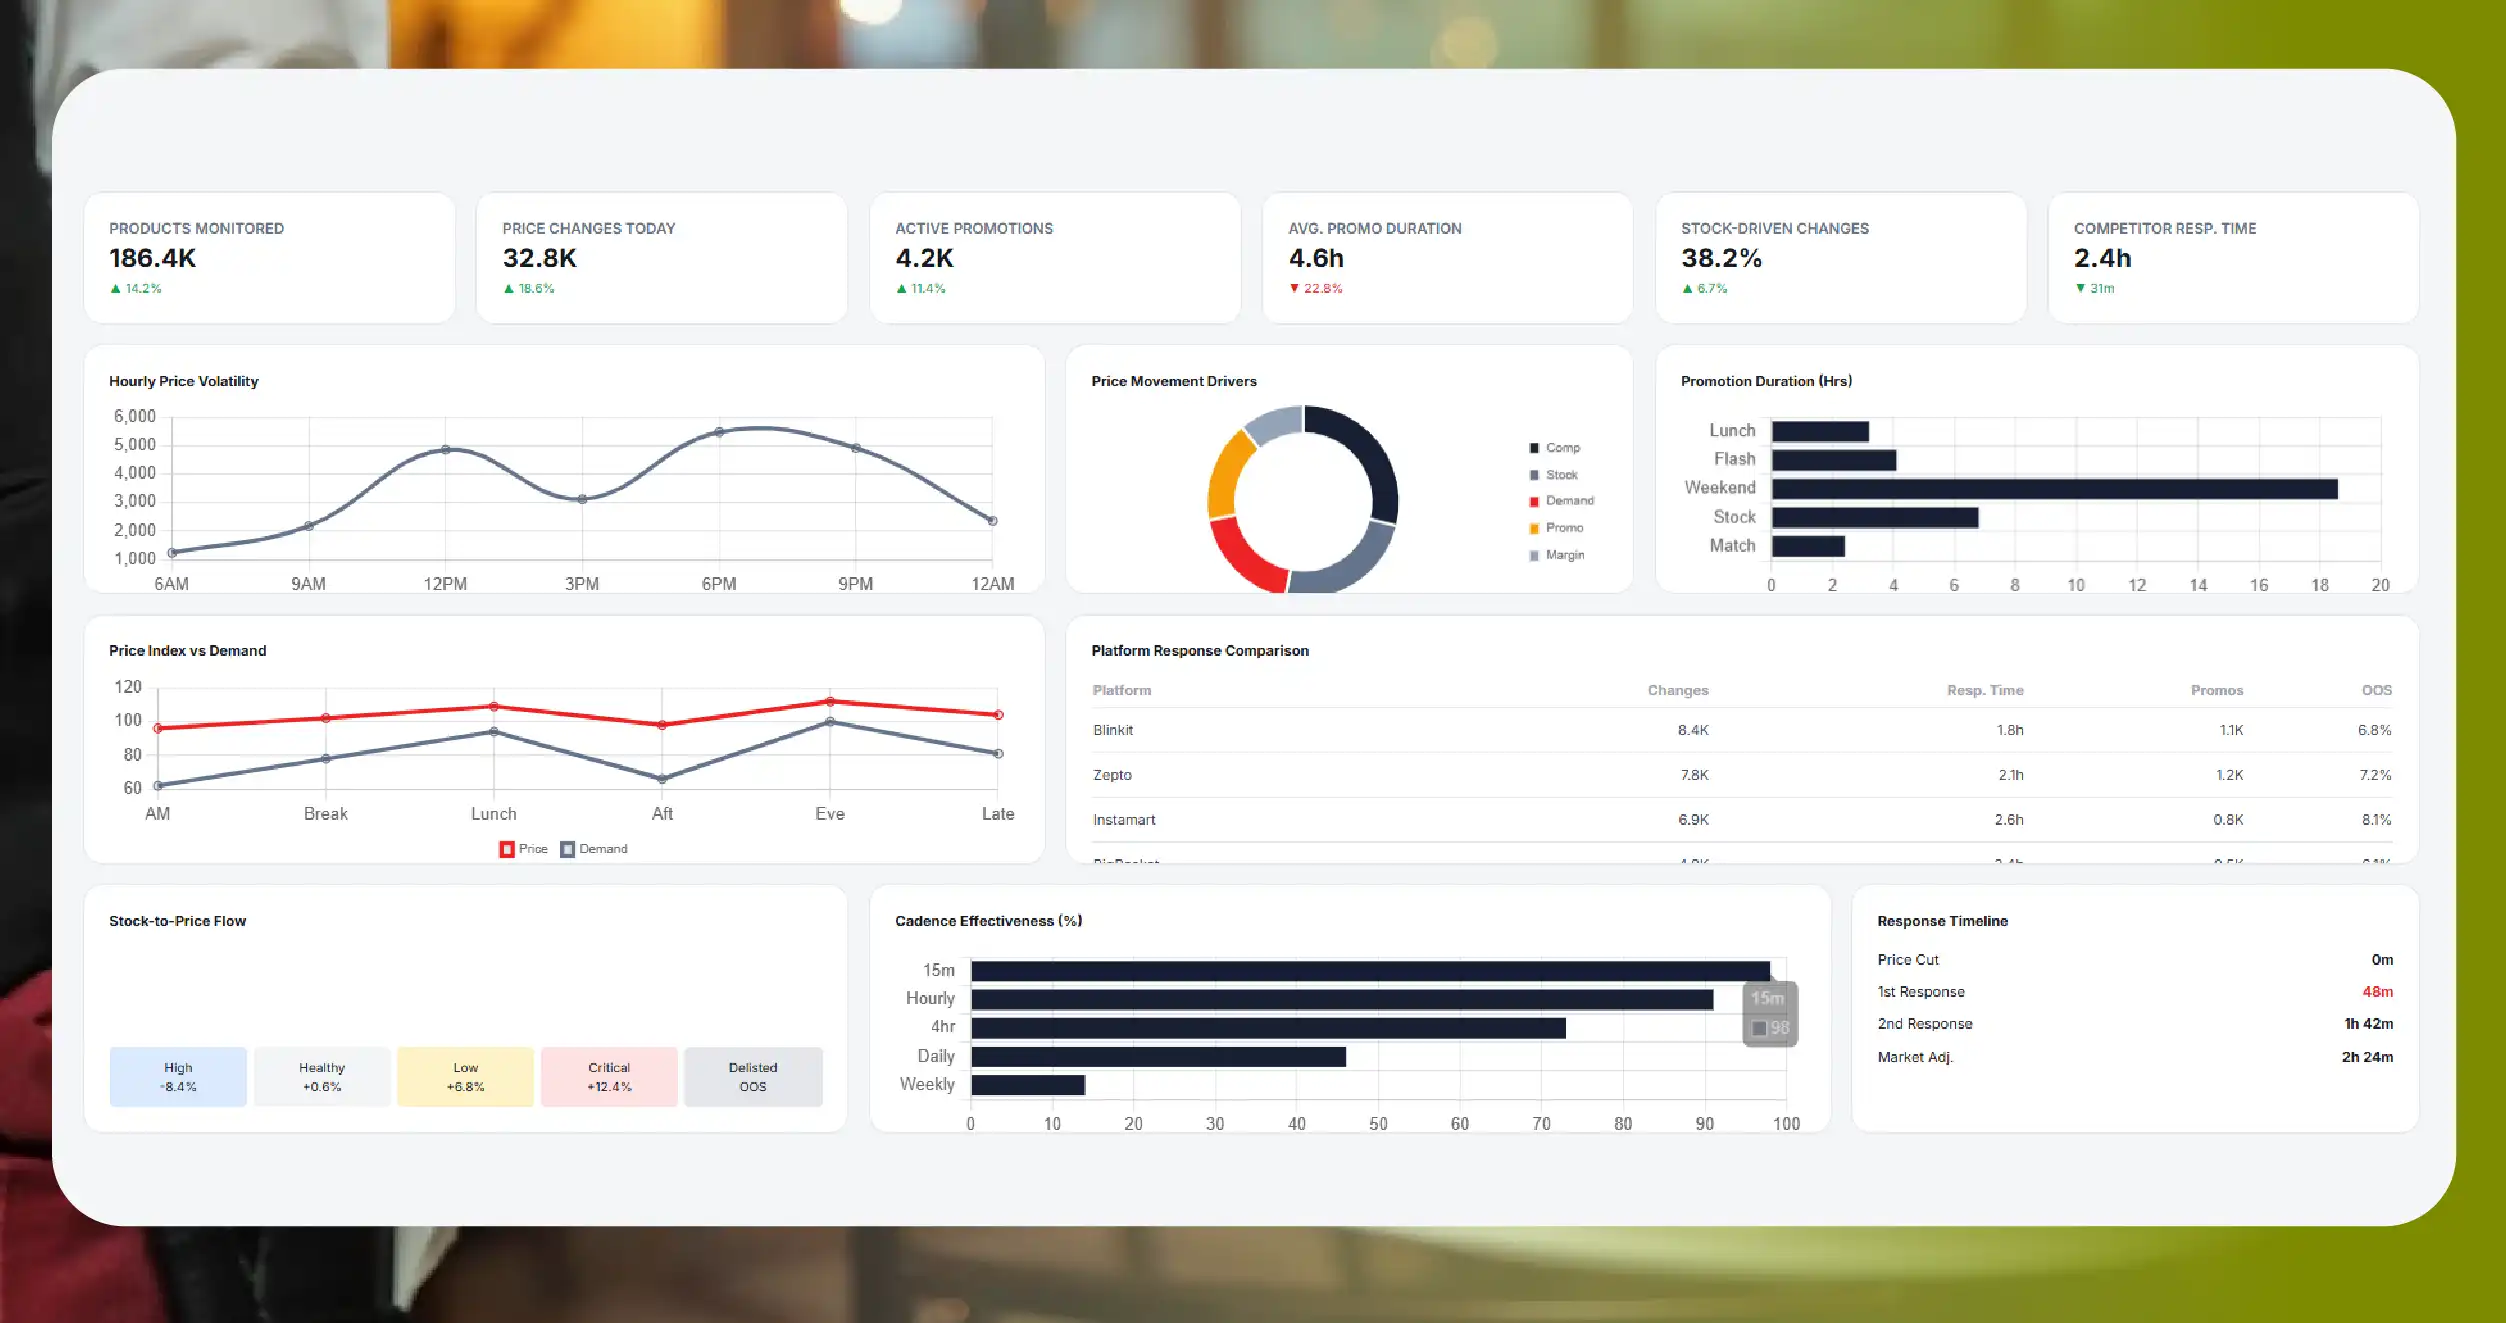
Algorithmic repricing is now standard.Platforms and large sellers use automated repricing engines that respond to competitor prices, stock levels, demand signals and margin targets. These engines run continuously. A human pricing team cannot outpace them, and cannot even observe them without automation.
Promotions have collapsed in duration.A promotional cycle used to be a fortnight. On quick commerce, it can be four hours — a lunchtime offer, an evening flash discount, a weekend mechanic. A weekly price check will miss most of them entirely.
Demand is time-of-day dependent.Food demand peaks predictably and sharply. Platforms price into those peaks. The price of a lunchtime staple at 12:30 p.m. is not the price at 3 p.m., and the difference is deliberate.
Stock levels drive price.In a dark store with limited inventory, low stock can trigger a price rise or a delisting; excess stock triggers a discount. Price and availability are a single coupled system, and monitoring one without the other produces nonsense.
Competitive response cycles have compressed.When one platform cuts, the others respond within hours, not weeks. If your monitoring cadence is weekly, you are always analysing a market state that has already been superseded.
What a Daily Spot-Check Actually Misses
Consider a single SKU over one day on a quick commerce platform:
| Time | Price | Event |
|---|---|---|
| 08:00 | ₹365 | Base price |
| 10:00 | ₹365 | ← Your spot-check |
| 11:30 | ₹329 | Lunch promotion begins |
| 14:00 | ₹365 | Promotion ends |
| 18:30 | ₹349 | Evening peak discount |
| 21:00 | ₹379 | Late-night price rise |
| 23:30 | ₹339 | Clearance discount |
Your spot-check recorded ₹365. The SKU actually traded at five distinct prices, ranging from ₹329 to ₹379 — a 15% spread. Your competitor ran a lunchtime promotion you never saw. The evening discount that took volume from you is invisible in your records. The 21:00 price rise, which would have been your opportunity to win the peak, went unnoticed.
You reported to your leadership that the competitor's price was stable at ₹365. That statement is factually true and completely useless.
Sample Data: A High-Frequency Price Capture
The structure below reflects a FoodDataScrape real-time price feed. Values are illustrative.
                            {
  "sku_name": "Example Brand Cold Coffee 200ml",
  "brand": "Example Brand",
  "category": "Ready-to-Drink Beverages",
  "platform": "Quick Commerce Platform A",
  "city": "Bengaluru",
  "pin_code": "560095",
  "capture_window": "2026-07-13",
  "price_events": [
    { "time": "08:00", "price_inr": 89, "promo": null, "in_stock": true },
    { "time": "11:30", "price_inr": 79, "promo": "Lunch Offer", "in_stock": true },
    { "time": "14:00", "price_inr": 89, "promo": null, "in_stock": true },
    { "time": "17:45", "price_inr": 89, "promo": null, "in_stock": false },
    { "time": "19:20", "price_inr": 85, "promo": "Evening Deal", "in_stock": true },
    { "time": "22:10", "price_inr": 95, "promo": null, "in_stock": true }
  ],
  "price_changes_detected": 5,
  "daily_min_inr": 79,
  "daily_max_inr": 95,
  "daily_spread_pct": 20.3,
  "stock_out_duration_min": 95,
  "weighted_avg_price_inr": 87.4
}
Three fields here do work that no manual process can replicate.
price_changes_detected: 5— a daily spot-check would have reported one price and zero changes.
stock_out_duration_min: 95— the SKU was unavailable for 95 minutes, straddling the evening ordering peak. That is directly quantified lost revenue, and it appears in no report the platform will send you.
weighted_avg_price_inr: 87.4— not the arithmetic mean of the price points, but the average weighted by the duration each price was live. This is the number that actually describes what the market saw, and it is the only defensible basis for competitive price comparison.
Sample Data: Competitive Price Movement Log
| Timestamp | Your SKU | Competitor A | Competitor B | Private Label | Event Detected |
|---|---|---|---|---|---|
| 08:00 | ₹89 | ₹92 | ₹85 | ₹69 | Baseline |
| 11:30 | ₹79 | ₹92 | ₹85 | ₹69 | You promote |
| 12:15 | ₹79 | ₹79 | ₹85 | ₹69 | Competitor A matches within 45 min |
| 13:40 | ₹79 | ₹79 | ₹75 | ₹69 | Competitor B undercuts both |
| 14:00 | ₹89 | ₹79 | ₹75 | ₹69 | Your promo ends — you are now most expensive |
| 16:20 | ₹89 | ₹79 | ₹75 | ₹65 | Private label deepens discount |
Read the 14:00 row. Your promotion ended on schedule. Your competitors' did not. For the rest of the day you were the most expensive branded option in the category, and you did not know it.
Competitor A matched your promotion in 45 minutes. That single data point tells you something enormous: they are running an automated repricing engine that watches you. Any promotional strategy built on the assumption that you will hold a price advantage for a meaningful period is invalid, and you would never have learned that from a daily check.
Sample Data: Volatility Profile by Category
| Category | Avg Price Changes / SKU / Day | Daily Spread | Recommended Monitoring Cadence |
|---|---|---|---|
| Ready-to-Drink Beverages | 4.2 | 18–22% | Hourly |
| Fresh Produce | 3.8 | 15–30% | Hourly |
| Snacks & Confectionery | 2.1 | 8–12% | Every 4 hours |
| Dairy | 1.9 | 6–10% | Every 6 hours |
| Staples (Rice, Flour, Oil) | 1.2 | 4–8% | Daily |
| Frozen Foods | 1.6 | 7–14% | Every 6 hours |
| Personal Care | 0.8 | 3–6% | Daily |
This table is the answer to the question every pricing team asks: how often do we actually need to check?
The answer is not "as often as possible" and it is not "once a day". It is category-dependent, and it is knowable. Monitoring staples hourly wastes money. Monitoring beverages daily loses money. Volatility profiling tells you where to spend your monitoring budget.
The Cost of Latency — Putting a Number on It
Pricing teams rarely quantify what slow monitoring costs, which is why the investment case never gets made. It is quantifiable.
Unmatched competitor promotions.If a competitor runs a promotion you do not detect, you lose volume for its full duration. On a fast-moving category with four-hour promotional windows, a weekly monitoring cadence means you detect roughly nothing. Each undetected promotion is a measurable volume transfer.
Delayed promotional response.If a competitor undercuts you and you respond in five days instead of five hours, you have surrendered five days of share in that SKU. Multiply across a range and the annual figure is rarely small.
Undetected stock-outs.Every hour your product is out of stock during a demand peak is revenue that goes to whoever is on the shelf instead. Stock-out duration is the most under-measured revenue leak in modern grocery, precisely because it is invisible in retrospect — a product that is back in stock by the time you check looks like it was never gone.
Over-discounting.The opposite failure, and equally expensive. Teams that cannot see competitor prices discount defensively, matching a price cut that never happened or holding a promotion long after the competitive pressure that justified it has ended. Every unnecessary point of discount is margin given away for nothing.
Price perception drift.Consumers form a price impression over dozens of exposures. If your product is the most expensive option in its category for six hours a day, every day, that impression forms regardless of what your shelf price says on paper.
The pattern across all five is the same. None of these costs appear as a line item in any report. They appear as unexplained volume softness, unexplained margin compression, and a category manager who cannot say why.
Who Uses Real-Time Price Monitoring
CPG and food brands.Detect competitor promotions as they launch rather than after they end. Measure whether your own promotions are being matched, and how fast. Enforce price compliance across platforms and sellers.
Retailers and quick commerce platforms.Benchmark competitor pricing continuously and respond within the same competitive cycle rather than a week later.
Restaurant chains and delivery operators.Track competitor menu pricing and promotional intensity within their delivery radius, where the only competition that matters is the competition that can actually reach the same customer.
Distributors and wholesalers.Monitor downstream retail pricing to detect margin erosion and unauthorised discounting.
Investors and analysts.Measure discount intensity across platforms as a real-time proxy for competitive burn and margin pressure — a signal that appears in pricing data months before it appears in a financial statement.
Category and revenue management teams.Build volatility-informed pricing strategies grounded in observed market behaviour rather than in an annual planning assumption.
The FoodDataScrape Real-Time Pricing Data Model
Delivered via API, streaming feed, database push, cloud storage or direct BI integration, with capture frequency configurable from hourly to daily by category.
- Product identity:SKU name, brand, normalised product name, category, pack size, variant, product identifiers
- Platform and geography:platform, city, pin code or postcode, dark store or delivery catchment
- Price events:every detected price change with timestamp, previous price, new price, magnitude and direction
- Promotions:promotion type, discount depth, start and end detection, duration, promotional tags
- Availability:in-stock status at each capture, stock-out events, stock-out duration, availability score
- Derived metrics:daily minimum, maximum, spread, duration-weighted average price, price change frequency, volatility index
- Competitive context:competitor prices at matched timestamps, response latency detection, price rank at each capture
- Alerting:threshold-based triggers on competitor price moves, stock-outs, promotion launches and price rank changes
Methodology and Compliance
- We collectpublicly accessible catalogue and pricing informationonly. No authenticated content, no private data, no personal consumer data.
- Capture frequency is matched to category volatility, because uniform high-frequency crawling across a low-volatility range is wasteful for the client and unnecessary load on the platform.
- Duration-weighted averagingis used for all comparative metrics, because an arithmetic mean of price points captured at irregular intervals is statistically meaningless.
- Price and availability are capturedtogether, since a price on an out-of-stock item is not a price a consumer can pay.
- Crawlers are rate-limited and engineered not to degrade the platforms we collect from.
Measurable Outcomes
| Metric | Daily Spot-Check | With FoodDataScrape |
|---|---|---|
| Price changes captured | ~5% | 95%+ |
| Promotion detection | Only if it spans the check window | All, with start and end times |
| Competitor response latency | Unmeasurable | Measured in minutes |
| Stock-out detection | Missed unless coincidental | Duration-quantified |
| SKU coverage | Top 50, manually | Full range, automated |
| Time from competitor move to your awareness | 1–7 days | Under 1 hour |
Questions
Frequently Asked Questions
Configurable by category, from hourly to daily. We recommend cadence based on measured volatility rather than selling maximum frequency across the board.
Quick commerce, food delivery and grocery e-commerce platforms across India, the US, UK, Gulf, Europe and Southeast Asia. Coverage is scoped to your target markets.
Yes. Threshold-based alerting on competitor price moves, promotion launches and stock-outs is one of the most-used features, because most teams need a trigger, not a table.
Yes. A defined SKU basket plus a competitive set keeps the feed focused and cost-efficient.
Always. Price without availability is misleading, and we do not separate them.
Yes — API, streaming, database push or flat file, matched to your ingestion schema.
Conclusion
The market you are competing in reprices four times before lunch. The market you aremeasuringreprices once a day, at 10 a.m., on fifty SKUs, in a spreadsheet.
The gap between those two markets is where your promotions get matched in 45 minutes without you noticing, where your competitor's flash discount takes your evening volume, and where your product sits out-of-stock through the peak while the report says everything is fine.
Real-Time Food Price Monitoringcloses that gap — not with more spot-checks, but with continuous, category-calibrated, availability-linked price capture across every platform and pin code that matters to you.
FoodDataScrapecrawls 220M+ pages of food data every week so that you find out about a competitor's price move in an hour, not a week.



