

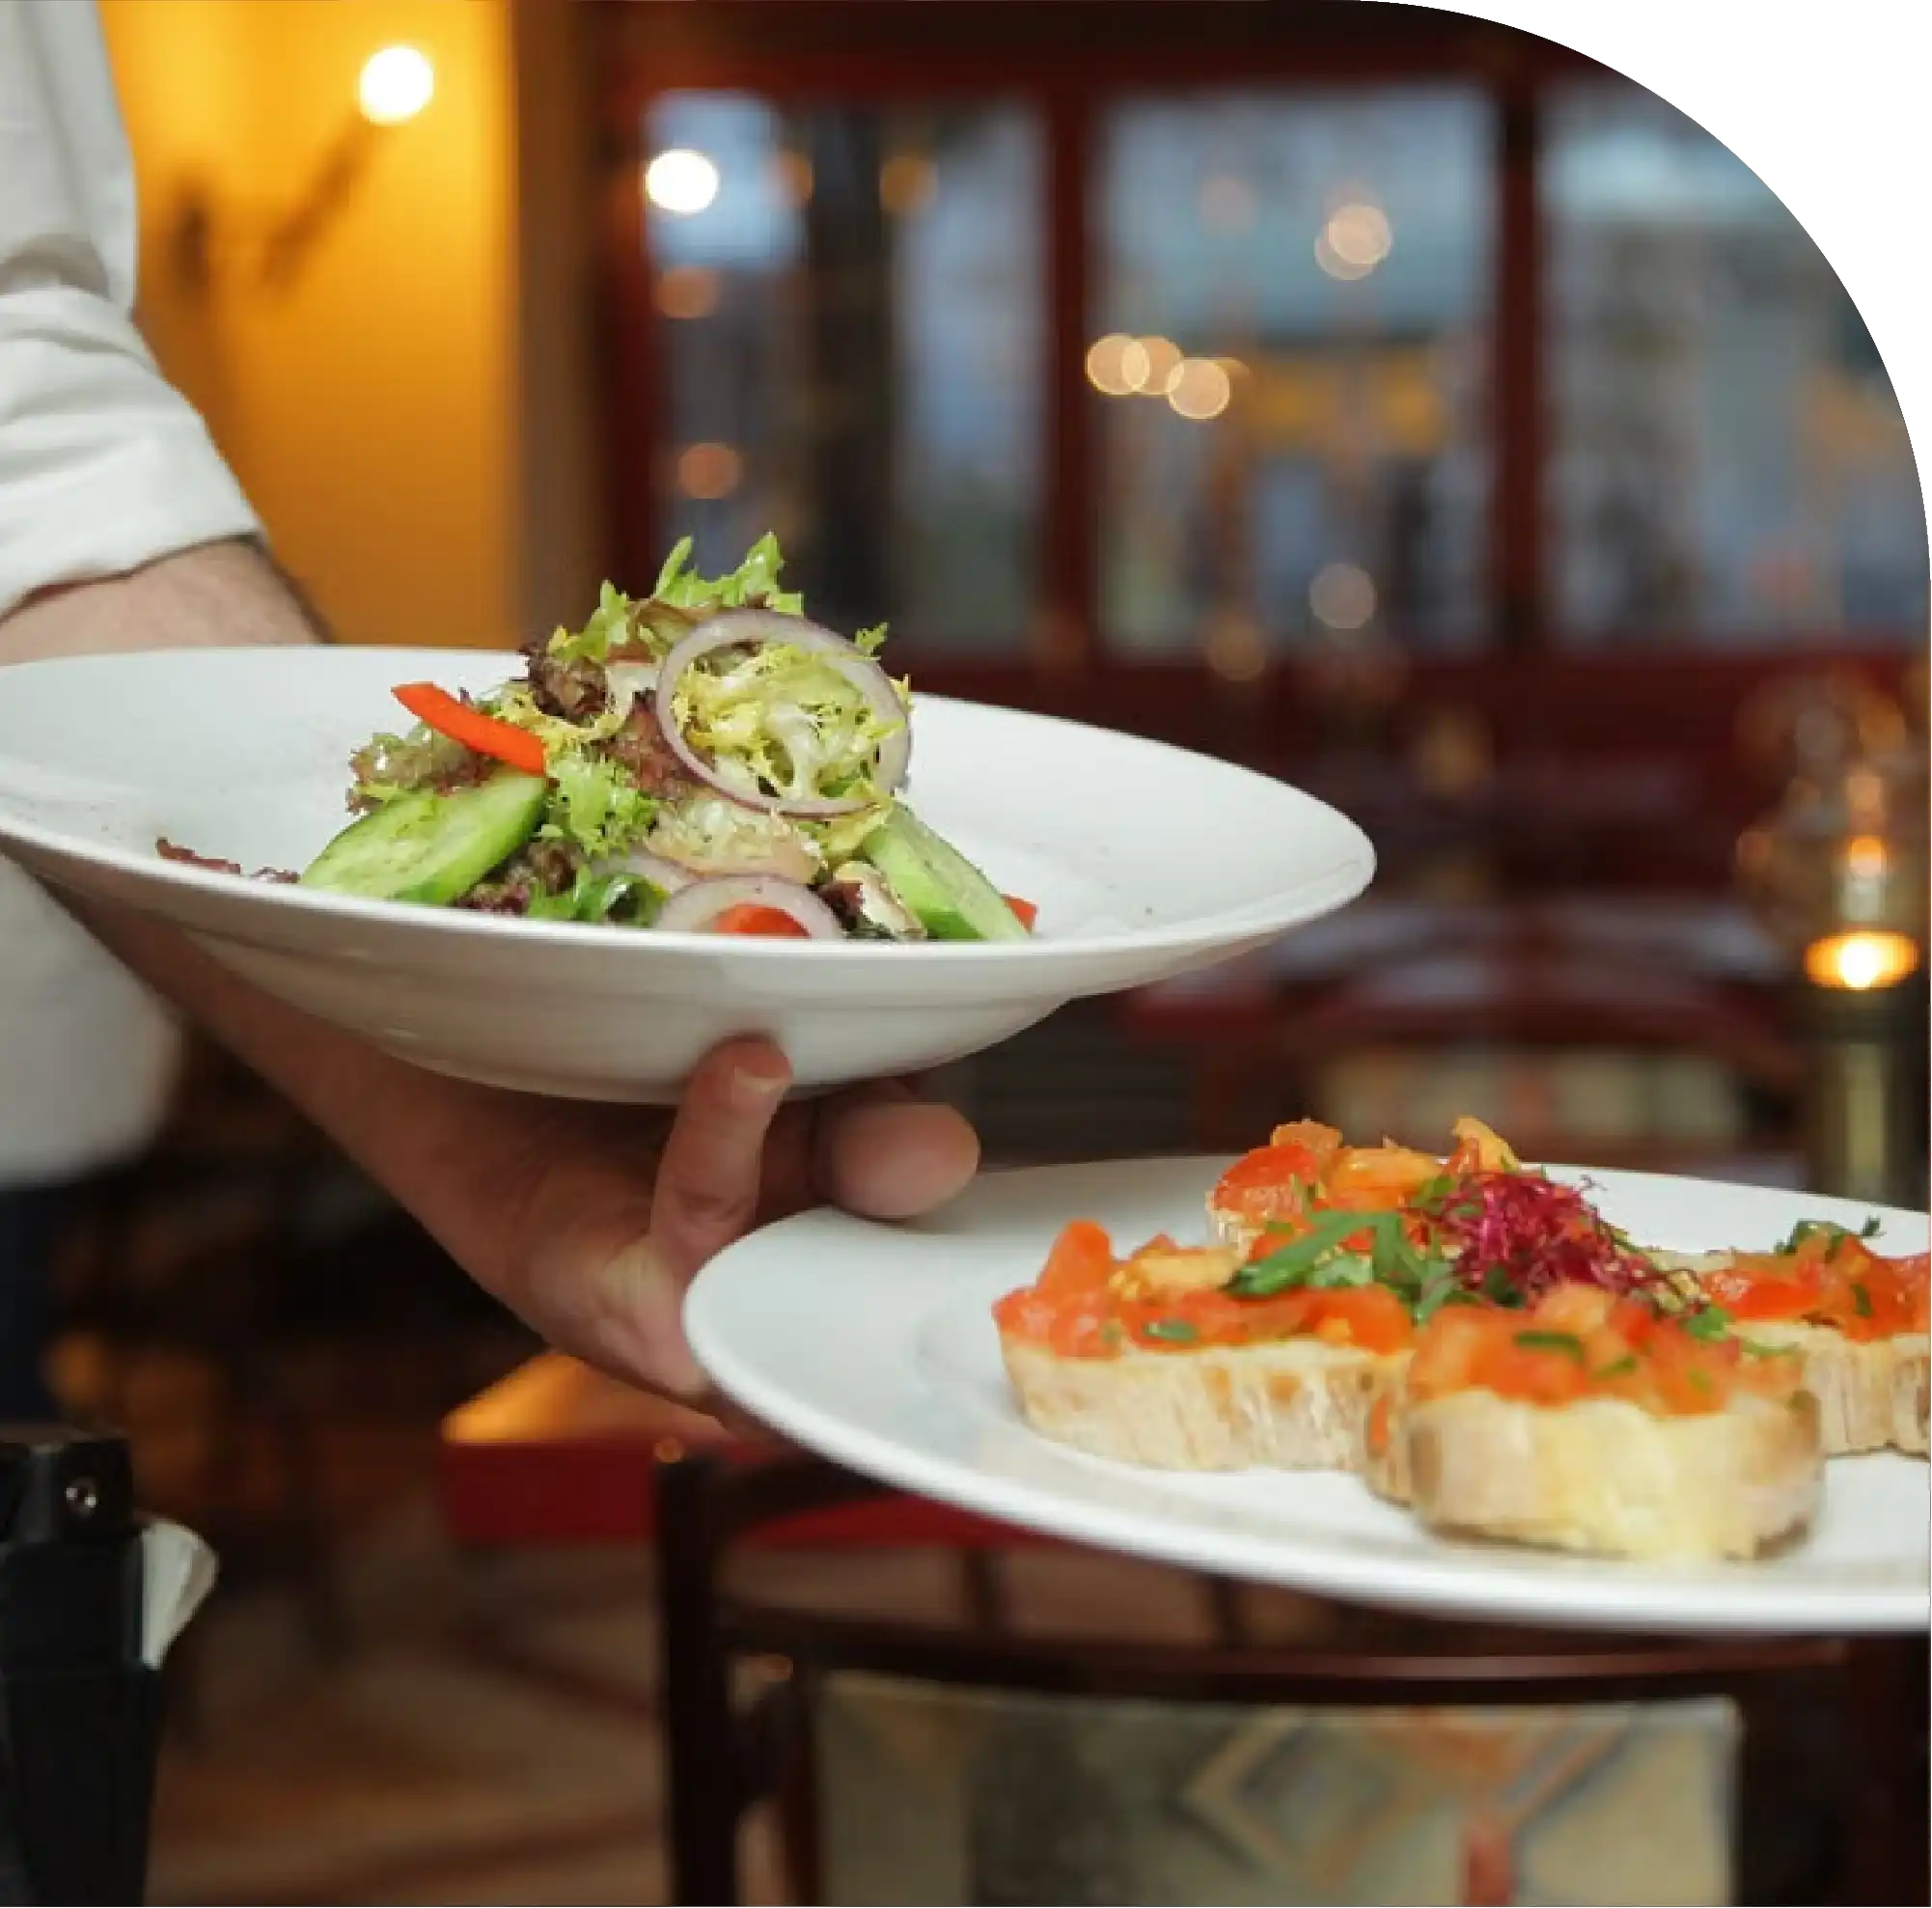
The global food and retail data landscape is undergoing a fundamental shift in 2026, driven by weekly menu-price volatility, the maturation of quick-commerce networks, the rise of dark and cloud kitchens, and the operational deployment of AI across the sector. Restaurant menus, grocery catalogs, quick-commerce assortments, and beverage listings now change with a cadence measured in hours rather than seasons — turning structured, continuously refreshed food and retail data into a front-line competitive asset for brands, retailers, marketplaces, and investors. Understanding these signals in near real time is essential for pricing decisions, category share protection, competitive benchmarking, and expansion planning across the USA, UK, UAE, and India.
Pricing Volatility Signal
Menu prices now shift weekly across delivery platforms rather than seasonally, making live competitor price monitoring essential for margin protection.
Q-Commerce Data Density
Quick-commerce dark stores generate thousands of SKUs per catchment with intraday changes, redefining the digital shelf as a live market where availability decides category share.
Dark Kitchen Insight
A single physical kitchen can operate 7-9 virtual brands, distorting apparent market share and requiring operator-level data resolution for accurate competitive analysis.
AI Decision Layer
AI now converts raw food and retail data into per-item demand forecasts, aspect-level review sentiment, and pricing recommendations at operational speed — turning data volume into daily decisions.
Regional Localization Value
USA delivery-fee transparency, UK dark-store growth, UAE zone-level premium dining, and India q-commerce intensity each require distinct data strategies — a single global assumption is now a liability.

Food and retail data has moved from a back‑office convenience to a front‑line competitive asset. In 2026, the businesses winning shelf space, delivery orders and margin are the ones reading the market in near real time — not quarterly. This report distills what our food data scraping pipelines observed across restaurant menus, grocery catalogs, quick‑commerce apps and alcohol marketplaces in the USA, UK, UAE and India.
Four forces define the year:
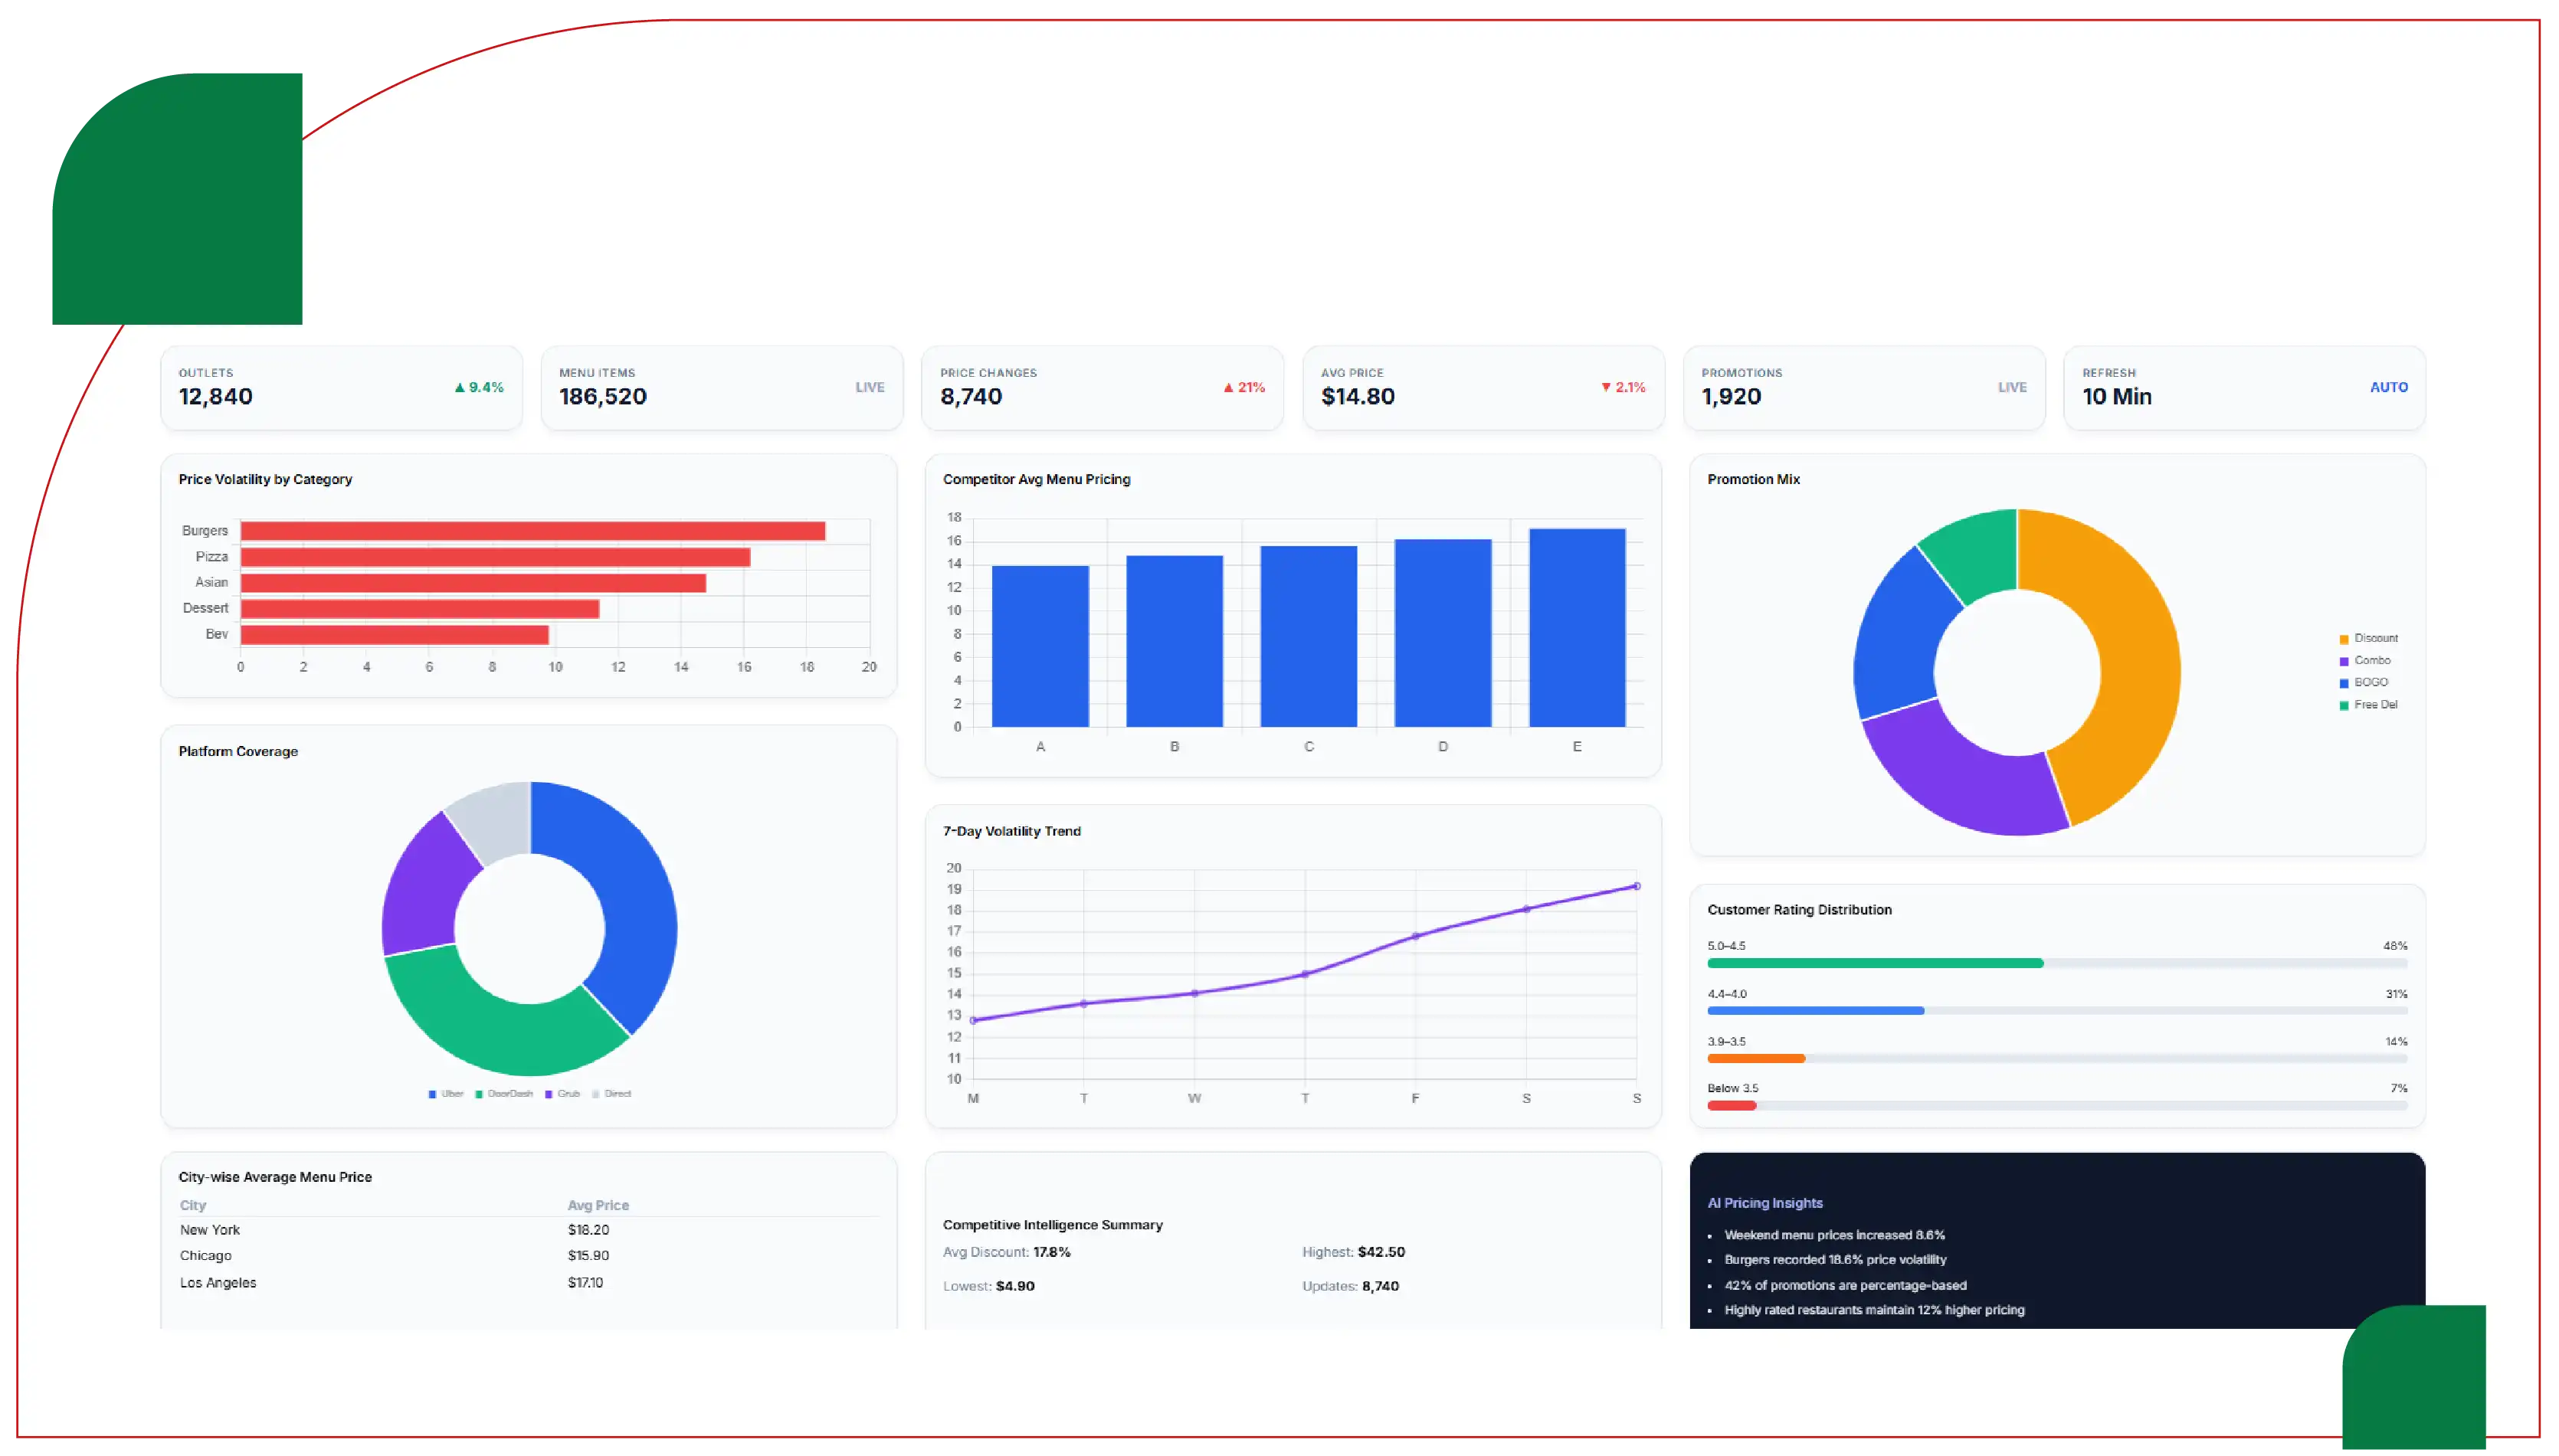
The single clearest signal in our 2026 restaurant menu data is speed. Prices that once moved with seasons now move with the week — nudged by delivery‑platform promotions, ingredient costs, local competition and dynamic surge windows. For pricing teams, this makes restaurant pricing intelligence a live discipline. Monitoring your own catalog is no longer enough; you have to see how the specific outlets competing for the same delivery catchment are priced, promoted and rated — zone by zone.
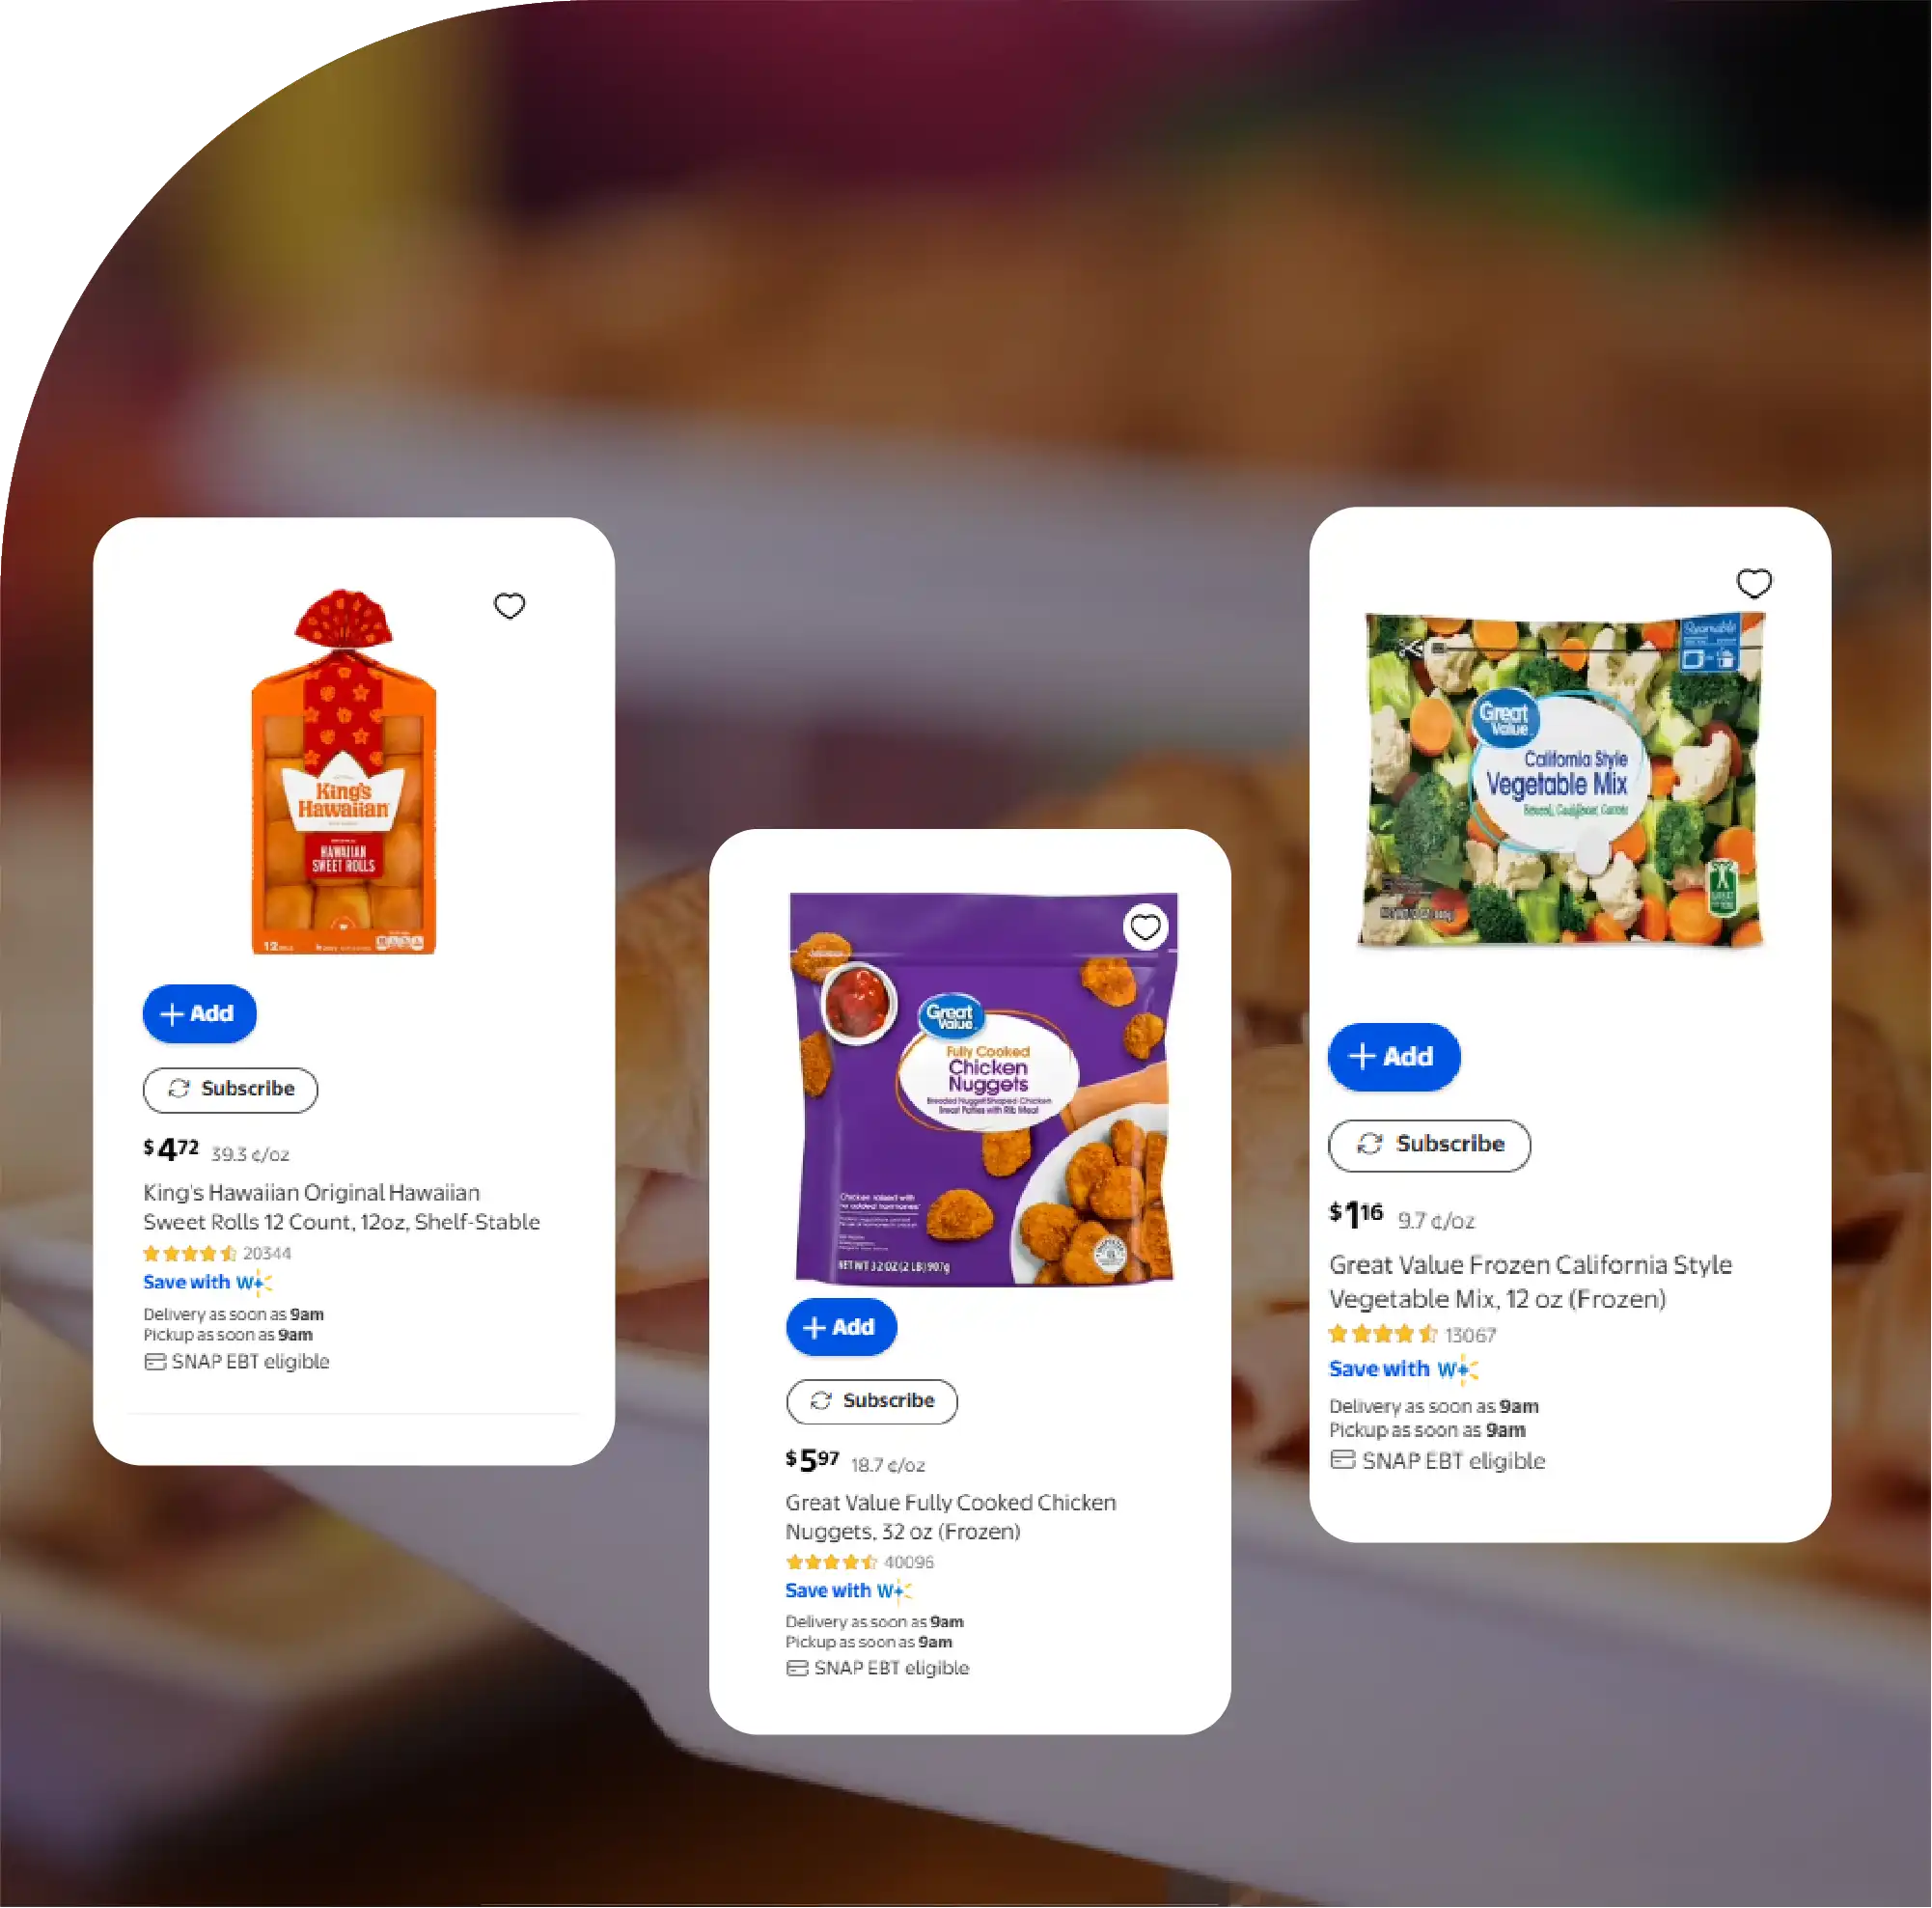
Quick commerce — 10‑ to 20‑minute grocery delivery from dark stores — matured from novelty to habit in 2026, especially across dense urban markets. For CPG and grocery brands, the digital shelf is now where availability is won or lost. Grocery data scraping across quick‑commerce and traditional platforms gives brands a single, comparable view of where their SKUs are available, how they’re priced, and how much category share they hold.
Perhaps the most under‑appreciated trend in our 2026 data is that the number of restaurant brands on delivery apps no longer reflects the number of real kitchens. Dark kitchen data — resolving delivery‑only listings back to shared physical addresses — reveals the real operating footprint behind the brand names, counts brands per kitchen, and scores menu overlap across sibling brands.
Across every category, 2026 was the year AI stopped being a demo and became infrastructure. The raw output of food delivery data and restaurant data intelligence — millions of menu items, prices, reviews and locations — is only useful when it becomes a decision.
Alcohol and beverage catalogs — long fragmented and compliance‑sensitive — became a serious analytics category in 2026.
The same forces played out differently by market. USA, UK, UAE and India each require distinct data strategies.
The findings in this report are built on food data scraping across 200+ platforms in 15 markets, spanning food delivery marketplaces, grocery and quick‑commerce apps, restaurant listings and alcohol retailers.
Retailers & CPG brands: monitor the digital shelf continuously — price, availability and assortment gaps decide category share.
Restaurant chains: treat competitor price monitoring as a live function; benchmark menus against the real local competitive set.
Marketplaces & investors: look past brand counts to the kitchen‑level footprint that dark‑kitchen data reveals.
FoodDataScrape builds the pipelines behind insights like these — restaurant menu data, grocery and q‑commerce SKUs, dark‑kitchen mapping, alcohol catalogs and AI intelligence, delivered as CSV, JSON or API.



