
Introduction
For decades, the soft drinks aisle was one of the most stable pieces of real estate in retail. Two incumbents, a handful of challengers, predictable shelf allocation, and a category that changed at the pace of packaging redesigns.
Then a category that barely existed five years ago started taking shelf.
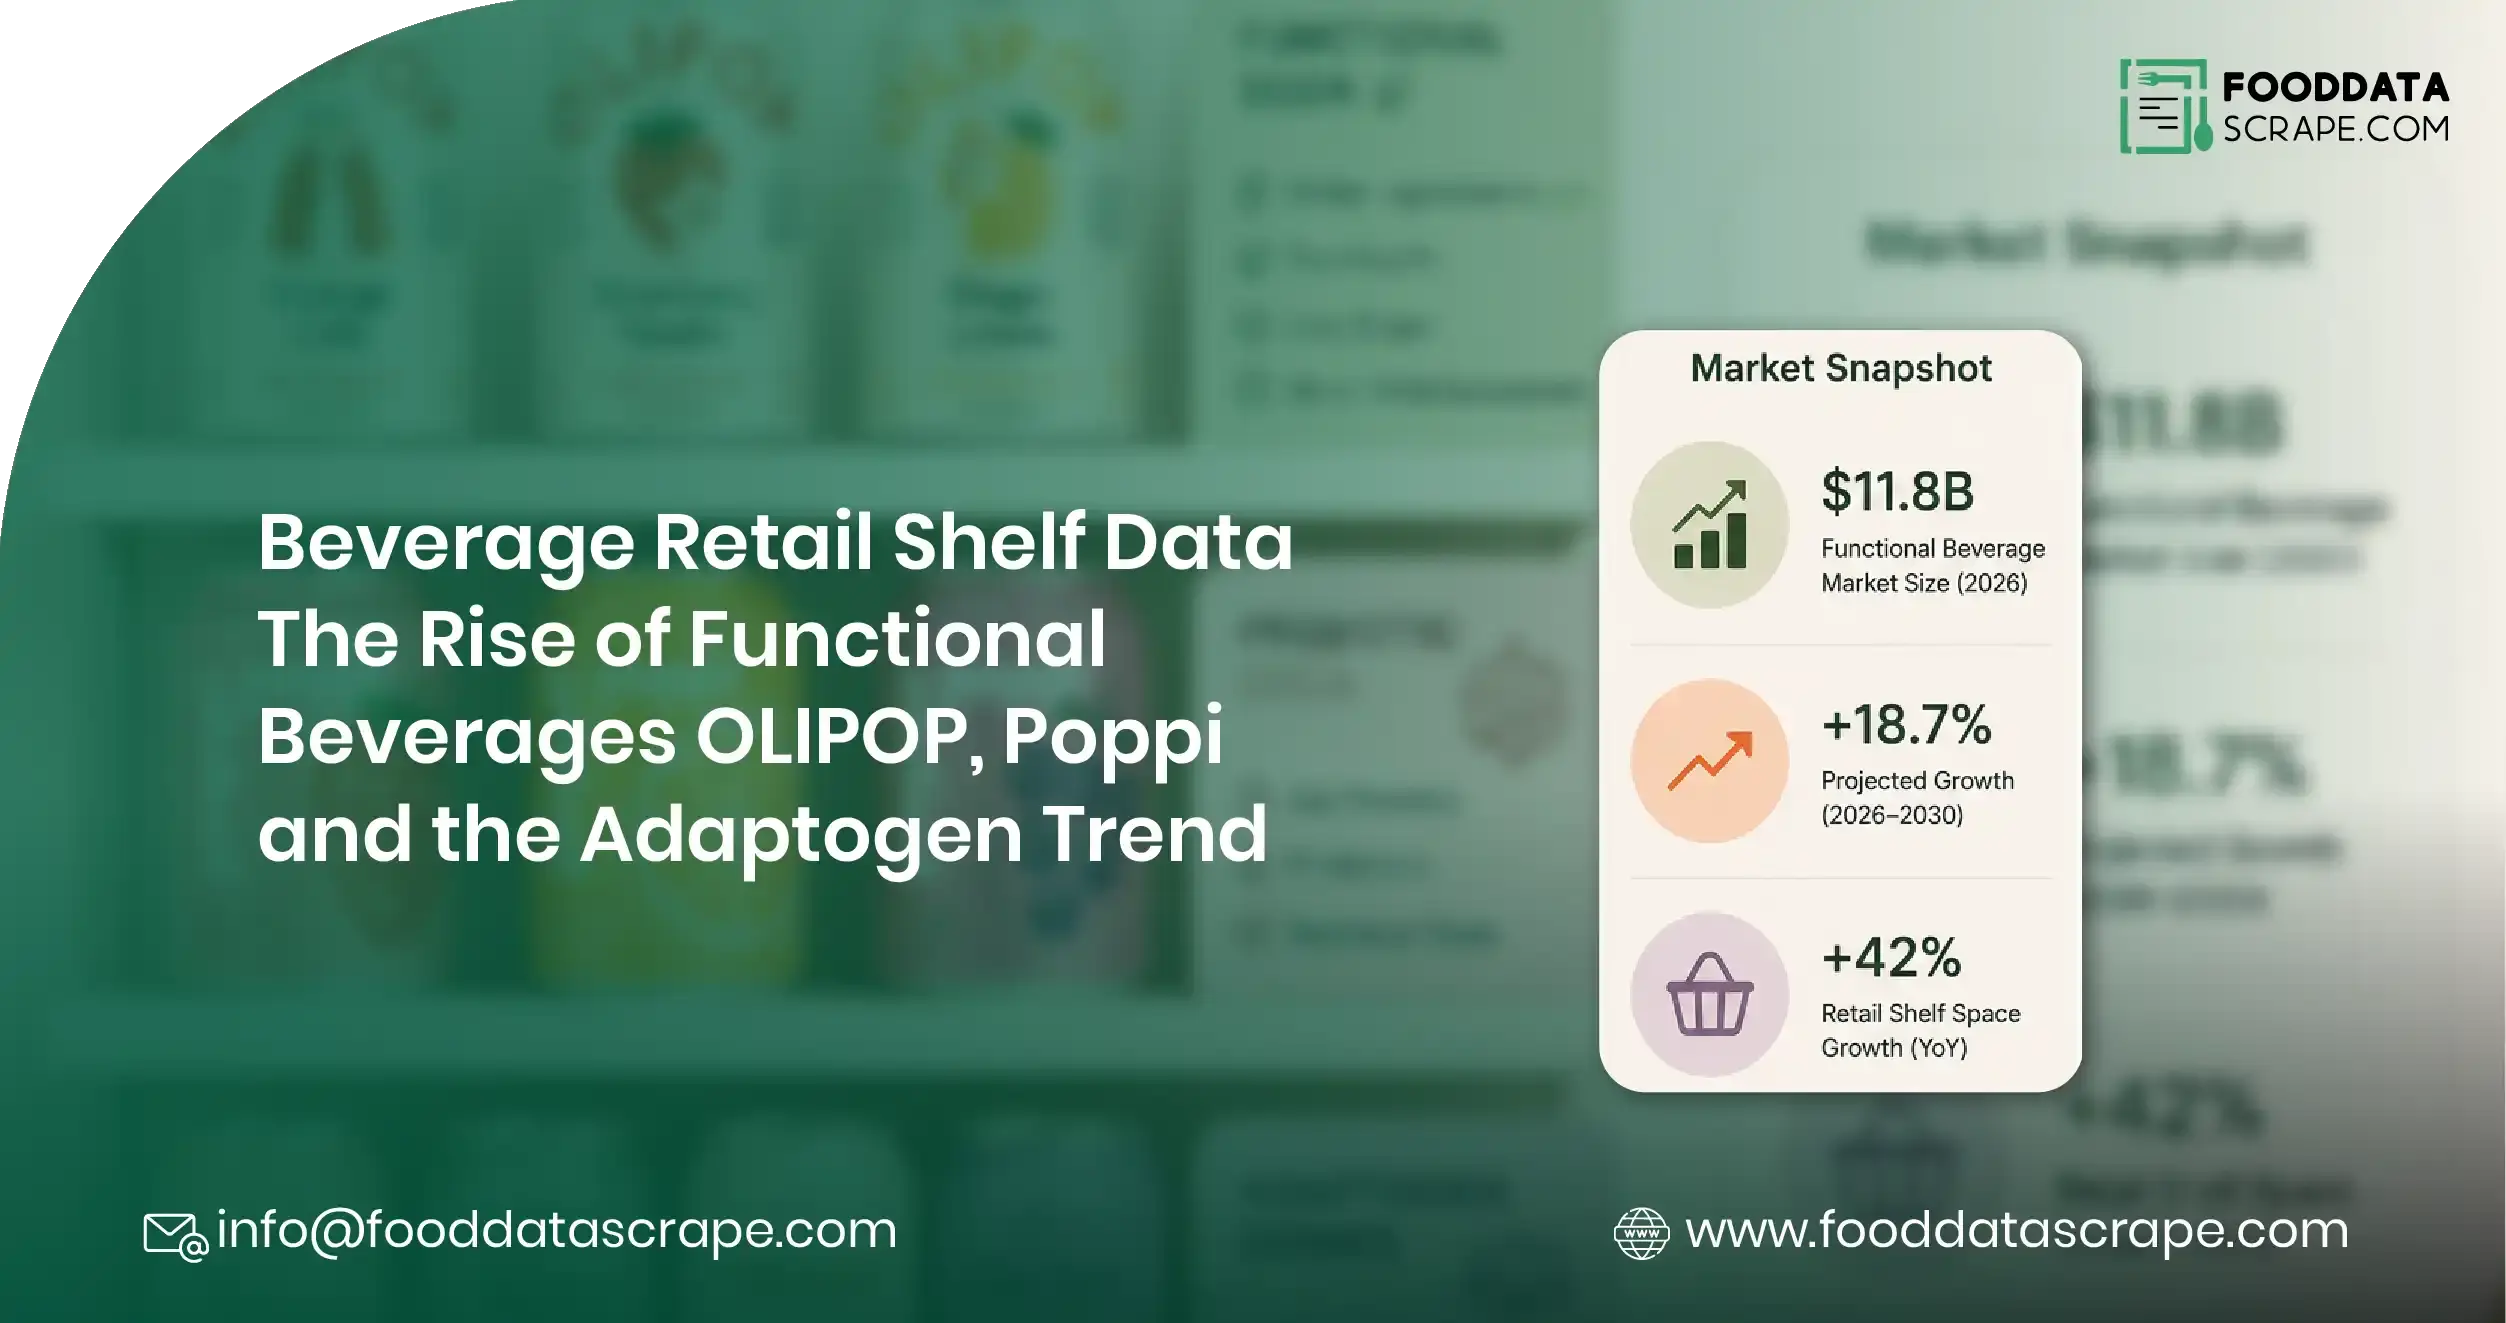
Prebiotic sodas — led by brands like OLIPOP and Poppi — have grown at rates that make traditional carbonated soft drinks look geological. Adaptogen-infused drinks, functional waters, nootropic beverages and gut-health tonics have gone from health-store curiosities to endcap displays in mainstream grocery. The category is compounding at roughly 80% year over year in the fastest-moving segments, and it is doing so by taking shelf facings from products that have held them for a generation.
Here is what makes this genuinely difficult for everyone involved. The category is moving faster than any panel data can report it. By the time a syndicated report describes the state of functional beverages, the shelf has already changed. New brands appear monthly. Retailers reallocate facings quarterly. Distribution expands region by region in ways that no national number captures.
The only way to see it clearly is to look at the shelf itself — continuously, at scale, across every retailer that matters.
Beverage Retail Shelf Data is exactly that. At FoodDataScrape, we crawl 220M+ pages of food and beverage data every week, tracking product listings, shelf position, pricing, distribution and new entrants across grocery, convenience, e-commerce and quick commerce. This article breaks down what the data shows about the functional beverage boom — and what brands, retailers and investors do with it.
Why Functional Beverages Broke the Category
Understanding the mechanics matters, because the same mechanics predict what happens next.
The health positioning is a permission structure, not a benefit claim. Prebiotic sodas succeeded not primarily by being healthy but by giving a soda-drinking consumer permission to keep drinking soda. That is a fundamentally different — and much larger — market than the health beverage category ever was.
They compete on the incumbent's own occasion. Functional beverages did not create a new drinking occasion. They took the existing one. That means growth in the category is, substantially, displacement — and displacement shows up on the shelf as facing reallocation, which is measurable.
Flavour, not function, drives repeat purchase. The functional claim drives trial. Taste drives repeat. This is why flavour SKU proliferation in the category is so aggressive, and why tracking SKU-level velocity matters more than tracking brands.
Distribution is the actual battlefield. A functional beverage brand that wins consumer love and loses shelf space loses. Every one of these brands is fighting a distribution war, retailer by retailer, region by region — and distribution is publicly observable.
Retailer own-label is entering fast. As soon as a category proves out, retailers build their own version and price it beneath the brands. In functional beverages, this is now happening at speed.
The Question Everyone Is Actually Asking
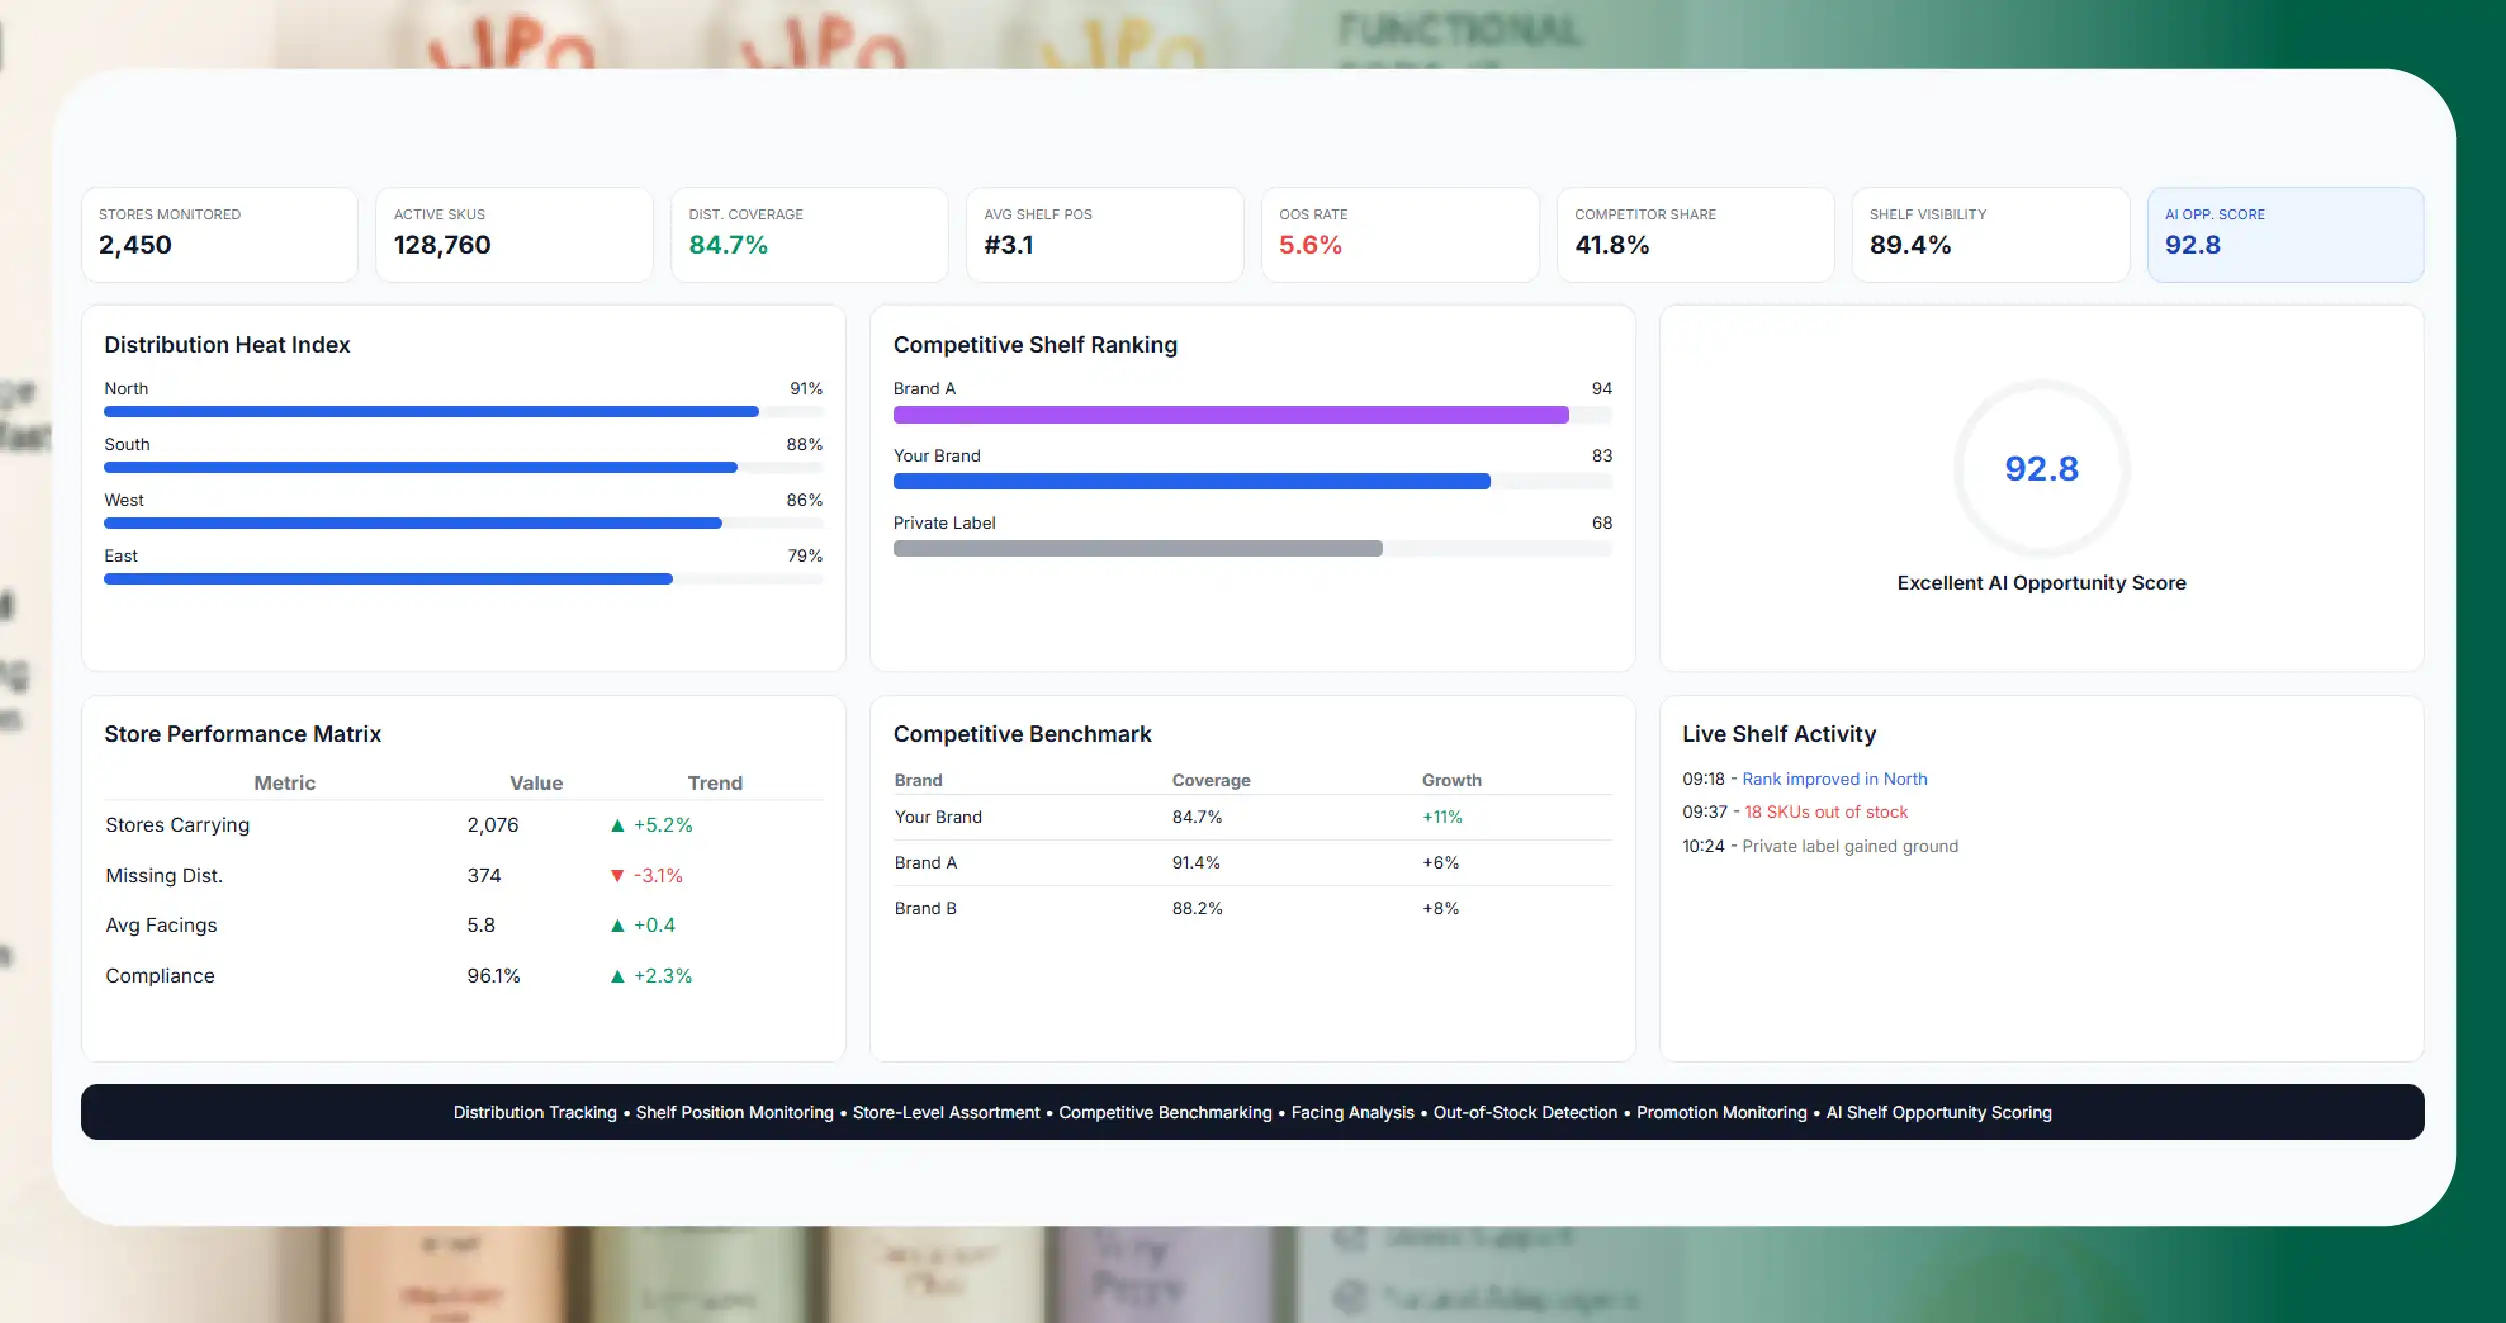
Strip away the trend commentary and every stakeholder in this category is asking one of four questions:
- Brands: Where am I distributed, where am I not, and where is my competitor beating me to shelf?
- Retailers: Which functional SKUs are worth the facings, and what am I giving up to carry them?
- Investors: Is this brand's growth real distribution expansion, or is it a small number of stores with heavy promotion?
- Incumbents: How much shelf am I losing, in which stores, to whom, and how fast?
Every one of these is a distribution and shelf-position question, and not one of them is answered by consumption data. They are answered by looking at the shelf.
Sample Data: A Functional Beverage Shelf Record
The structure below reflects a FoodDataScrape beverage shelf extract. Values are illustrative.
{
  "product_name": "Example Functional Soda — Ginger Lime 355ml",
  "brand": "Example Functional Co.",
  "category": "Prebiotic Soda",
  "functional_claims": ["Prebiotic fibre", "Low sugar", "Gut health"],
  "pack_format": "355ml can",
  "multipack_available": true,
  "capture_period": "2026-07-13",
  "distribution": {
    "retailers_listed": 6,
    "total_retailer_universe": 11,
    "distribution_rate_pct": 54.5,
    "new_retailers_last_90d": 2,
    "lost_retailers_last_90d": 0
  },
  "shelf_metrics": {
    "avg_category_rank": 7,
    "best_rank": 3,
    "worst_rank": 19,
    "facings_estimated": 2,
    "endcap_or_feature_detected": true
  },
  "pricing": {
    "avg_shelf_price_usd": 2.79,
    "promo_frequency_pct": 34,
    "avg_promo_depth_pct": 18,
    "price_vs_category_avg_pct": 12
  },
  "competitive_context": {
    "category_leader_rank": 1,
    "own_label_present": true,
    "own_label_price_usd": 1.89,
    "own_label_price_gap_pct": -32
  }
}
Two fields carry the commercial weight.
distribution_rate_pct: 54.5 — the brand is listed at six of eleven relevant retailers. That is the single most important number in the record, and most brands cannot state their own with confidence. It also means 45% of the addressable retail universe cannot buy this product, regardless of how much consumers want it.
own_label_price_gap_pct: -32 — a retailer own-label version is on shelf at a 32% discount. In a category built on trial and taste, that gap is the beginning of the substitution curve. It is the number that determines whether this brand is building an asset or renting a trend.
Sample Data: Category Distribution League Table
| Brand | Retailers Listed | Distribution Rate | Avg Rank | Avg Price | Promo Frequency | 90-Day Trend |
|---|---|---|---|---|---|---|
| Category Leader A | 11 / 11 | 100% | 2 | $2.49 | 41% | Stable |
| Category Leader B | 10 / 11 | 91% | 3 | $2.59 | 38% | +1 retailer |
| Example Functional Co. | 6 / 11 | 55% | 7 | $2.79 | 34% | +2 retailers |
| Challenger C | 4 / 11 | 36% | 11 | $2.65 | 52% | +1 retailer |
| Challenger D | 3 / 11 | 27% | 14 | $2.89 | 19% | −1 retailer |
| Retailer Own-Label | 7 / 11 | 64% | 5 | $1.89 | 12% | +3 retailers |
Read the bottom row carefully. Retailer own-label is now more widely distributed than three of the five branded players, at a 30%+ discount, and it is expanding faster than anyone. It gained three retailers in 90 days.
That is the story of this category in one line, and it is not the story the trend articles are telling. The functional beverage boom is real — and the retailers who allocated shelf to it are now taking that shelf back for themselves.
Challenger D lost a retailer. In a category growing at 80%, losing distribution is not a slow decline. It is the beginning of the end, and it is visible in the data a full quarter before it appears in any revenue number.
Sample Data: Regional Distribution Gap Analysis
| Region | Retailers in Region | Your Listings | Competitor A | Gap | Priority |
|---|---|---|---|---|---|
| Northeast | 9 | 7 | 9 | −2 | Medium |
| West Coast | 11 | 10 | 11 | −1 | Low |
| Midwest | 8 | 3 | 8 | −5 | Critical |
| South | 10 | 4 | 9 | −5 | Critical |
| Mountain | 6 | 5 | 5 | 0 | Low |
This table converts a vague strategic worry — "we think we're under-distributed in the middle of the country" — into a specific, addressable, prioritised sales target list. Two regions, ten missing listings, named retailers.
That is the difference between a market report and a work order.
The Distribution Trap Every Emerging Beverage Brand Falls Into
There is a predictable failure pattern in this category, and it is worth naming because it is avoidable.
A brand confuses velocity with distribution. It performs beautifully in the two hundred stores where it is listed, concludes the product has product-market fit, and raises money on that basis. But its ceiling is set by its distribution, not its velocity — and its distribution is 20% of the addressable universe. It cannot grow into its valuation without a distribution expansion it has not planned for.
It confuses promotion with demand. A brand promoted 50% of the time is selling at an effective price it cannot sustain. When the promotion stops, so does the velocity. Promotional frequency is one of the most honest numbers in this dataset, and it is one almost no brand publishes about itself.
It ignores own-label until it is too late. Retailer own-label enters the category quietly, at a 30% discount, and takes the price-sensitive tier of the market — which, in a category driven by trial, is a large share of it. By the time it shows up in a brand's own sales data, the facings are already reallocated.
It over-indexes on the retailers that said yes. The retailers that are easiest to win are usually the ones that matter least. The distribution gaps that hurt are in the accounts a brand has been avoiding because the conversation is hard.
Every one of these is visible in shelf data before it is visible in revenue — which means every one of them is fixable while it is still cheap to fix.
Who Uses Beverage Retail Shelf Data
Functional beverage brands Track distribution rate, identify white-space retailers, monitor shelf rank, detect own-label threats, and benchmark promotional intensity against competitors.
Incumbent soft drinks companies Quantify exactly how much shelf they are losing, in which stores, to which challengers — and how fast. This is the earliest available warning of category erosion.
Retailers and category managers Evaluate which functional SKUs justify their facings, identify assortment gaps, and benchmark their own-label performance against the brands they are competing with.
Distributors and DSD operators Identify brands gaining distribution rapidly — these are the brands worth taking on — and identify accounts where a brand they carry is absent.
Investors and consumer-focused funds Distinguish genuine distribution expansion from promotional volume. A brand growing revenue without growing distribution is buying its growth, and that shows up clearly in the data.
Ingredient and co-packing suppliers Identify emerging brands scaling their SKU count and pack formats — the earliest signal of a manufacturing need.
Market researchers and trend analysts Track new entrant velocity, claim proliferation and flavour trends at the shelf, months before syndicated data reports them.
The FoodDataScrape Beverage Shelf Data Model
- Product identity: product name, brand, parent company, category and sub-category, pack format, pack size, multipack structure, flavour, product identifiers
- Functional claims: claim extraction and normalisation (prebiotic, adaptogen, nootropic, electrolyte, low sugar, etc.), ingredient-level functional actives
- Distribution: retailers listed, distribution rate against a defined retailer universe, new listings, delistings, regional distribution mapping
- Shelf metrics: category rank, search rank, estimated facings, endcap and feature detection, sponsored placement detection
- Pricing: shelf price, promotional price, promotional frequency and depth, price index versus category average, price per unit of measure
- Competitive context: competitor ranks and prices, own-label presence and price gap, category price ladder
- New entrant tracking: new brand detection, new SKU detection, claim and flavour trend velocity
- Change tracking: listing gains and losses, rank movement, price changes, pack format changes
Delivered via API, CSV, JSON, Parquet, cloud storage or direct BI integration.
Methodology and Compliance
- We collect publicly accessible product, pricing, listing and shelf-position information only. No authenticated content, no private data, no personal consumer data.
- Distribution rate is computed against a client-defined retailer universe, because a distribution percentage is meaningless without a stated denominator. This is where most distribution reporting quietly misleads.
- Products are normalised across retailers, so the same SKU listed with differing names, sizes and descriptors resolves to a single entity.
- Facings are estimated, and we label them as estimates. Digital shelf data is an excellent proxy for physical shelf allocation but is not a substitute for a physical audit, and we do not pretend otherwise.
- Crawlers are rate-limited and designed not to degrade the retailer sites we collect from.
Measurable Outcomes
| Metric | Panel / Syndicated Data | With FoodDataScrape |
|---|---|---|
| Reporting lag | 4–12 weeks | Under 1 week |
| Distribution visibility | Estimated, sampled | Listing-level, complete |
| New entrant detection | Months late | Within days of listing |
| Own-label threat tracking | Not broken out | Quantified per SKU |
| Regional gap identification | Aggregated | Retailer-by-retailer |
| Delisting early warning | After revenue impact | At the listing change |
Conclusion
The functional beverage category is not being decided in consumer surveys or trend decks. It is being decided on shelves, retailer by retailer, facing by facing — and the brands winning it are the ones who can see exactly where they are listed, where they are not, where they rank, and what the retailer's own-label is doing underneath them.
Growth of 80% year over year attracts attention. It also attracts own-label, and own-label is already outpacing most of the brands that built the category.
Beverage Retail Shelf Data is how you see that happening in time to respond — not a quarter after the facings are gone.
FoodDataScrape crawls 220M+ pages of food and beverage data every week so that your distribution strategy is built on the shelf as it actually is.
Questions
Frequently Asked Questions
No, and we are explicit about that. This is distribution, shelf position, pricing and assortment data. It is a leading indicator of sales, not a substitute for consumption data — the two are complementary, and the honest answer is that you want both.
Grocery, convenience, natural, mass and e-commerce retailers across the US, UK, Europe and other markets. The retailer universe is defined with you, since it determines every distribution number in the dataset.
Yes — new entrant detection is one of the most valuable outputs, and it typically surfaces a brand months before it appears in any syndicated report.
Weekly on listings and shelf position; daily on pricing and promotions where volatility warrants it.
Yes, and mapping own-label against branded equivalents is where much of the strategic value sits in this category right now.
Yes. Most clients define a category scope and a retailer universe, which keeps the dataset focused and the numbers meaningful.
Get a Free Food Data Sample in 48 Hours.
Tell us your platforms, target markets and required fields — we'll map exactly what's possible with food data scraping, recommend the right approach, and send a working sample so you can verify quality before any commitment.
Request a strategy call
Thanks — our data team will reach out within 48 hours with your sample.



