
Why Blinkit Stock-Outs Are So Expensive
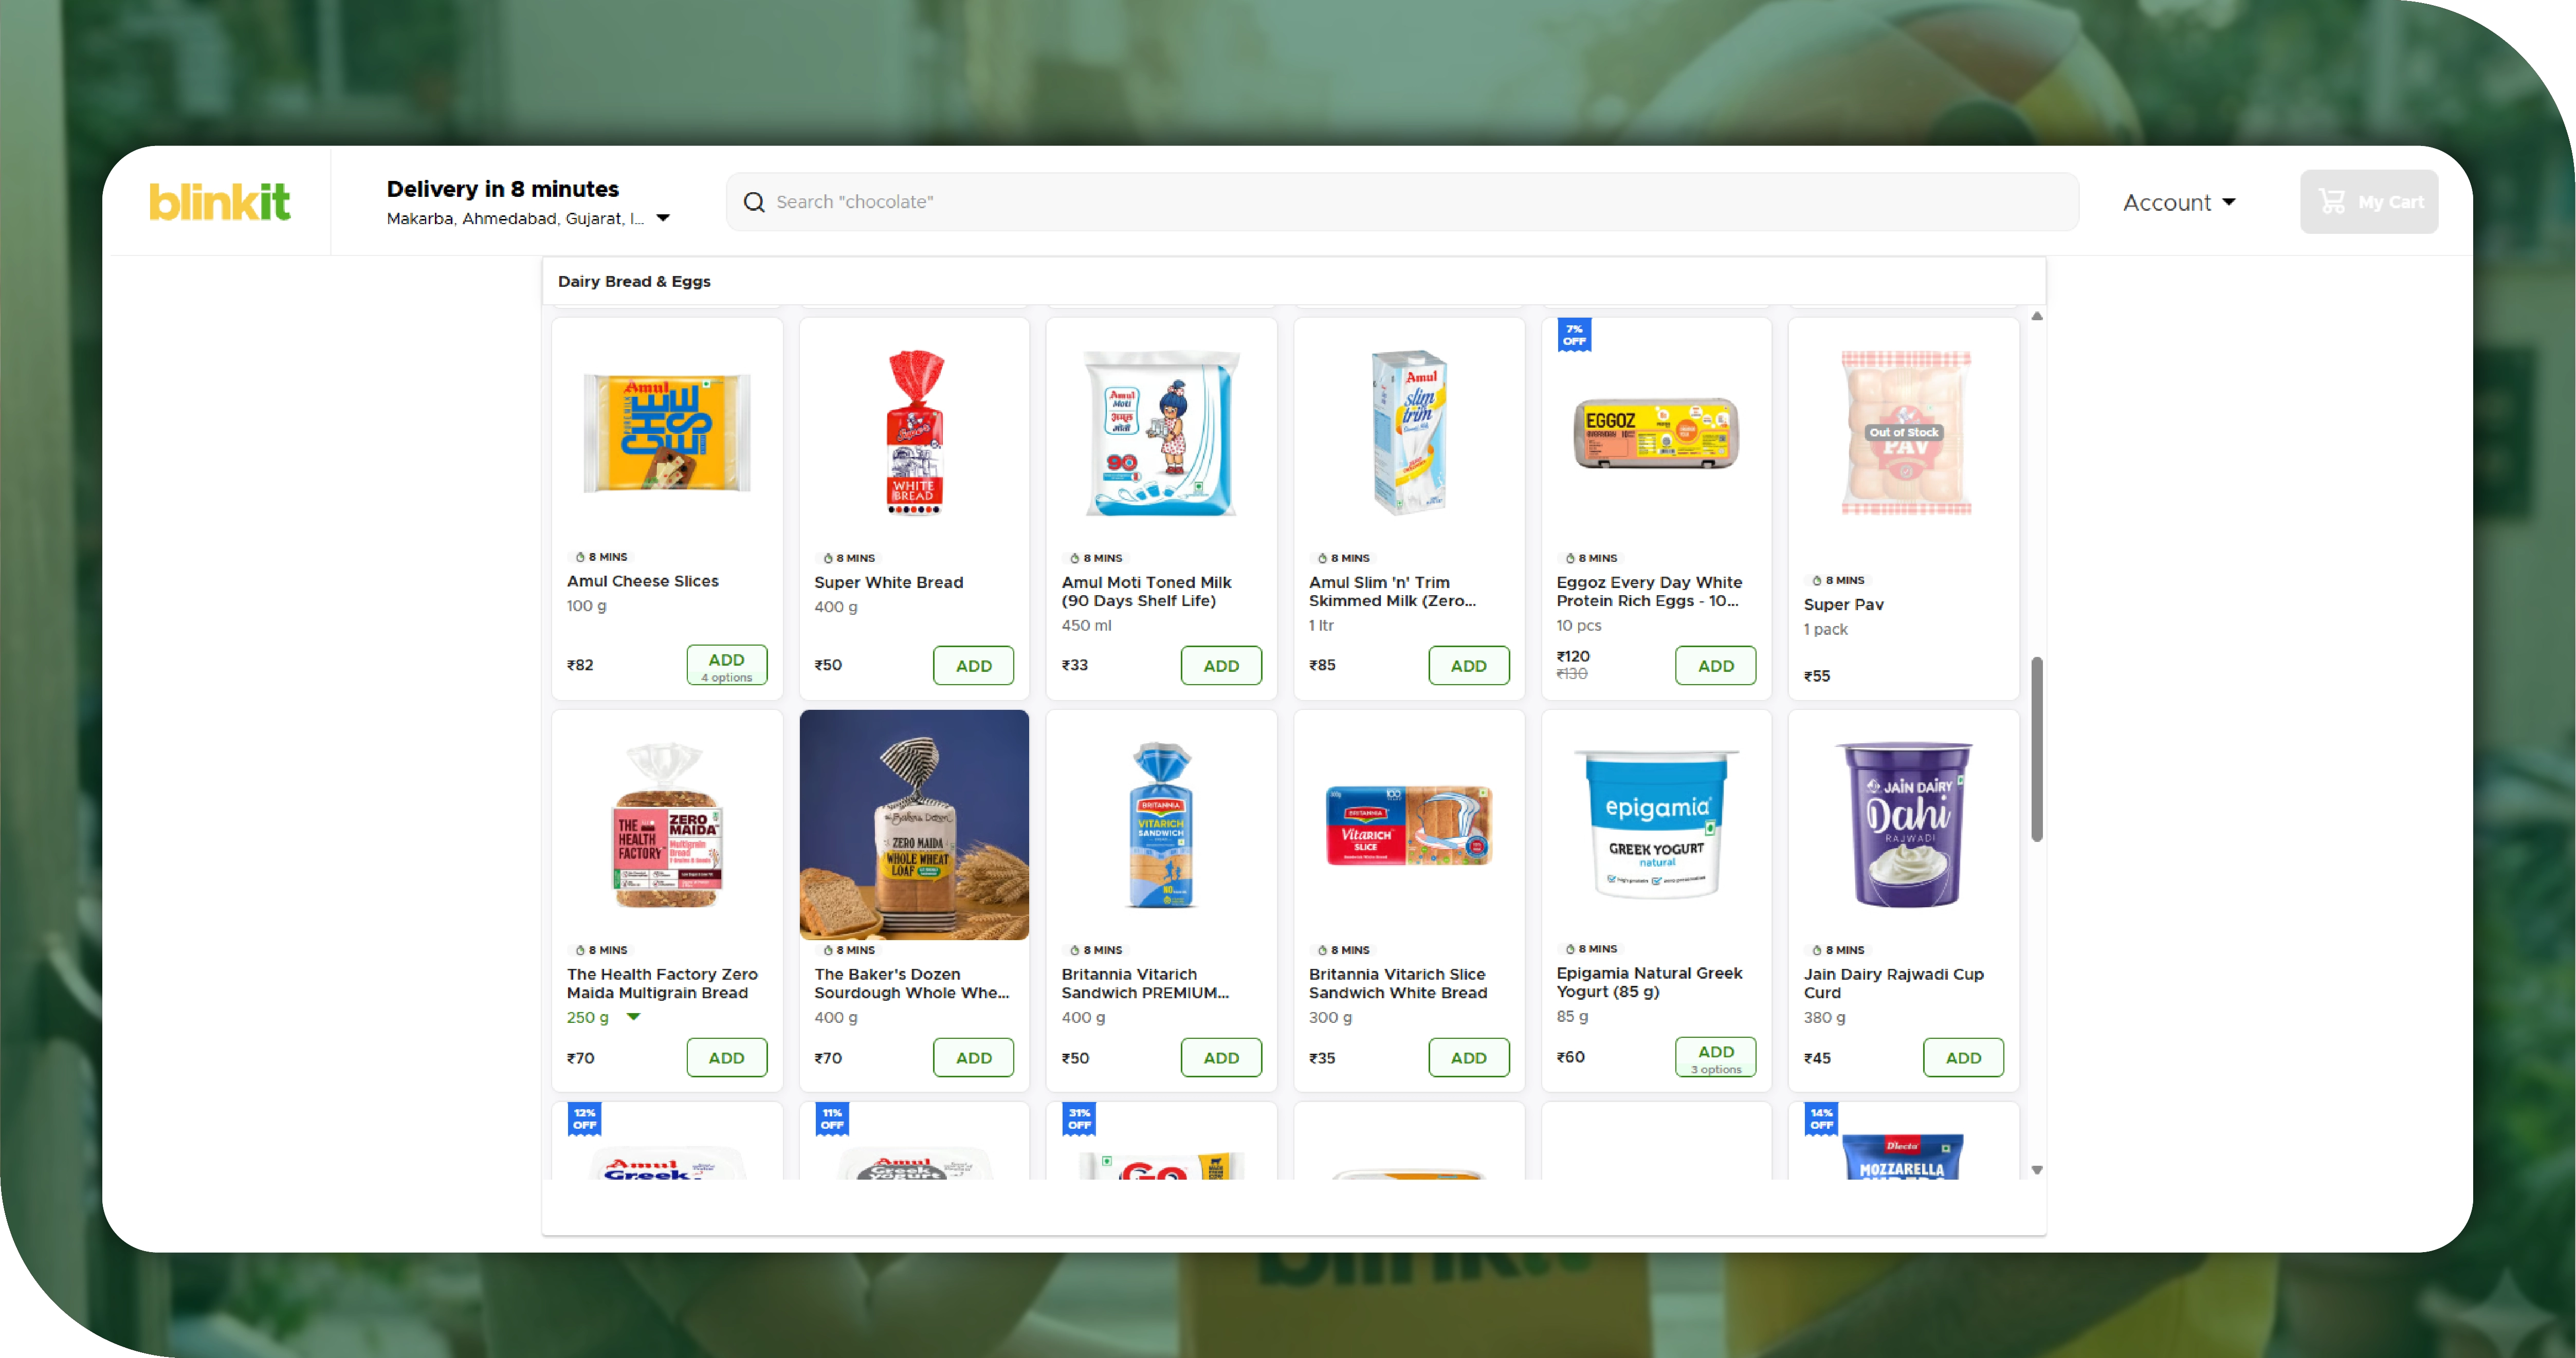
The economics of quick commerce make availability the single most valuable operational signal a brand can track.
- The sale transfers instantly. When a shopper cannot find your product, the next option is one tap away. There is no rain-check, no "I'll come back later" — the order goes to a competitor in the same minute.
- Stock-outs are local and hidden. An out-of-stock in a dense pin code affects real demand, but it is invisible in any citywide or platform-level view. Only pin-code tracking sees it.
- Peak-hour stock-outs cost the most. A stock-out during the evening ordering peak is worth far more lost revenue than the same gap at a quiet hour, because that is when order volume is highest.
- They get misdiagnosed. Because the stock-out is invisible, the resulting sales dip gets written off as soft demand — the wrong diagnosis, which means the wrong fix.
The brand does not need more sales reports. It needs to know, within the hour, which dark store went dark on which SKU — so it can act while the sale is still recoverable.
How the Monitoring Works
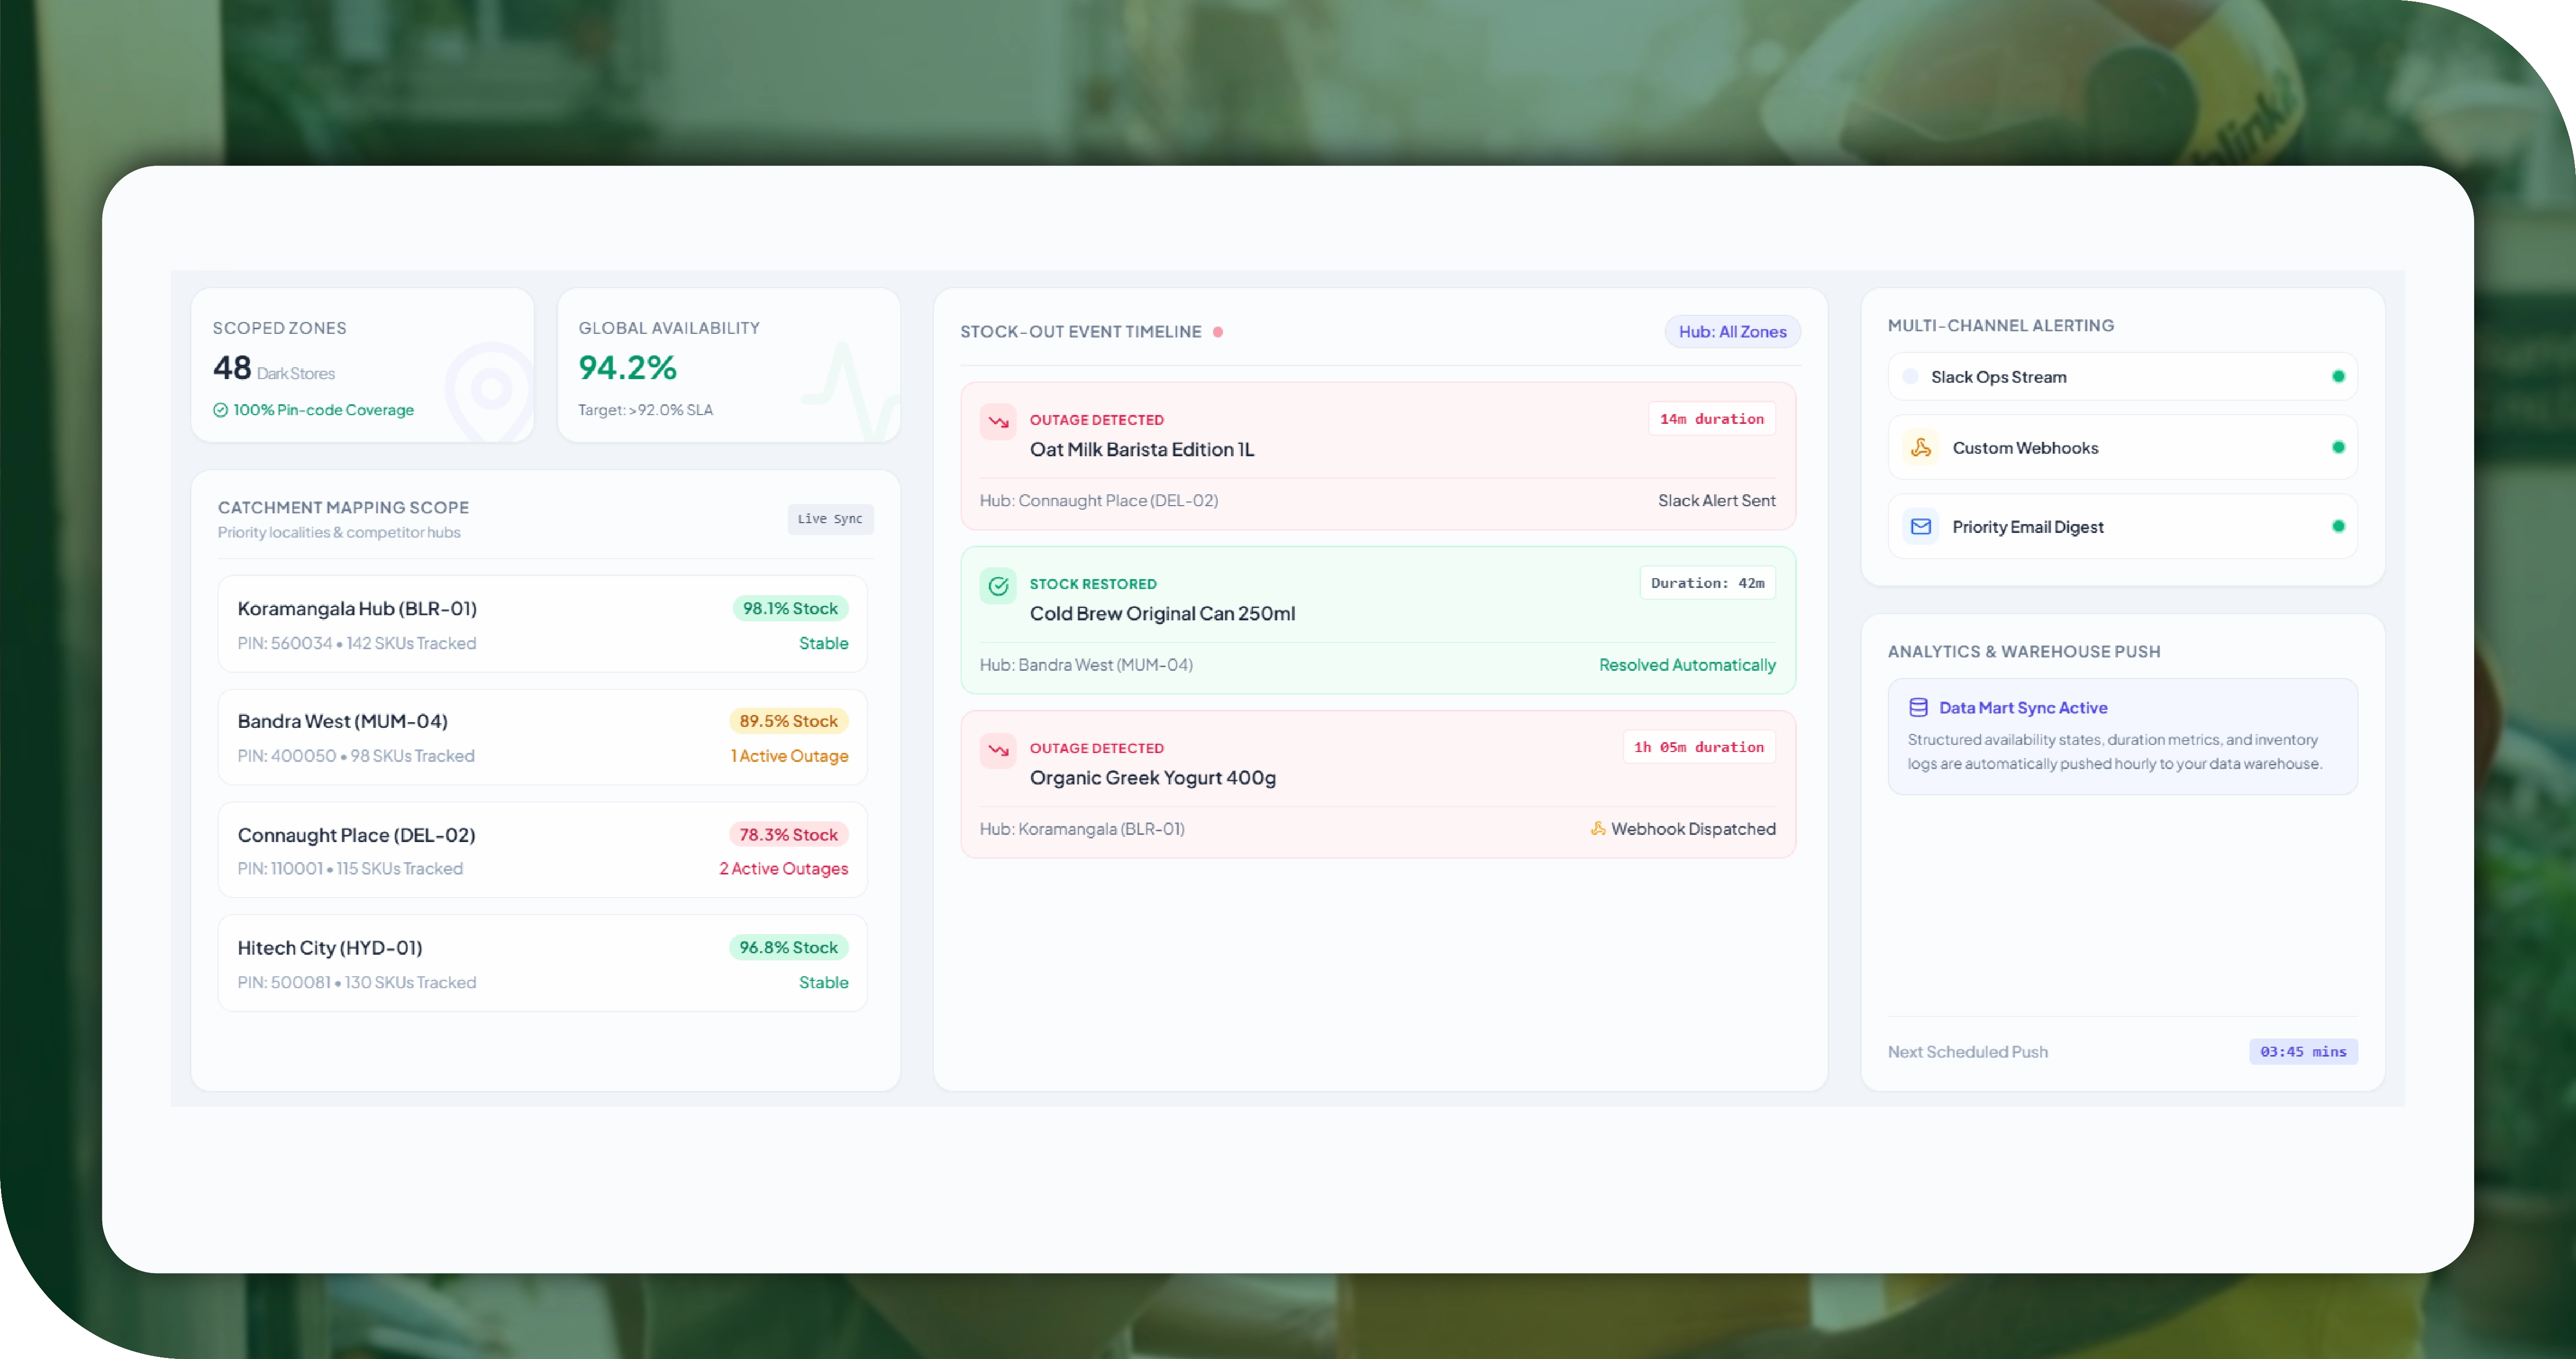
- Catchment mapping. The pin codes and dark-store catchments in scope are defined — typically a brand's priority localities plus the zones where it competes hardest.
- High-frequency availability collection. For each catchment, the in-stock or out-of-stock status of the tracked SKUs is collected on a frequent cadence, because availability is the most perishable field there is.
- Stock-out event detection. Each refresh is compared against the previous state to detect the exact moment a SKU goes out of stock and the moment it returns — producing a duration, not just a status.
- Alerting. Stock-out events trigger webhook, Slack or email alerts, so the team is notified within the collection window rather than discovering the gap after the fact.
- Delivery. A live availability dashboard, plus alerts, plus scheduled files into a warehouse for the analytics team — matched to how the brand works.
Sample Data: An Availability Record
The structure below reflects a FoodDataScrape Blinkit availability record. Values are illustrative.
{
    "sku_name": "Example Brand Instant Noodles 70g",
    "brand": "Example Brand",
    "category": "Instant Food",
    "platform": "Blinkit",
    "city": "Bengaluru",
    "pin_code": "560095",
    "dark_store_catchment": "Koramangala",
    "in_stock": false,
    "went_oos_at": "18:35",
    "back_in_stock_at": null,
    "oos_duration_min": 92,
    "selling_price_inr": 45,
    "category_rank_when_listed": 3
}
The oos_duration_min field is the one that turns availability into money. This SKU has been out of stock for 92 minutes, straddling the evening peak, in a dense catchment where it normally ranks 3rd in its category. That is 92 minutes of demand handed to a competitor — quantified, located and actionable, instead of buried in a monthly sales report.
Sample Data: Pin-Code Availability Grid
Product: Example Brand Instant Noodles 70g — Platform: Blinkit — Bengaluru
| Pin Code | Catchment | Status | OOS Duration | Category Rank |
|---|---|---|---|---|
| 560095 | Koramangala | Out of stock | 92 min | 3 |
| 560034 | Ejipura | In stock | — | 2 |
| 560066 | Whitefield | Out of stock | 145 min | 5 |
| 560102 | HSR Layout | In stock | — | 3 |
| 560078 | JP Nagar | In stock | — | 4 |
| 560001 | MG Road | Out of stock | 60 min | 6 |
Three of six tracked catchments are out of stock at once, two of them for over an hour, all during the evening peak. Citywide, the brand's dashboard might show availability looking broadly healthy. At the catchment level, the brand is losing the peak in half its priority zones — and only pin-code monitoring makes that visible in time to fix it.
Sample Data: Stock-Out Event Log
| Timestamp | Pin Code | Catchment | Event | Duration |
|---|---|---|---|---|
| 18:35 | 560095 | Koramangala | Went OOS | — |
| 18:50 | 560066 | Whitefield | Went OOS | — |
| 19:20 | 560001 | MG Road | Went OOS | — |
| 20:20 | 560001 | MG Road | Back in stock | 60 min |
| 20:07 | 560095 | Koramangala | Back in stock | 92 min |
| 21:15 | 560066 | Whitefield | Back in stock | 145 min |
The event log is what makes the monitoring actionable rather than descriptive. It records the exact moment each stock-out began and ended, so the brand can quantify lost peak-hour availability, escalate to Blinkit category managers with pin-code specifics, and hold the platform accountable with evidence instead of anecdotes.
What Brands Do With It
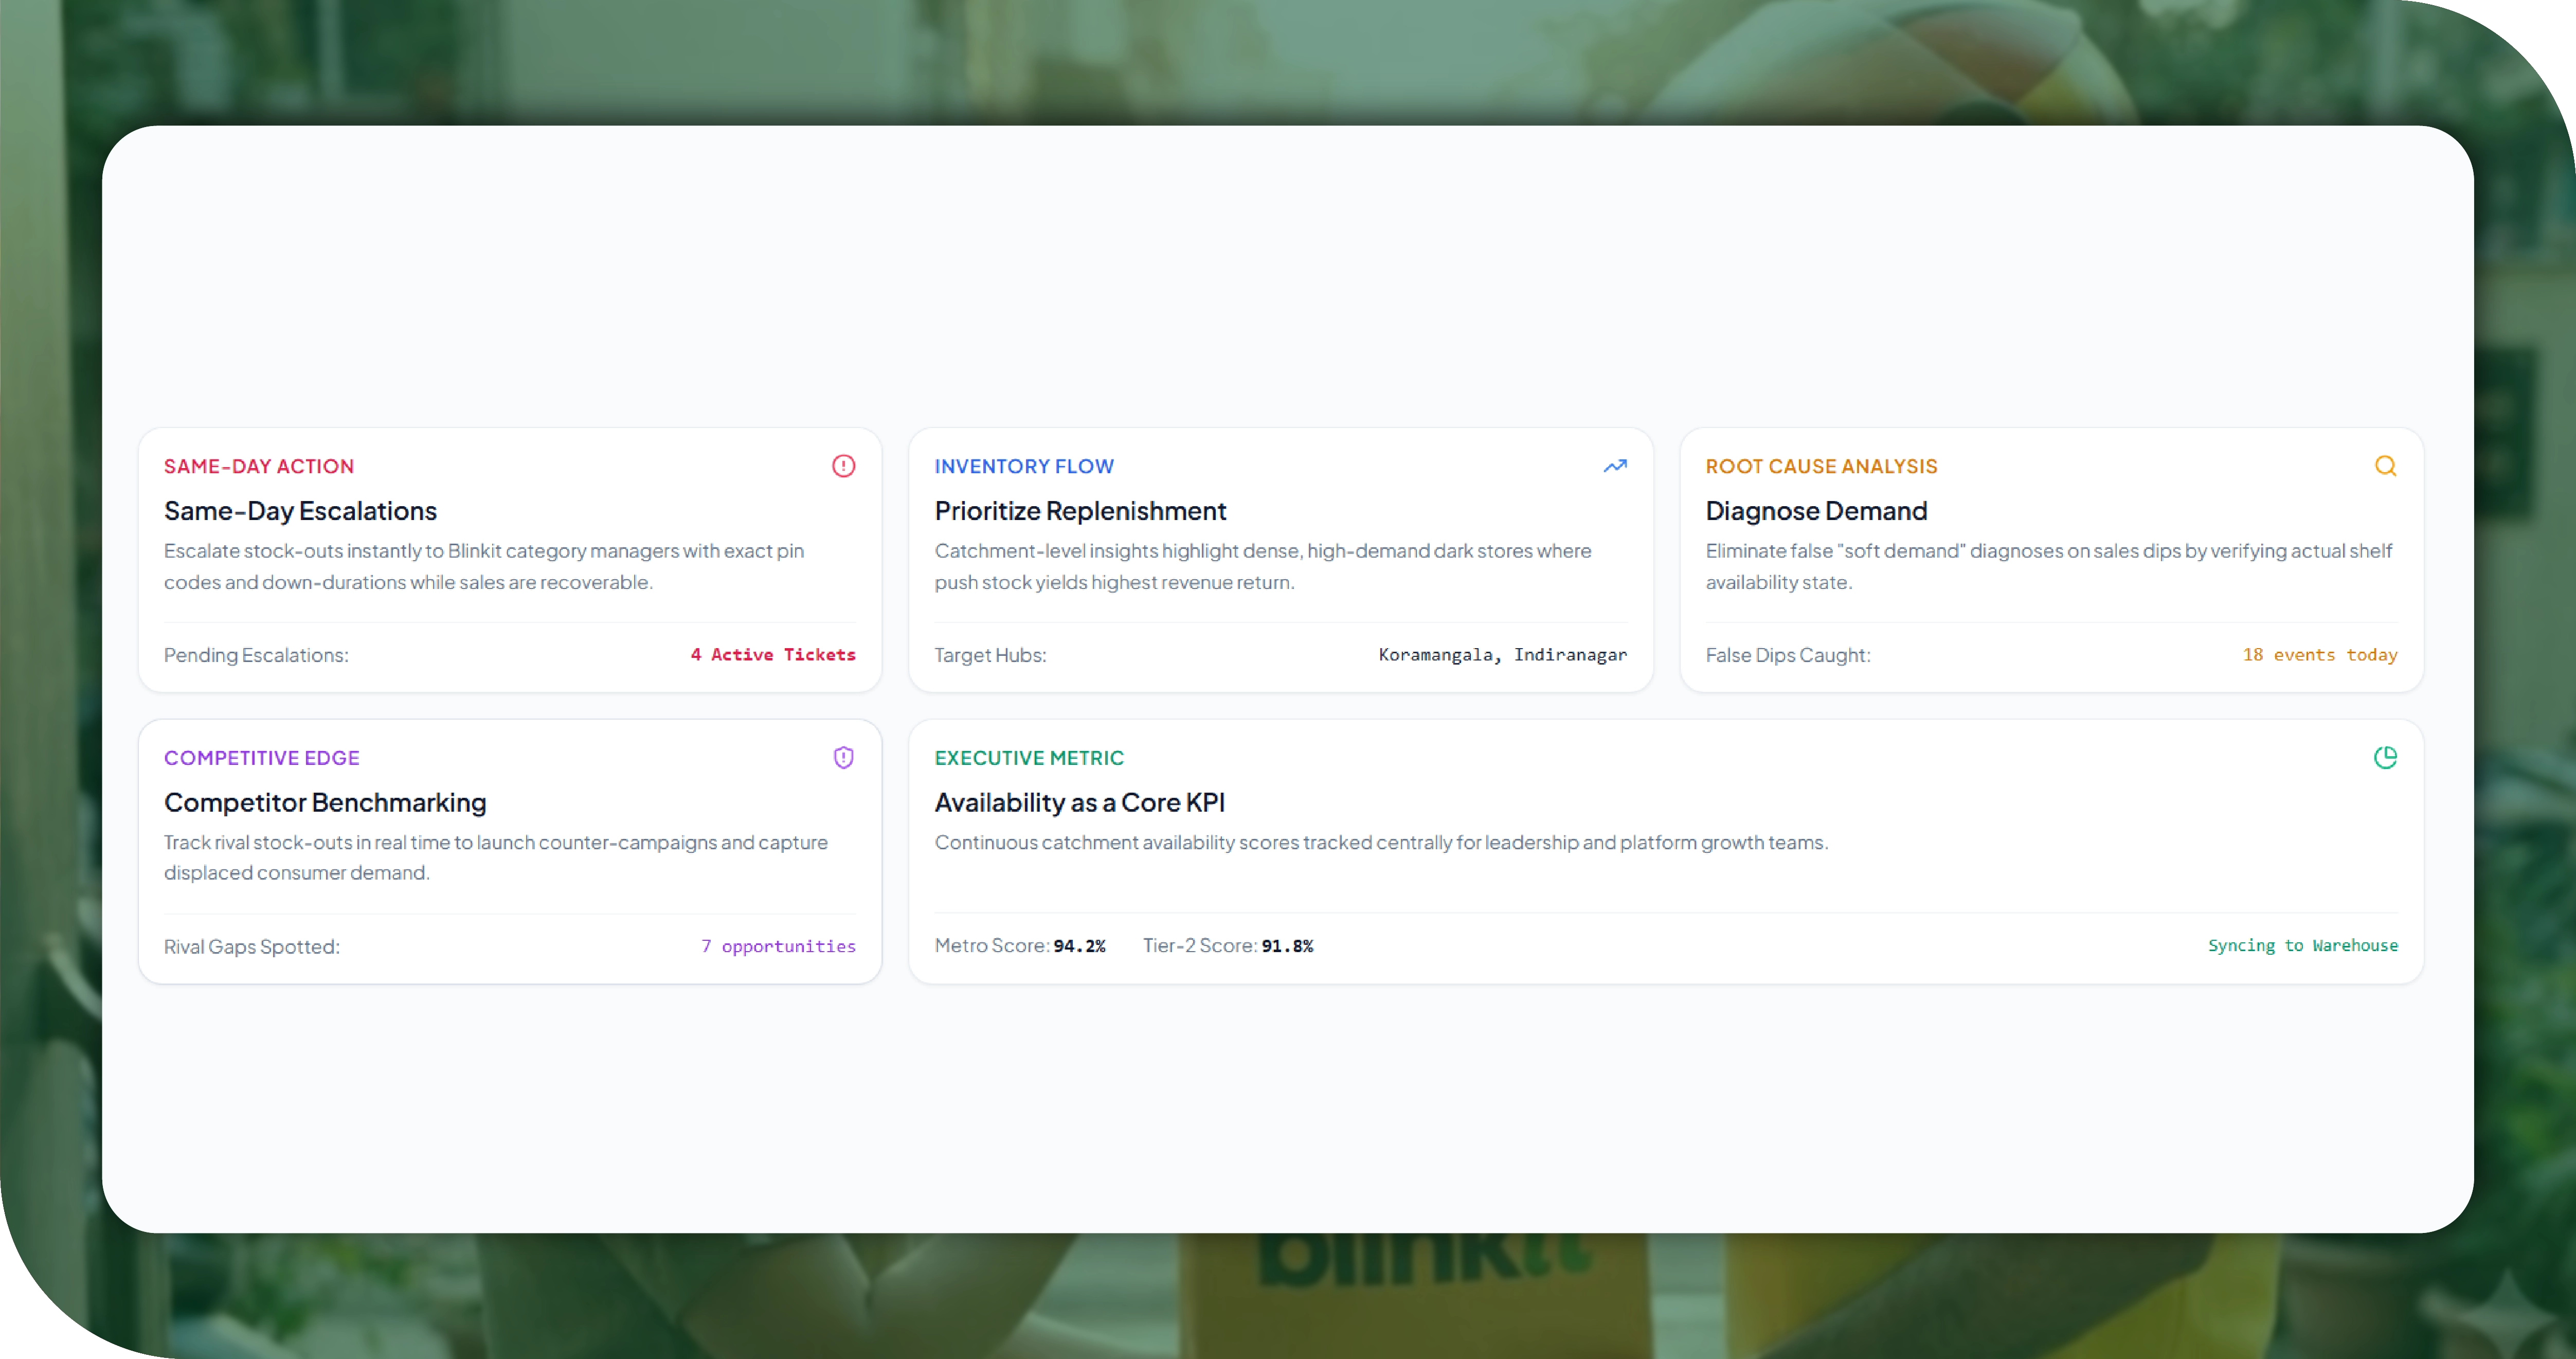
- Escalate stock-outs the same day. Instead of discovering a gap weeks later, the team escalates to Blinkit category managers with exact pin codes and durations while the sale is still recoverable.
- Prioritise replenishment. Catchment-level data shows which dark stores to push stock into first — the dense, high-demand zones where a stock-out costs the most.
- Diagnose demand correctly. A sales dip is no longer mislabelled "soft demand" when the availability data shows the shelf was simply empty.
- Benchmark against competitors. Tracking competitor availability shows when a rival's stock-out is an opportunity to capture demand.
- Report availability as a KPI. Availability score per catchment becomes a tracked metric that leadership and platform teams can act on.
The FoodDataScrape Availability Data Model
- Product identity: SKU name, brand, normalized name, category, pack size, variant
- Geography: city, pin code, dark store catchment
- Availability: in-stock or out-of-stock status, went-OOS timestamp, back-in-stock timestamp, stock-out duration, availability score
- Context: selling price and category rank when listed, so availability is read alongside position
- Competitive: competitor SKU availability in the same catchment, for opportunity detection
- Alerting: stock-out and restock events pushed via webhook, Slack or email
Delivered via live dashboard, webhook alerts, API, or scheduled files into BigQuery, Snowflake or flat storage, at a refresh cadence matched to how fast availability moves.
Methodology and Compliance
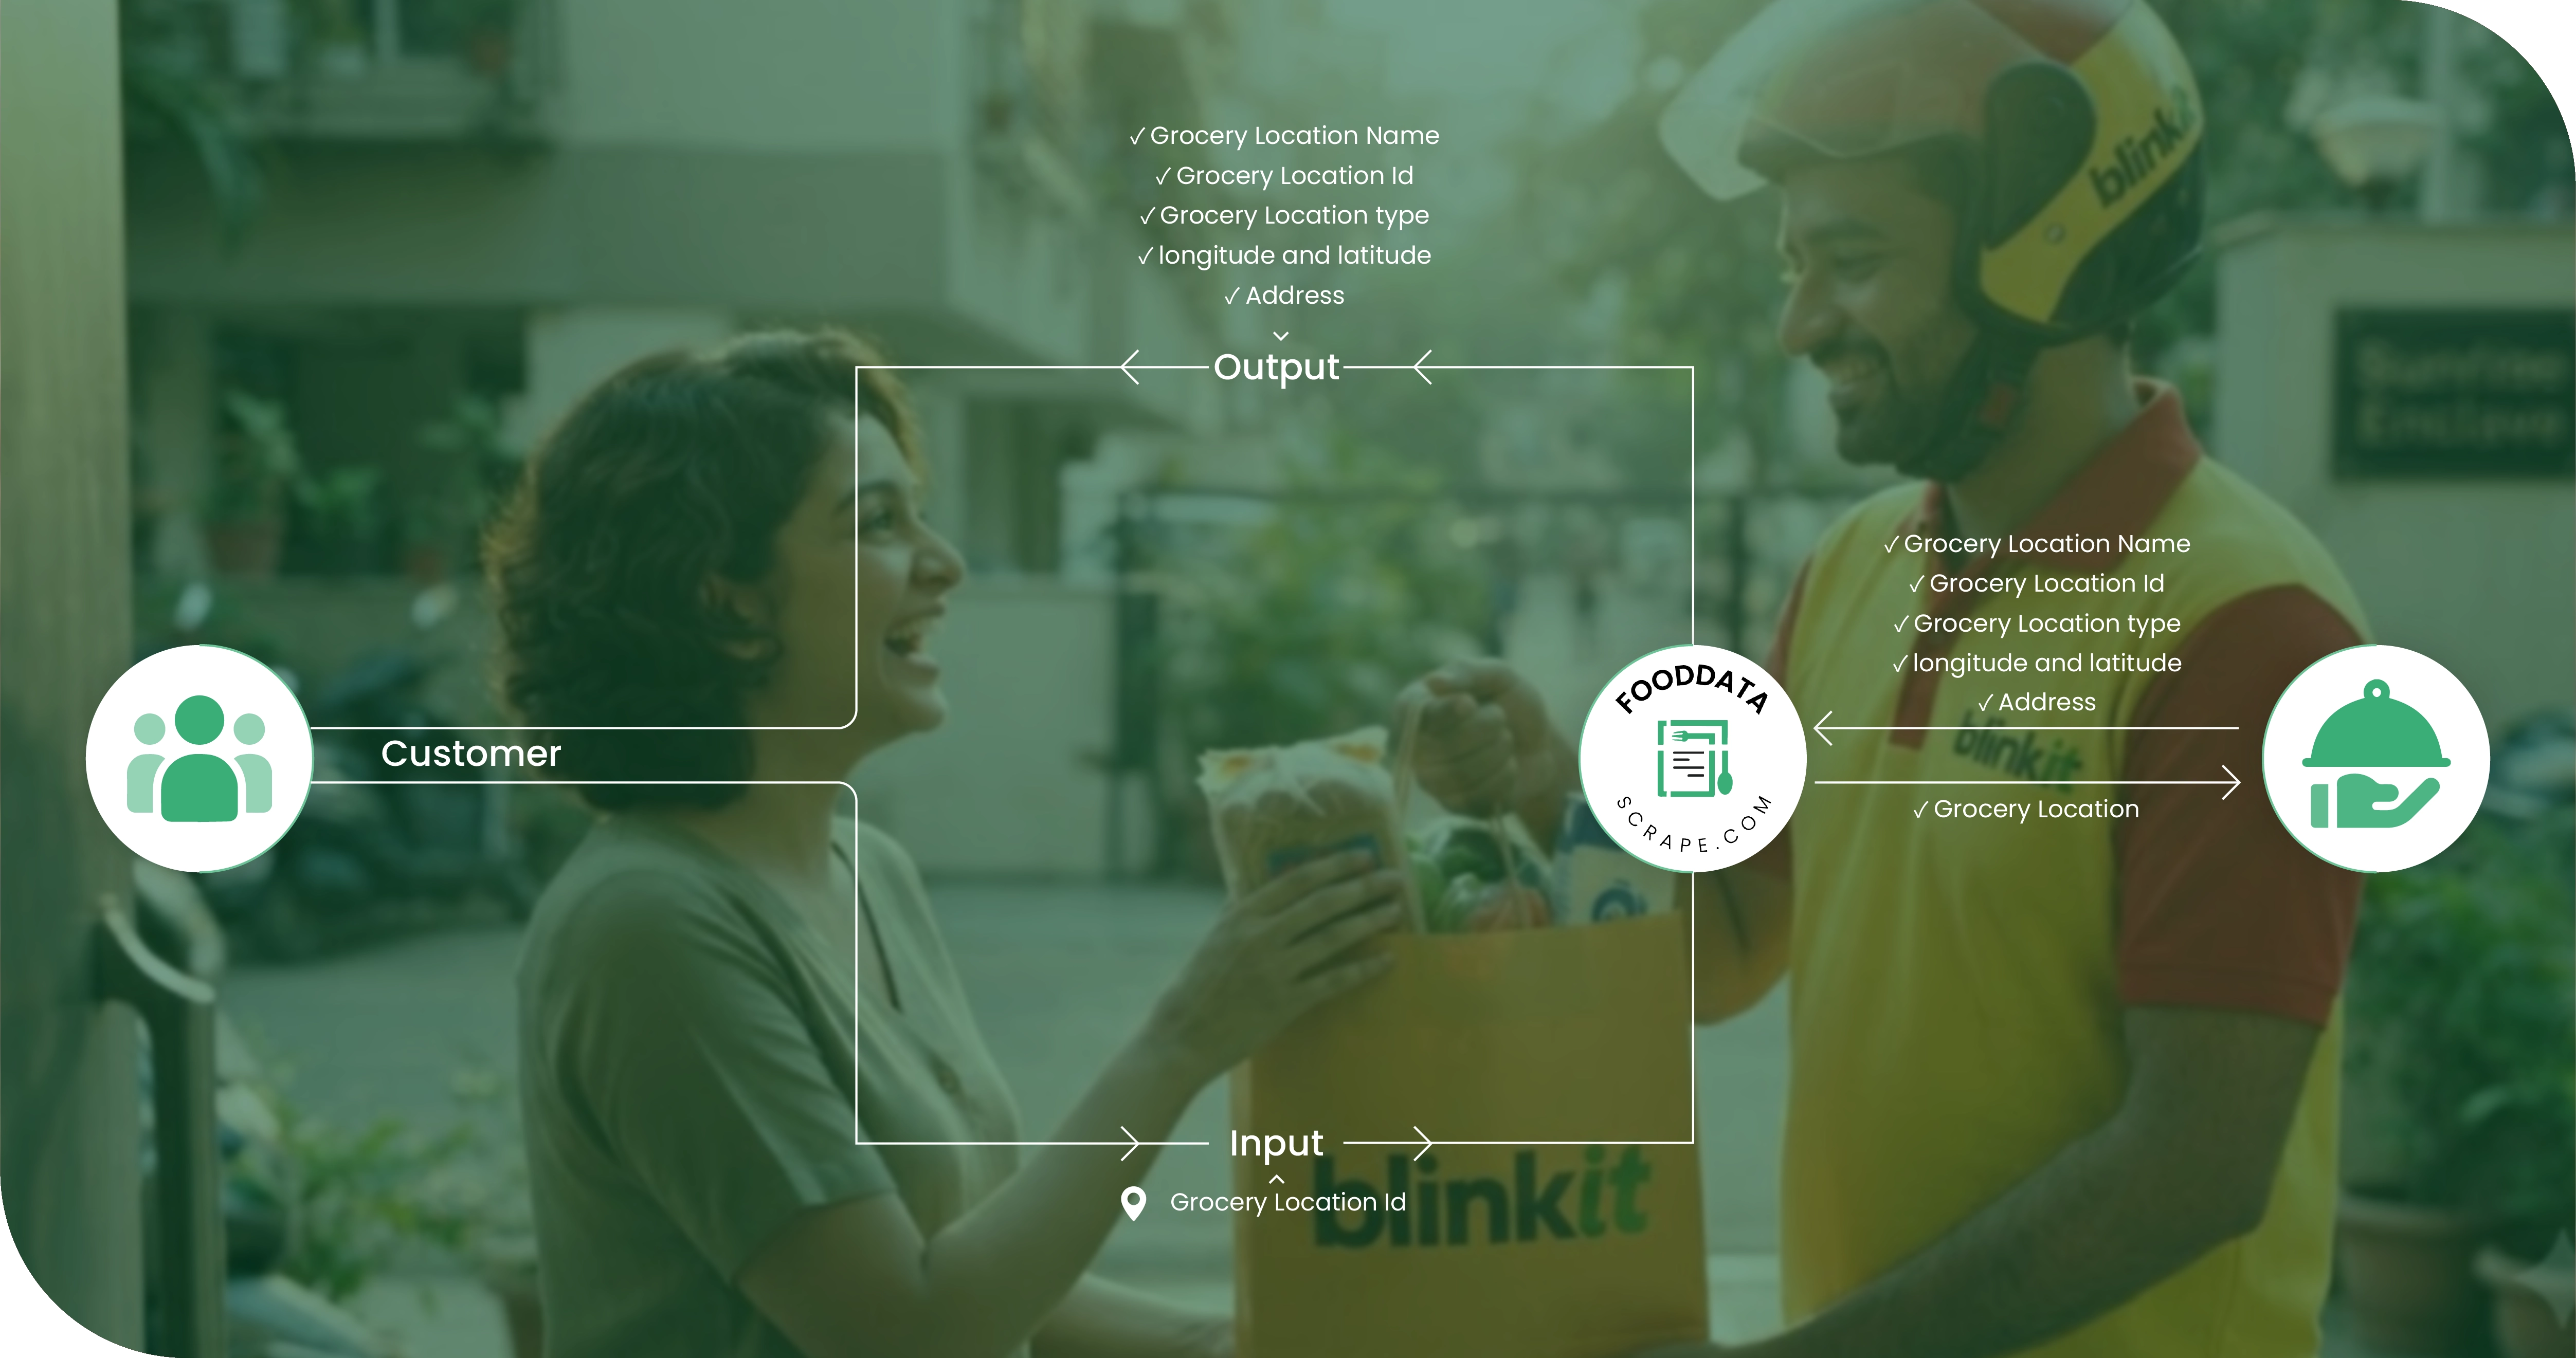
- We collect publicly accessible catalog and availability information only. No authenticated content, no private data, no personal consumer data.
- Collection is at the pin-code and catchment level, because availability varies between adjacent dark stores and a citywide view hides it.
- Stock-out events are timestamped and measured, so exposure is quantified in minutes rather than merely flagged.
- Products are normalized so the same SKU resolves to a single entity across catchments.
- Crawlers are rate-limited and engineered not to degrade the platform, with collection frequency matched to genuine need.
Conclusion
On Blinkit, availability is revenue, and a stock-out is a sale walking out the door in real time — silent, local, and invisible from inside the app until it surfaces as an unexplained dip weeks later. In a market where the next option is one tap away, the brands that win are the ones that know their shelf is empty before the shopper does.
Blinkit Stock Availability Monitoring gives brands that knowledge: pin-code level stock-out detection, measured in minutes, with alerts that land while the sale is still recoverable and evidence that turns a platform conversation from anecdote into fact.
FoodDataScrape crawls 220M+ pages of food and grocery data every week so that you find out about a dark-store stock-out within the hour, not at the end of the month.



