
Introduction
Canada's grocery market in 2026 is becoming increasingly data-driven as consumers, retailers, brands, and analysts compare prices across supermarkets, online grocery platforms, cities, and provinces. Canada Grocery Price Comparison 2026 helps businesses understand how everyday product prices differ across retailers, locations, pack sizes, promotions, and shopping channels.
Retailers can Scrape Canada Grocery Price Data to build structured datasets covering product names, brands, categories, prices, unit prices, pack sizes, availability, and promotional offers. Such information can support pricing intelligence, assortment planning, competitor benchmarking, and market research.
At the same time, Grocery Discount Data Extraction In Canada can reveal how retailers use weekly promotions, loyalty offers, multi-buy deals, digital coupons, and temporary markdowns to attract price-sensitive shoppers.
The value of grocery data extends beyond simply recording product prices. Businesses can analyze how prices change over time, identify regional variations, monitor promotional intensity, and understand where competitive gaps exist.
Why Canada Grocery Price Comparison Matters in 2026?
Canada has a diverse grocery retail landscape, with national chains, regional supermarkets, discount retailers, warehouse clubs, specialty stores, and online grocery services competing for consumers.
Prices can vary significantly depending on:
- Province and city
- Retailer format
- Product category
- Brand
- Pack size
- Promotional period
- Loyalty membership
- Online versus in-store availability
- Local competitive conditions
- Seasonal demand
For example, a household shopping for milk, eggs, cereal, coffee, vegetables, frozen foods, snacks, and household essentials may encounter different prices across multiple retailers.
A structured grocery price dataset makes these differences measurable.
Instead of manually checking dozens of websites, businesses can collect product-level information systematically and compare thousands of SKUs across multiple retailers.
Building a Canada Grocery Price Comparison Dataset
A comprehensive grocery comparison dataset can contain multiple dimensions for every product.
Typical fields may include:
| Data Field | Example Information |
|---|---|
| Product Name | Product title |
| Brand | National or private-label brand |
| Category | Dairy, bakery, beverages, snacks, etc. |
| Pack Size | 500 g, 1 L, 12-pack, etc. |
| Listed Price | Current selling price |
| Unit Price | Price per 100 g, litre, etc. |
| Discount | Promotional reduction |
| Regular Price | Price before promotion |
| Availability | In stock, unavailable, limited |
| Retailer | Grocery chain or marketplace |
| Location | City, province, postal region |
| Collection Date | Date and time of capture |
This structure enables historical analysis rather than one-time price checking.
Businesses can examine whether a product has become more expensive, whether competitors have introduced deeper discounts, and whether pricing differences are persistent or temporary.
Competitive Grocery Pricing Across Canada
Grocery Competitor Pricing Data Scraping In Canada allows retailers and brands to systematically monitor competitors.
Competitive pricing intelligence can cover products such as:
- Milk
- Eggs
- Butter
- Cheese
- Bread
- Rice
- Pasta
- Coffee
- Tea
- Meat
- Seafood
- Fresh produce
- Frozen foods
- Snacks
- Soft drinks
- Baby products
- Personal care
- Household essentials
A retailer can compare its own prices with competing supermarkets and identify products where its prices are above, below, or broadly aligned with the market.
The objective is not simply to offer the lowest price on every SKU. Instead, businesses can determine where price positioning matters most and where promotional activity could influence purchasing behavior.
Understanding Quebec Grocery Pricing
Regional analysis is particularly important in a country as geographically diverse as Canada.
Quebec Supermarket Pricing Data can provide a detailed view of grocery pricing across cities and supermarket locations in the province.
Quebec may require separate analysis because retailers, consumer preferences, product assortments, promotions, and local market conditions can differ from other Canadian regions.
A regional dataset can compare grocery prices across locations such as Montreal, Quebec City, Laval, Gatineau, Longueuil, Sherbrooke, Trois-Rivières, and other markets.
Businesses can examine:
- Average category prices
- Brand-level price differences
- Private-label pricing
- Promotional frequency
- Discount depth
- Product availability
- Unit-price differences
- Regional assortment
This creates a stronger foundation for location-specific pricing strategies.
Canadian Grocery Market Intelligence
Canadian Grocery Market Intelligence combines pricing, product, promotional, availability, and retailer information to provide a broader understanding of the market.
Price alone does not always explain competitive positioning.
Suppose one retailer sells a product for CAD 4.99 while another sells it for CAD 5.49. The difference becomes more meaningful when businesses also know the pack size, unit price, promotional status, loyalty conditions, and availability.
Market intelligence can therefore combine several datasets into one analytical framework.
Businesses can identify:
- Price leaders by category
- Frequently discounted products
- Private-label opportunities
- Regional price variations
- Promotional patterns
- Assortment gaps
- Emerging pricing trends
Tracking Quebec Grocery Chains
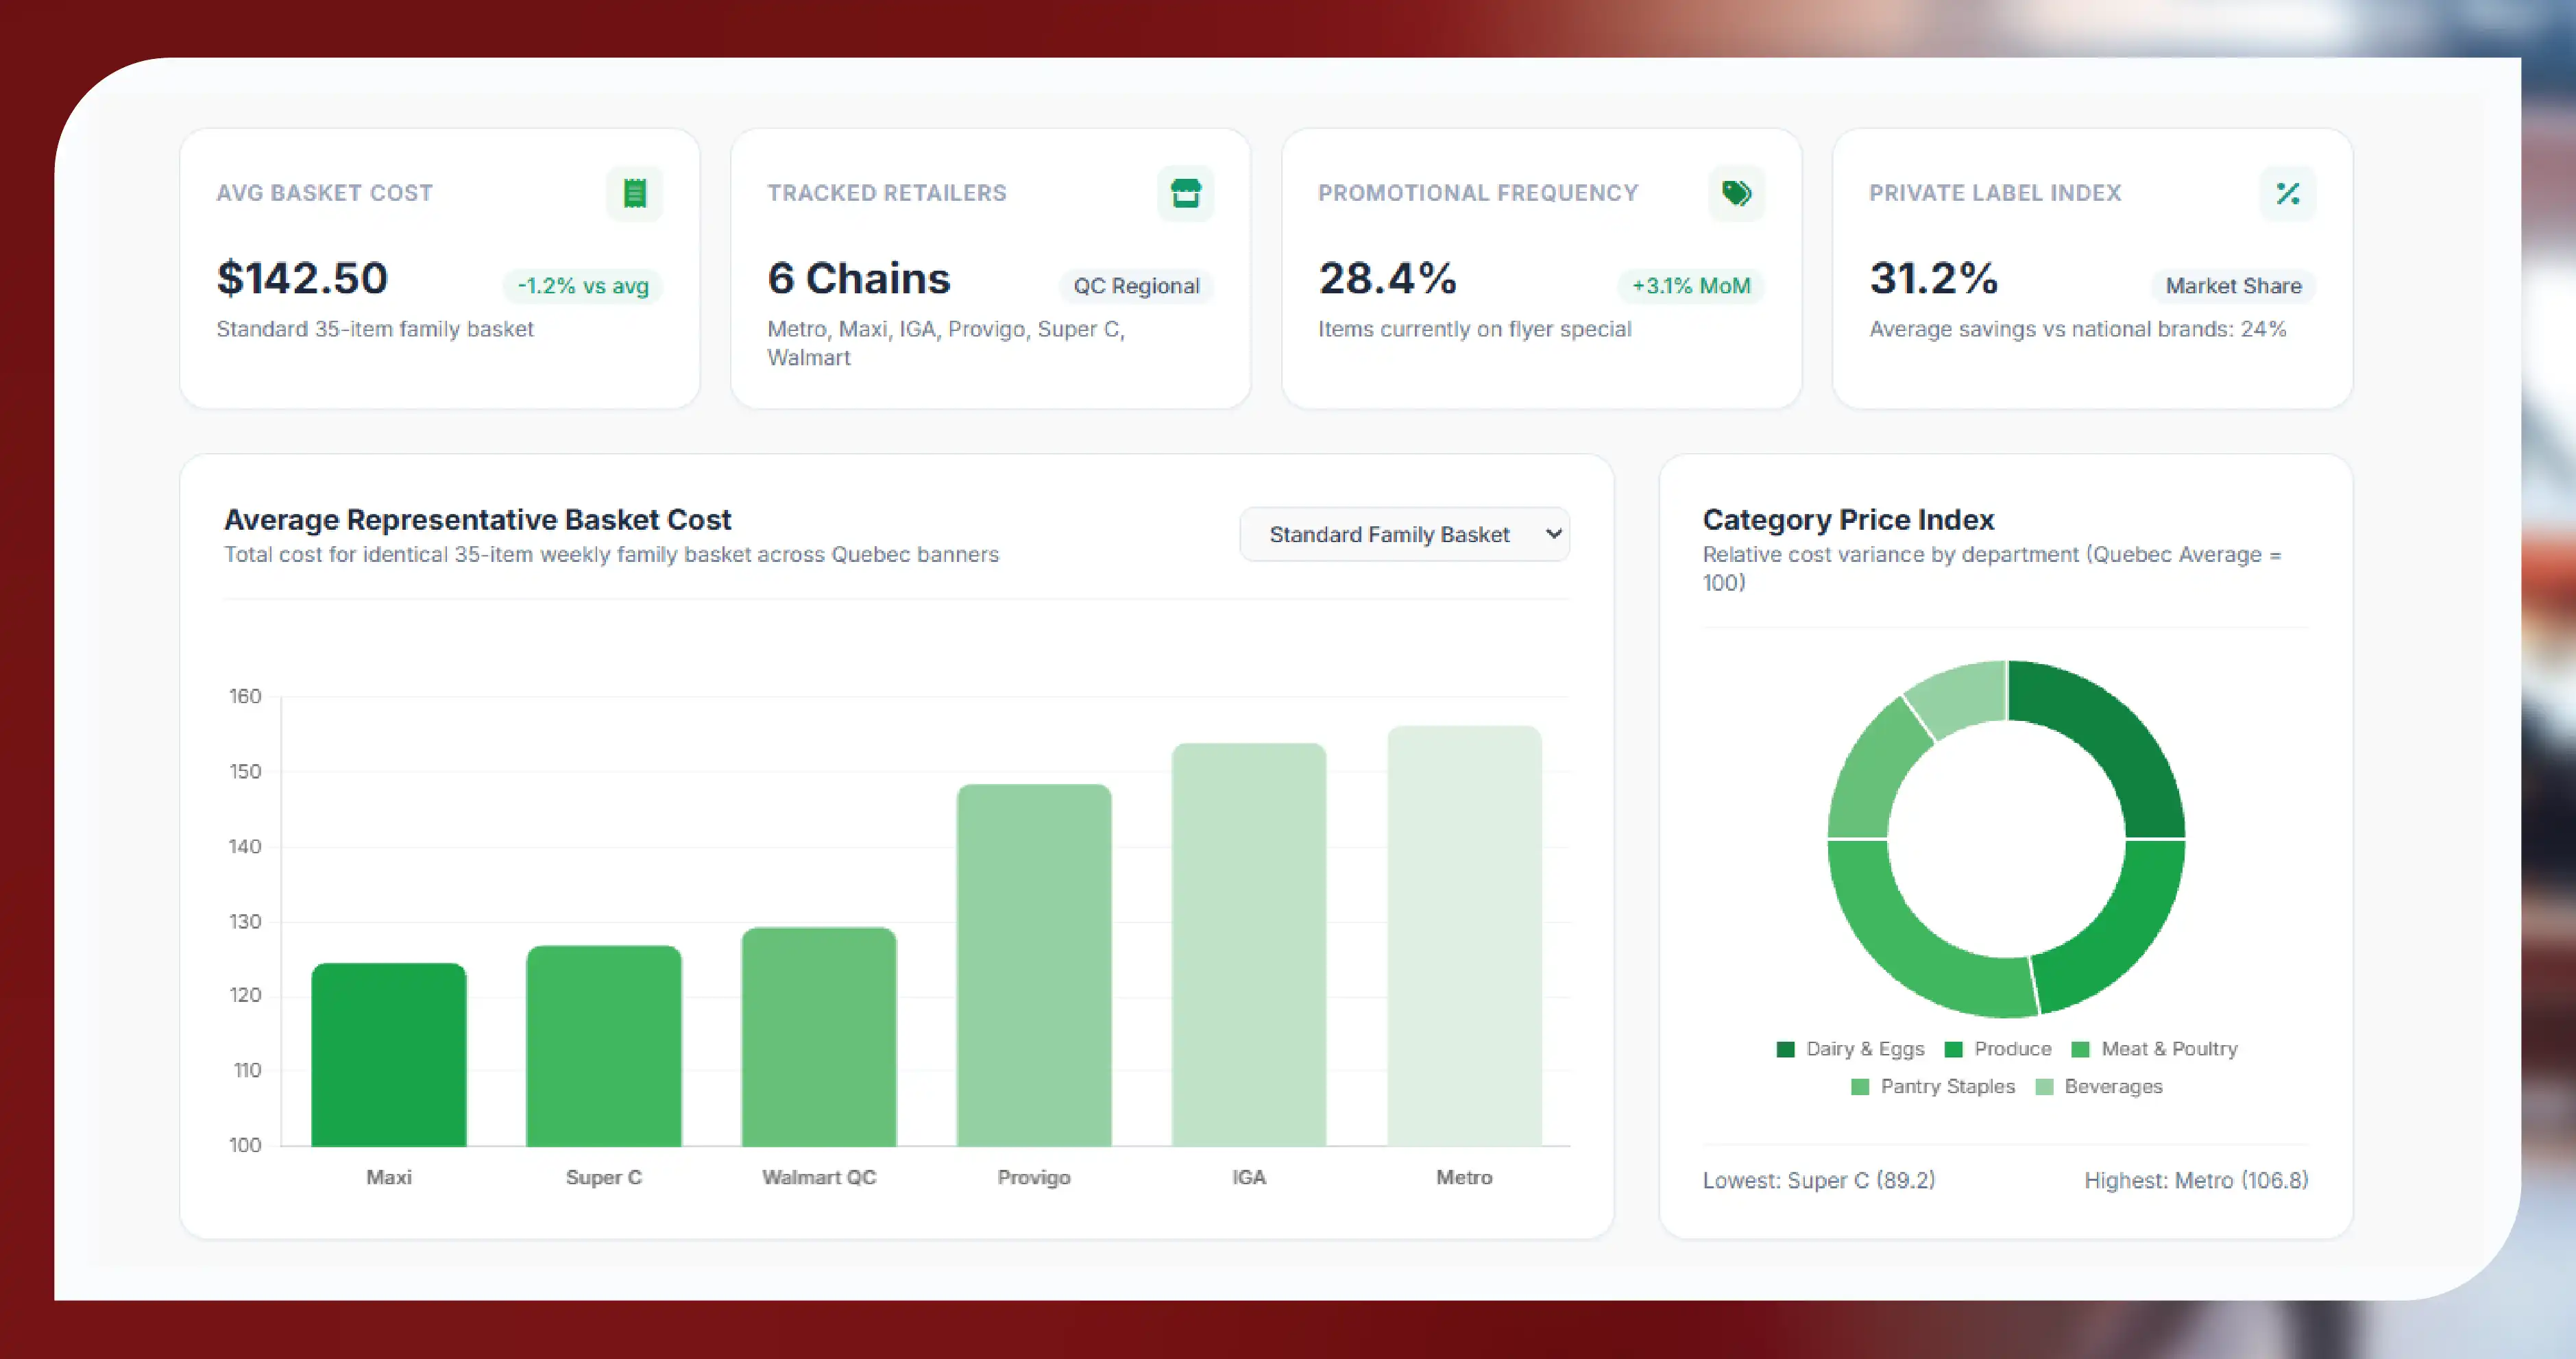
Businesses interested specifically in regional retail can Extract Top Quebec Grocery Chains Price Data and compare product-level pricing across selected retailers.
A retailer-by-retailer dataset can help identify differences in:
- Average basket costs
- Product-level pricing
- Category pricing
- Promotional frequency
- Private-label prices
- Brand availability
- Unit prices
- Discount depth
Basket-level analysis can be especially valuable.
Rather than examining individual products independently, analysts can construct representative shopping baskets containing commonly purchased grocery items and compare their total costs across retailers.
This provides a practical way to understand overall price positioning.
Monitoring Grocery Discounts and Promotions
Promotions can substantially influence grocery purchasing decisions.
Retailers may use temporary discounts, loyalty pricing, digital coupons, bundle promotions, clearance offers, and multi-unit deals.
Tracking these offers over time allows businesses to understand promotional behavior.
For instance, an analyst can measure:
- Discount frequency by retailer
- Average discount percentage
- Products receiving repeated promotions
- Duration of promotions
- Category-level promotional intensity
- Differences between regular and promotional prices
- Seasonal discount patterns
This information can also help brands understand how retailers position their products during major shopping periods.
Grocery Price Monitoring Data for Real-Time Intelligence
Grocery Price Monitoring Data becomes more valuable when collected regularly instead of periodically.
A daily or frequent collection process can reveal changes that a monthly snapshot may miss.
For example, a retailer might change the price of a product several times within a month. A historical monitoring system can record each movement and establish a timeline.
Businesses can then calculate:
- Price change frequency
- Average selling price
- Minimum and maximum observed price
- Promotional duration
- Price volatility
- Competitor price gap
- Category-level movements
Historical datasets can also support dashboards that display pricing trends by retailer, product, province, category, and date.
Unlock smarter retail decisions with real-time Canada Grocery Price Comparison 2026 data—contact Food Data Scrape today for tailored grocery intelligence solutions.
From Manual Research to Automated Data Collection
Manual grocery price comparison becomes increasingly difficult as the number of retailers and products increases.
Grocery Data Scraping Services can automate the collection, normalization, and organization of large volumes of grocery information.
A scalable workflow can include:
- Source Identification: Select relevant grocery websites, apps, and digital storefronts.
- Data Extraction: Collect product names, prices, discounts, pack sizes, availability, and other fields.
- Data Cleaning: Standardize product names, units, brands, categories, and price formats.
- Product Matching: Match equivalent products across different retailers.
- Historical Storage: Maintain dated records for longitudinal analysis.
- Delivery: Provide structured data through CSV, JSON, databases, dashboards, or APIs.
This approach reduces repetitive manual work and supports more frequent competitive monitoring.
Product Matching and Unit Price Normalization
One of the biggest challenges in grocery comparison is ensuring that products are genuinely comparable.
A 500 g cereal box should not be directly compared with a 750 g box simply because their listed prices appear different.
Unit-price normalization can solve this problem.
Businesses can compare products based on measurements such as:
- Price per 100 g
- Price per kilogram
- Price per litre
- Price per unit
- Price per serving
This creates a more meaningful comparison between different pack sizes.
Product matching can also account for brand, flavor, variant, size, packaging, and product attributes.
Grocery Delivery and Digital Commerce
Online grocery shopping has created another important source of competitive data.
Delivery platforms can expose product catalogs, prices, promotions, delivery fees, availability, and estimated delivery information.
A Grocery Delivery Scraping API can help businesses access structured grocery information programmatically and integrate it into internal analytics systems.
Such data can support:
- Price comparison platforms
- Grocery analytics dashboards
- Retail intelligence systems
- Consumer applications
- Competitive monitoring tools
- Brand intelligence platforms
- Market research systems
The API approach also makes it easier to connect grocery intelligence with existing business applications.
How Food Data Scrape Can Help You?
1. Competitive Price Tracking
Food Data Scrape can collect grocery prices across Canadian retailers, helping businesses compare product-level pricing, identify price gaps, and monitor competitor movements consistently.
2. Regional Grocery Intelligence
It can organize grocery information by province, city, and retailer, enabling businesses to investigate regional pricing differences and develop location-specific competitive intelligence strategies.
3. Promotional Monitoring
Food Data Scrape can capture discounts, promotions, regular prices, and sale prices, allowing businesses to measure promotional intensity and identify recurring retail pricing patterns.
4. Product-Level Market Analysis
Businesses can analyze brands, categories, pack sizes, availability, and unit prices to understand assortment structures and identify opportunities for pricing and merchandising optimization.
5. Historical Price Intelligence
Regularly collected datasets create historical records that businesses can use to analyze price movements, promotional cycles, competitive changes, and evolving grocery market conditions.
Conclusion
Canada's grocery sector presents a large and constantly changing pricing environment where product-level intelligence can support better commercial decision-making.
From supermarket prices and promotional offers to regional differences and online grocery availability, structured data enables businesses to move beyond occasional manual price checks.
Grocery Delivery Scraping API solutions can provide scalable access to grocery information for applications, dashboards, analytics platforms, and market intelligence systems.
Meanwhile, Grocery Price Comparison App Data Scraping can help comparison platforms collect and organize product-level information from multiple grocery sources for consumer-facing price discovery.
Finally, Grocery Discount Analysis Data can help businesses examine promotional depth, frequency, duration, and category-level discount behavior.
With consistent data collection, normalization, historical tracking, and competitive analysis, grocery businesses can develop a clearer understanding of Canadian pricing dynamics throughout 2026 and beyond.
Are you in need of high-class scraping services? Food Data Scrape should be your first point of call. We are undoubtedly the best in Food Data Aggregator and Mobile Grocery App Scraping service and we render impeccable data insights and analytics for strategic decision-making. With a legacy of excellence as our backbone, we help companies become data-driven, fueling their development. Please take advantage of our tailored solutions that will add value to your business. Contact us today to unlock the value of your data.
Get a Free Food Data Sample in 48 Hours.
Tell us your platforms, target markets and required fields — we'll map exactly what's possible with food data scraping, recommend the right approach, and send a working sample so you can verify quality before any commitment.
Request a strategy call
Thanks — our data team will reach out within 48 hours with your sample.



