
Introduction
The food delivery market did not simply grow — it restructured itself. Behind the familiar logos on Swiggy, Zomato, Uber Eats, DoorDash, Talabat and Deliveroo sits an operating layer most consumers never see: the cloud kitchen. One physical facility, sometimes fifteen or twenty separate brand identities, a single fryer bank, and a routing system engineered for the ten-minute pickup window rather than the ninety-minute dine-in experience.
That restructuring is now measurable. Analysts consistently size the global cloud kitchen and delivery-native food segment in the vicinity of USD 117 billion heading into 2026, growing at a pace that outstrips traditional foodservice by a wide margin. Yet the number itself is the least interesting part of the story. The interesting part is that almost none of it is visible through conventional market research, because cloud kitchens do not publish store counts, do not file location disclosures, and deliberately obscure the relationship between the brand a consumer orders from and the kitchen that actually cooks the food.
This is exactly the gap that Cloud Kitchen Data Scraping closes. At FoodDataScrape , we crawl more than 220 million pages of food data every week across delivery aggregators, restaurant sites, review platforms and menu APIs, and we reconstruct the hidden architecture of the delivery economy from the outside in. This article explains what that architecture looks like in 2026, how the economics have shifted, and what an actual extracted dataset reveals about operators such as Rebel Foods, Kitopi, REEF and the 200-plus multi-brand players now competing for the same delivery radius.
Why the $117B Number Is Structurally Different From Restaurant Revenue
Traditional restaurant revenue is anchored to real estate. A dine-in restaurant's addressable demand is bounded by how many people will physically travel to it. Cloud kitchen revenue is anchored to delivery radius density— how many orders can be fulfilled profitably within a three-to-five kilometre polygon.
That single change has three downstream effects that data makes visible:
Cloud kitchen market analysis that relies on press releases and investor decks will miss all three. Only continuous virtual brand data extraction from live delivery platforms captures them.
- Brand count decouples from location count. A single 1,800 sq ft facility can host twelve brands. Store-count-based market models systematically undercount capacity.
- Menu velocity increases sharply. Delivery-native brands launch, test and retire menu items in weeks, not seasons. Static menu research is obsolete within a month.
- Pricing becomes hyperlocal and dynamic. The same SKU carries different prices across pin codes, platforms and hours of the day.
The Operator Landscape in 2026
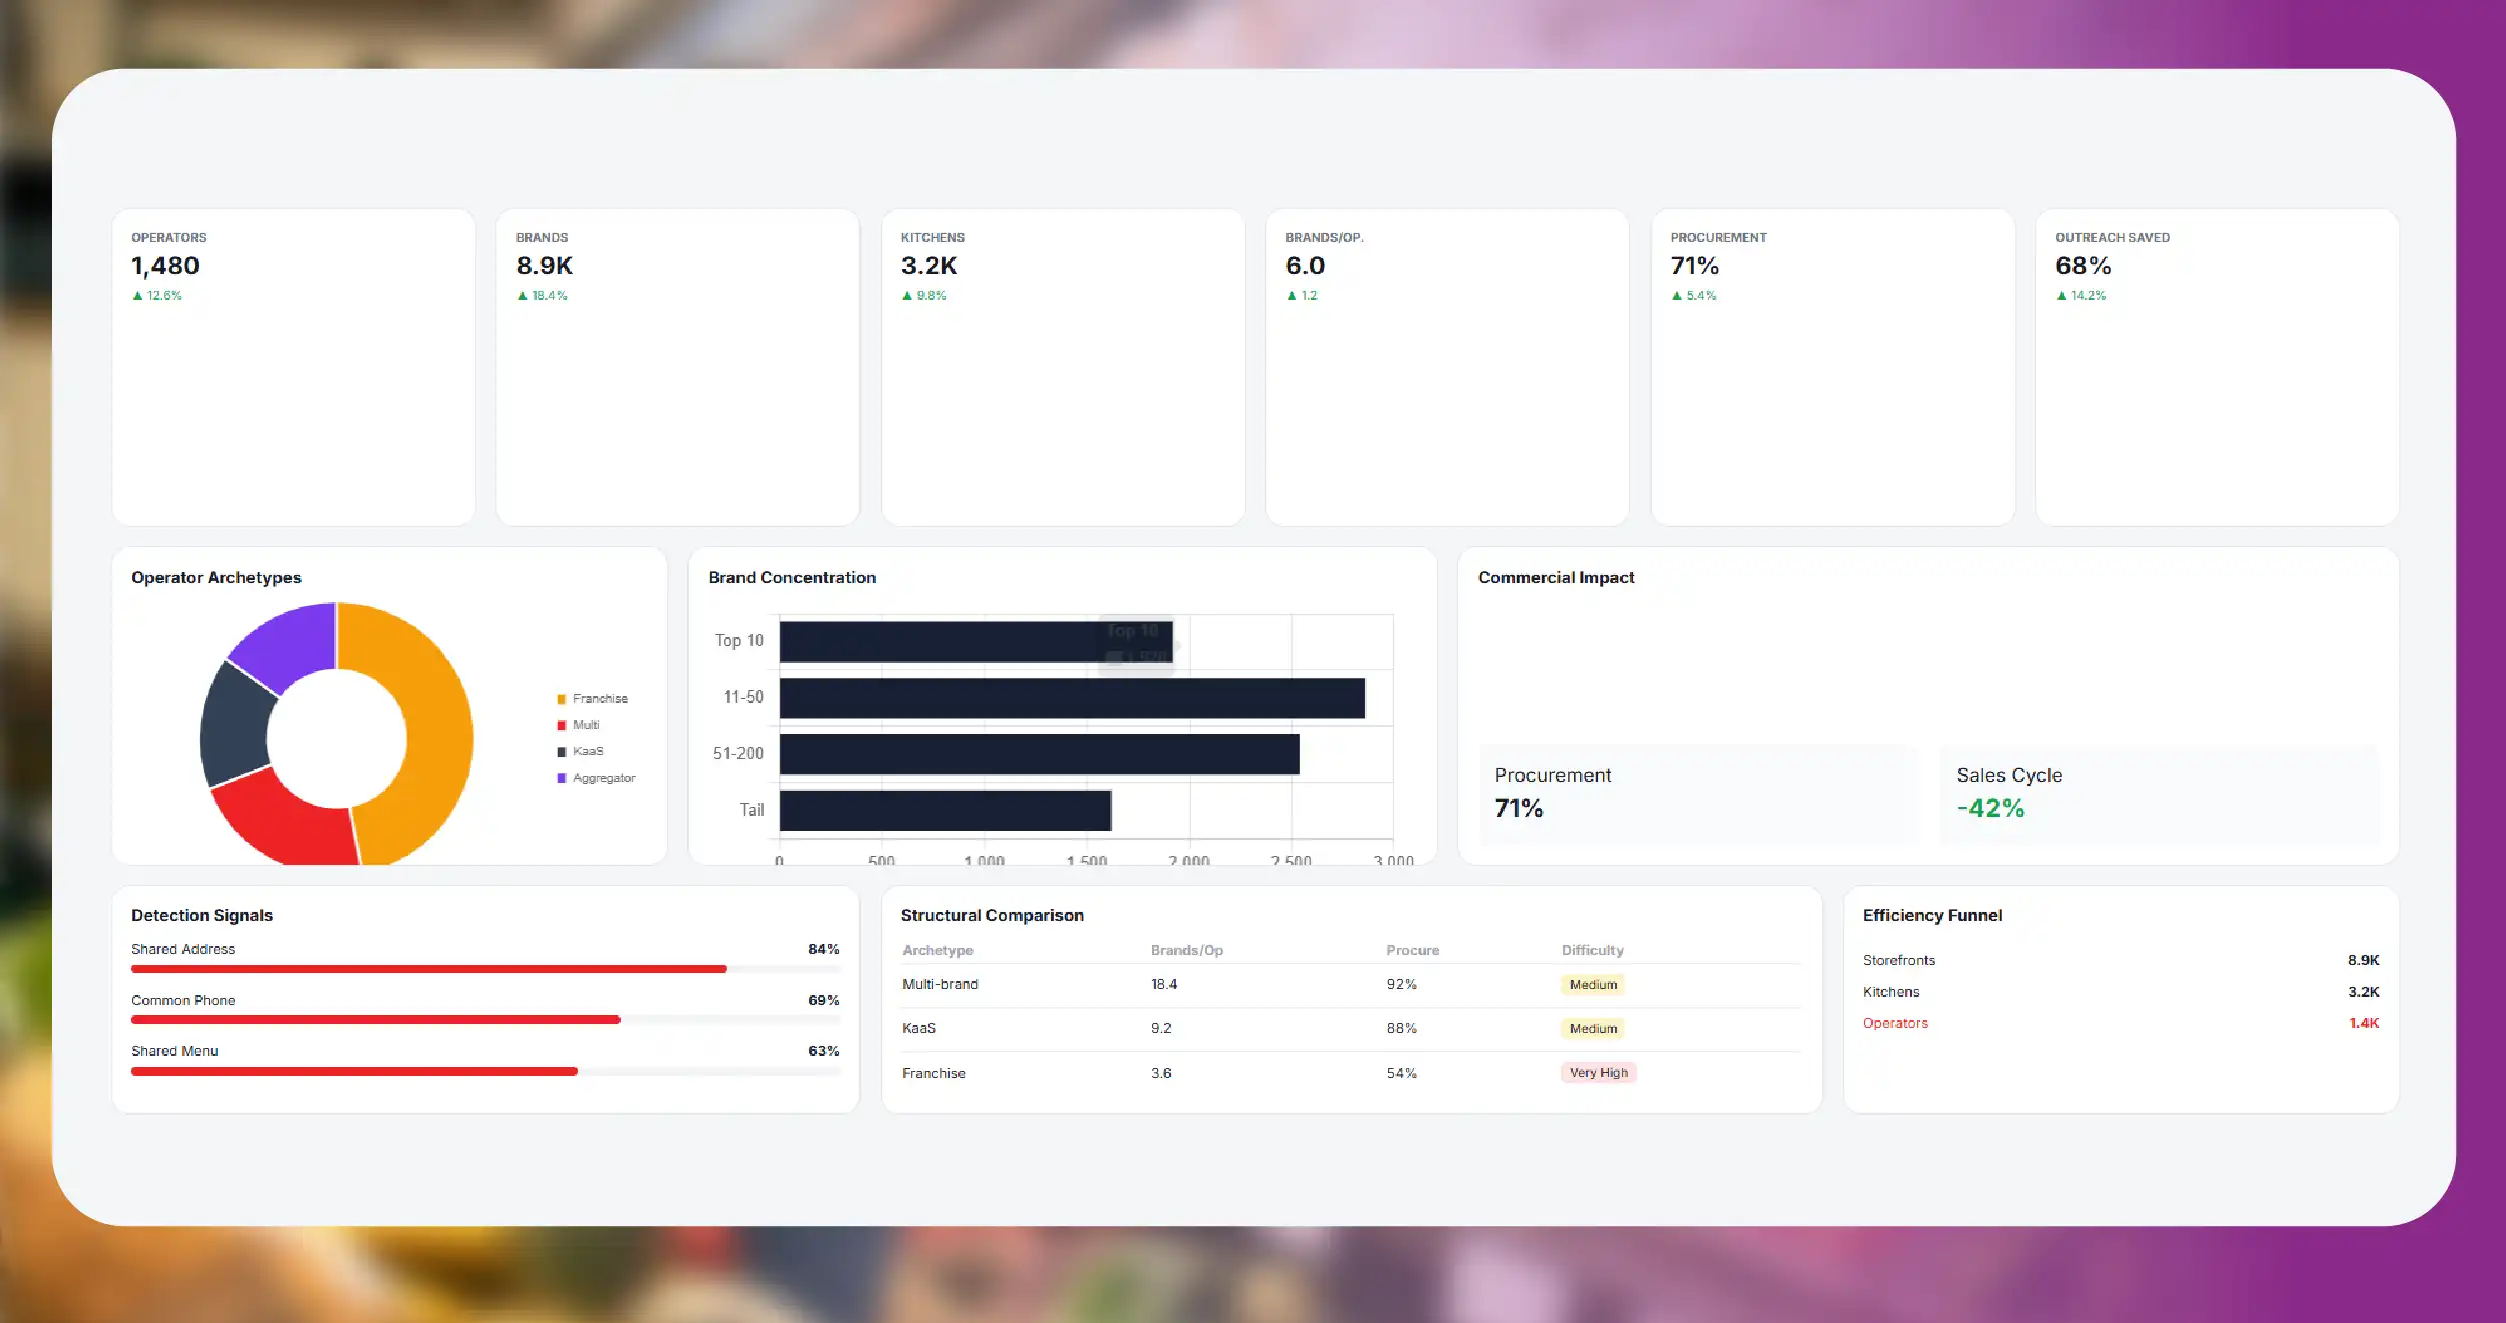
Our crawls consistently identify four structural archetypes in the cloud kitchen ecosystem:
Multi-brand operators. Rebel Foods is the canonical example — a single kitchen network fronting dozens of consumer brands, each targeting a distinct cuisine, price band and occasion. The operating logic is shared infrastructure, differentiated storefronts.
Kitchen-as-a-service platforms. Kitopi and comparable players in the Gulf and Southeast Asia operate the physical kitchen and manufacturing layer while partner brands supply the demand. The brand on the app may have no operational involvement in the cooking.
Asset-light delivery-only franchises. Operators who license a virtual brand into an existing restaurant's idle kitchen capacity. This is the fastest-growing segment by brand count and the hardest to detect, because the kitchen is a licensed dine-in restaurant.
Aggregator-owned or aggregator-adjacent kitchens. Platform-operated facilities designed to fill supply gaps in under-served delivery polygons.
The commercial consequence is significant. If you are a CPG brand, a distributor, an equipment supplier or an investor, the addressable customer is the operator, not the storefront. Selling to twelve brands that share one procurement desk means eleven wasted outreach cycles. Multi-brand operator detection through data is therefore not an analytics luxury — it is a direct sales efficiency lever.
How the Unit Economics Have Been Rewritten
Cloud kitchens changed the cost structure of a meal. The table below reflects the directional economics we observe when reconstructing menu prices, platform commissions, packaging patterns and promotional depth from public delivery data across major metros.
| Cost Component | Traditional Dine-In Restaurant | Cloud Kitchen Operator (2026) |
|---|---|---|
| Rent as % of revenue | 12–18% | 4–8% |
| Front-of-house labour | 15–22% | 0–2% |
| Kitchen labour | 12–16% | 14–20% |
| Platform commission | 0–8% (partial delivery) | 18–30% |
| Packaging | 1–2% | 5–9% |
| Marketing / platform ads | 3–6% | 8–15% |
| Contribution margin | 8–15% | 10–22% (brand-dependent) |
The headline insight: cloud kitchens did not simply become cheaper. They traded fixed real-estate cost for variable platform cost. That trade is only profitable at high order density, which is why operators stack multiple brands into a single kitchen — the brands share the fixed cost while each one buys incremental demand.
This is why menu and pricing data matters so much. Contribution margin in a cloud kitchen is decided at the SKU level, and the SKU-level truth only exists on the delivery platform.
What Cloud Kitchen Data Scraping Actually Reveals
Here is what our extraction pipeline surfaces that is unavailable anywhere else.
Brand-to-kitchen fingerprinting. Multiple brands operating from an identical latitude/longitude, sharing a delivery radius, sharing packaging descriptors, sharing preparation-time bands and often sharing rider pickup notes — these are signatures. When six "independent" brands resolve to the same pickup coordinates and the same operating hours, the network becomes visible.
Menu overlap analysis. Two brands claiming different cuisines but sharing a base gravy, a fryer profile or a dessert SKU are almost always co-produced.
Launch and retirement velocity. Tracking when brands appear and disappear in a pin code reveals which operators are expanding, which are consolidating, and which categories are being abandoned.
Promotional depth and price elasticity. Discount patterns tell you where an operator is buying market share and where it is harvesting margin.
Rating and review drift. Sudden rating collapse across multiple brands sharing a kitchen is an operational failure signal, and often an early indicator of a facility closure.
Sample Data: Virtual Brand Extraction
Below is a representative record from a FoodDataScrape cloud kitchen dataset. Values are illustrative of structure and field coverage, not a live customer extract.
                            {
  "kitchen_id": "FDS-CK-IN-BLR-004821",
  "detected_operator": "Multi-Brand Operator",
  "pickup_latitude": 12.9351,
  "pickup_longitude": 77.6245,
  "city": "Bengaluru",
  "pin_code": "560095",
  "delivery_polygons_served": 7,
  "brands_detected": [
    {
      "brand_name": "Brand A - North Indian",
      "platform": "Swiggy",
      "cuisine": "North Indian",
      "menu_items": 64,
      "avg_price_inr": 289,
      "rating": 4.2,
      "rating_count": 8140,
      "first_seen": "2024-03-11",
      "still_active": true
    },
    {
      "brand_name": "Brand B - Biryani",
      "platform": "Swiggy, Zomato",
      "cuisine": "Biryani",
      "menu_items": 31,
      "avg_price_inr": 349,
      "rating": 4.4,
      "rating_count": 15220,
      "first_seen": "2023-08-02",
      "still_active": true
    },
    {
      "brand_name": "Brand C - Desserts",
      "platform": "Zomato",
      "cuisine": "Desserts",
      "menu_items": 18,
      "avg_price_inr": 179,
      "rating": 3.9,
      "rating_count": 2410,
      "first_seen": "2025-11-19",
      "still_active": true
    }
  ],
  "prep_time_band_minutes": "22-28",
  "operating_hours": "10:30-01:00"
}
The record above is the operationally important one. Three separately branded storefronts, three different cuisines on the app — and a single set of pickup coordinates, a single operating window and a single kitchen actually cooking the food. That is a sales target, an investment finding and a competitive threat, all resolved from one dataset.
Sample Data: Cross-Brand Menu Overlap
| Menu Item (Normalised) | Brand A | Brand B | Brand C | Overlap Signal |
|---|---|---|---|---|
| Butter Chicken (base gravy) | ✔ | ✔ | — | Shared production |
| Dum Biryani (chicken) | ✔ | ✔ | — | Shared production |
| Gulab Jamun (2 pc) | ✔ | — | ✔ | Shared dessert line |
| Paneer Tikka (starter) | ✔ | — | — | Brand-exclusive |
| Chocolate Brownie | — | — | ✔ | Brand-exclusive |
| Packaging: "Sealed tamper-proof box" | ✔ | ✔ | ✔ | Common supplier |
Three brands, three cuisines on the app, one kitchen in reality. That is the core finding that ghost kitchen data insights deliver and that no directory or survey will ever tell you.
Sample Data: Pin-Code-Level Pricing Divergence
Same brand. Same operator. Same city. A 22% price spread on a dessert SKU across three pin codes. Anyone modelling this brand's revenue from a single menu snapshot is wrong by a material margin — and anyone competing with it without this visibility is bidding blind.
| SKU | Pin Code 560095 | Pin Code 560034 | Pin Code 560066 | Spread |
|---|---|---|---|---|
| Chicken Biryani (Regular) | ₹349 | ₹329 | ₹379 | ₹50 (15.2%) |
| Butter Chicken (Half) | ₹289 | ₹289 | ₹319 | ₹30 (10.4%) |
| Veg Combo Meal | ₹249 | ₹229 | ₹259 | ₹30 (13.1%) |
| Gulab Jamun (2 pc) | ₹99 | ₹89 | ₹109 | ₹20 (22.5%) |
Who Uses Cloud Kitchen Data — And What They Do With It
CPG and ingredient brands. Identify which operators control the largest number of kitchens and the largest aggregate menu footprint, then target procurement decision-makers directly instead of chasing individual storefronts.
Distributors and foodservice suppliers. Build verified prospect lists of high-volume kitchens by cuisine, order density and expansion velocity. A distributor selling frying oil cares about fryer-heavy menus in high-density polygons — that is a filterable query, not a hunch.
Investors and diligence teams. Validate an operator's claimed footprint independently. If a company claims 300 kitchens and our fingerprinting resolves 190 active pickup clusters, that discrepancy is a diligence finding.
QSR chains and restaurant groups. Benchmark menu architecture, price ladders and promotional depth against delivery-native competitors before launching a virtual brand.
Delivery platforms and marketplaces. Detect brand duplication, enforce catalogue policies and identify supply gaps in under-served polygons.
Commercial real estate and kitchen infrastructure providers. Map where kitchen density is rising and where capacity is being retired.
The FoodDataScrape Data Model
Our food delivery data scraping services deliver structured, deduplicated and validated records across the following field groups:
Delivery formats include JSON, CSV, Parquet, direct database push, S3/GCS drops and REST API access, with daily, weekly or custom refresh cadences.
- Kitchen and location: pickup coordinates, city, pin code, delivery polygons served, operating hours, prep-time bands
- Brand and identity: brand name, platform presence, cuisine tags, first-seen and last-seen dates, active status
- Menu: full item catalogue, normalised item names, categories, descriptions, veg/non-veg flags, allergen text where published, add-on and customisation structures
- Pricing: base price, discounted price, promotional depth, price history, pin-code and platform variance
- Performance signals: rating, rating volume, review velocity, review sentiment themes
- Operator intelligence: multi-brand cluster ID, estimated brand count per kitchen, brand launch and retirement history
- Change tracking: menu additions, removals, price changes, brand launches, brand retirements
Methodology and Compliance
Restaurant menu data intelligence is only valuable if it is defensible. Our approach:
- We collect publicly accessible information only. No authentication bypass, no private data, no personal consumer data.
- We respect platform rate limits and operate crawlers designed to avoid service degradation.
- Records are deduplicated against a persistent entity graph, so a brand appearing on three platforms resolves to one entity, not three.
- Every record is version-controlled against its refresh cycle, so downstream models always know exactly how fresh each value is.
- Operator clustering is transparent and fully traceable — every grouping is backed by observable, verifiable data points.
What Good Looks Like: Measurable Outcomes
Teams that operationalise delivery aggregator data feeds typically track a small number of metrics:
| Metric | Before Data | With FoodDataScrape |
|---|---|---|
| Prospect list accuracy | 40–55% | 90%+ verified |
| Time to build a market map | 6–10 weeks (manual) | 3–5 days |
| Competitor price change detection | Monthly, partial | Daily, complete |
| Hidden operator identification | Effectively zero | 200+ clusters per major metro |
| Menu change lag | 30+ days | Under 24 hours |
The compounding value is in the change tracking. A one-time snapshot answers today's question. A continuous feed answers every question you have not asked yet.
Questions
Frequently Asked Questions
The terms are used interchangeably in most markets. All describe a delivery-only food production facility with no dine-in area. "Cloud kitchen" tends to dominate in India and the Gulf; "ghost kitchen" is more common in the United States.
Yes. This is the hardest case and the one where fingerprinting is most valuable. Shared pickup coordinates with a licensed dine-in restaurant, combined with menu overlap and identical operating windows, is a strong signal.
Standard cadence is weekly, with daily refresh available for pricing and promotional fields where volatility is highest.
Major aggregators across India, the United States, the United Kingdom, the Gulf, Southeast Asia and Europe. Coverage is scoped to your target markets rather than sold as an undifferentiated global dump.
Yes — API, cloud storage, database push or flat files, with schemas matched to your ingestion layer.
Conclusion
The 17 billion figure is a headline. The operating reality behind it — brands stacked on brands, kitchens hidden inside kitchens, prices that move by pin code and by hour — is where commercial advantage actually lives. That reality is not published. It has to be reconstructed, continuously, from live data.
Cloud Kitchen Data Scraping is how you reconstruct it. Whether you are targeting operators, benchmarking menus, validating a diligence claim or defending your own price position, the difference between guessing and knowing is a structured, refreshed, evidence-backed dataset.
FoodDataScrape crawls 220M+ pages of food data every week so that you do not have to guess.



