Introduction
Saudi Arabia's food delivery market is highly competitive, with customers comparing restaurant prices, meal combinations, delivery charges, discounts, portion sizes, and promotions before placing an order. For a delivery platform such as HungerStation, tracking competitor menu pricing every two weeks can reveal important changes in market positioning and consumer-facing pricing.
Competitor Menu Price Tracking for KSA enables delivery brands to systematically monitor competitor restaurants, menu items, categories, pricing changes, offers, and availability across major Saudi cities. Instead of relying on occasional manual checks, structured data collection creates a repeatable view of how prices evolve.
For businesses looking to Scrape Hungerstation Competitor Menu Data, the objective is not simply to collect restaurant names and prices. The real value comes from creating a historical dataset that can answer questions such as: Which restaurants increased prices? Which menu categories became more expensive? Where are competitors offering deeper discounts? Which restaurants are maintaining aggressive entry-level pricing?
Likewise, Saudi Arabia Menu Price Data Scraping can support a broader competitive intelligence strategy by capturing menu-level information across cities, cuisines, restaurant brands, meal categories, and promotional periods.
Why Biweekly Menu Price Tracking Matters?
Restaurant pricing changes frequently because of ingredient costs, labor expenses, delivery economics, seasonal demand, promotional campaigns, and competitive pressure. A price captured today may not represent the market position two or four weeks later.
Biweekly tracking provides a practical middle ground.
Daily monitoring can generate large quantities of data that may be unnecessary for strategic menu analysis, while monthly monitoring can miss important pricing movements. A two-week interval provides enough frequency to identify meaningful changes without creating excessive monitoring overhead.
For HungerStation, this approach can help create a consistent benchmark of competing restaurants and food delivery offerings.
The tracking process can capture:
- Restaurant names and locations
- Cuisine categories
- Menu categories
- Individual item names
- Listed prices
- Discounted prices
- Original prices
- Promotional offers
- Combo and meal prices
- Item availability
- Restaurant ratings and reviews
- Delivery fees where visible
- Minimum order values
- Price changes between tracking cycles
The result is a historical competitive dataset rather than a one-time snapshot.
What Should Be Tracked Across Competitor Menus?
A strong competitor monitoring program should go beyond headline prices.
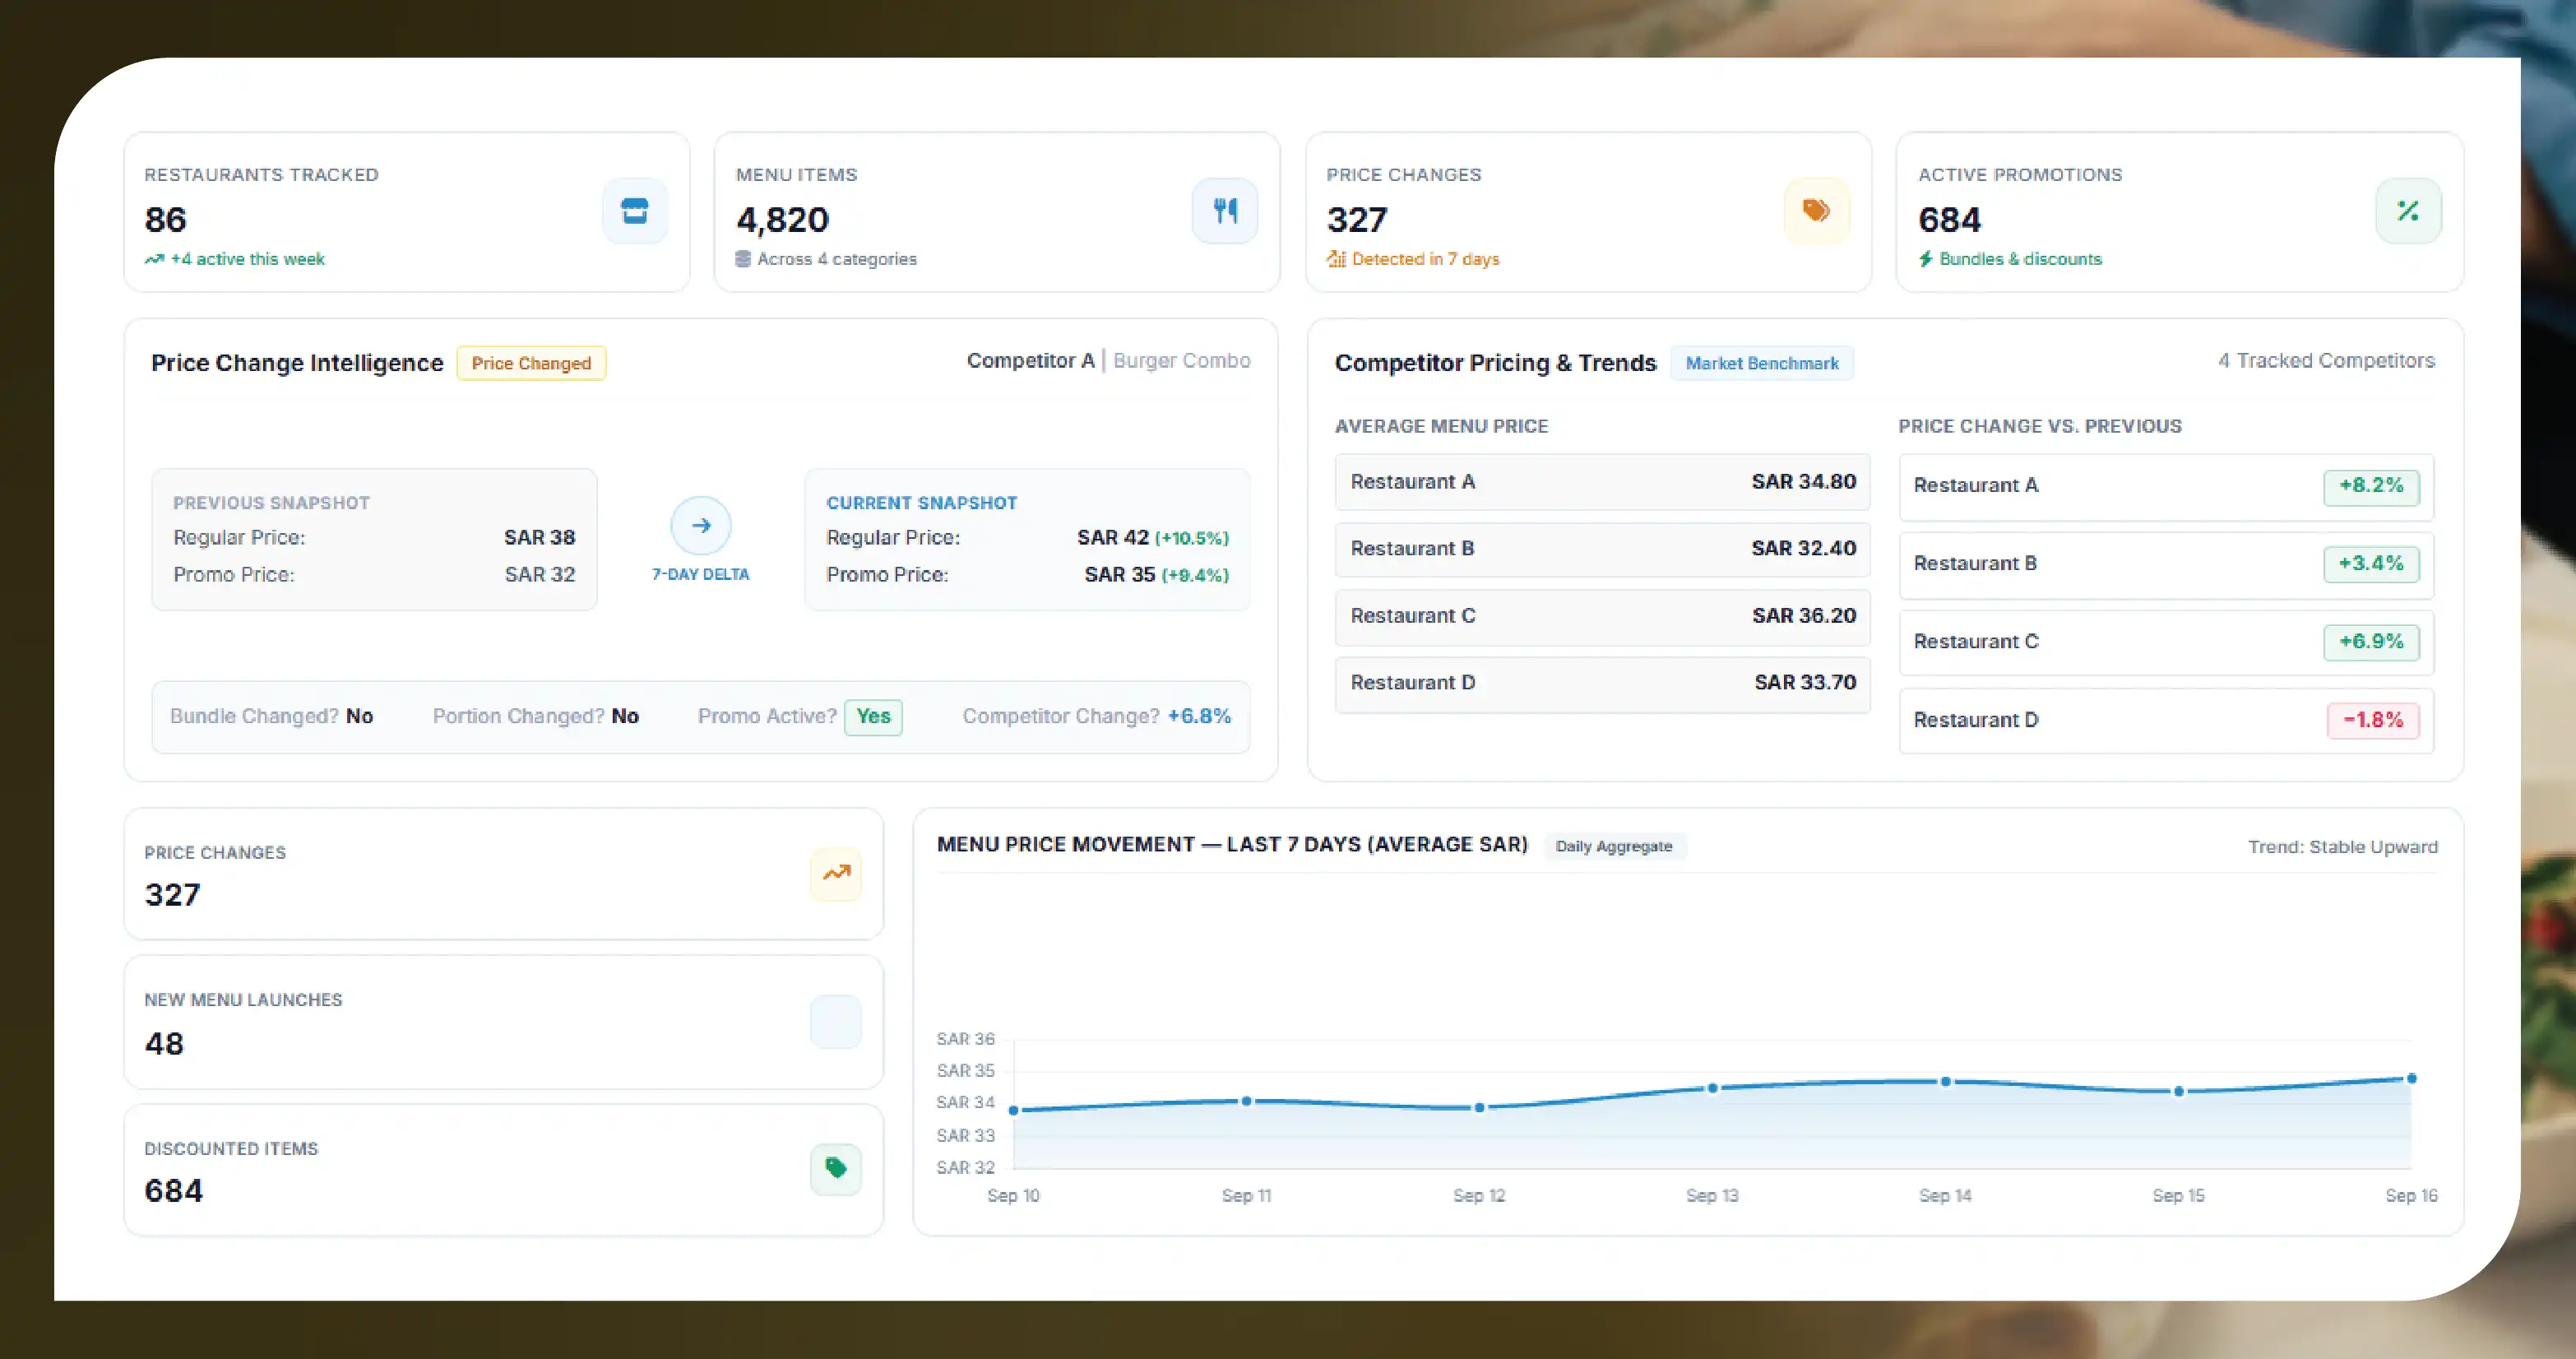
Suppose a burger restaurant previously sold a combo for SAR 32 and later lists it at SAR 35. The change is immediately useful, but additional context makes the insight more valuable.
Was the original price increased from SAR 38 to SAR 42 while the promotional price remained SAR 35? Did competitors make similar changes? Did the restaurant introduce a new meal? Did portion sizes or bundle components change?
This is why menu tracking should preserve both current and historical values.
Important attributes can include item names, categories, descriptions, prices, promotional prices, restaurant locations, cuisine types, meal configurations, and availability status.
With consistent collection, businesses can calculate price-change percentages, identify frequently discounted products, detect new menu launches, and compare pricing strategies between restaurant groups.
Building a Biweekly Tracking Framework
A successful monitoring framework begins by defining a competitor universe.
For example, a KSA delivery brand could identify restaurants across Riyadh, Jeddah, Dammam, Mecca, Medina, and other strategically important markets. Competitors can then be divided into categories based on cuisine, restaurant size, brand presence, price segment, or geographic coverage.
The next step is establishing a standardized menu schema.
Every tracking cycle should collect the same fields wherever possible. Standardization makes historical comparisons much easier. If one cycle records "Chicken Burger Meal" while another records "Chicken Burger Combo," data normalization can determine whether the item is actually new or simply renamed.
After collection, the dataset can be compared against the previous cycle.
A basic price-change calculation is:
Price Change % = ((Current Price − Previous Price) ÷ Previous Price) × 100
This allows analysts to distinguish between small fluctuations and substantial pricing movements.
For example, a SAR 20 item increasing to SAR 22 represents a 10% increase. When this change occurs across dozens of restaurants, it can indicate a broader market movement rather than an isolated adjustment.
How HungerStation Can Use Competitor Pricing Insights?
HungerStation can use menu intelligence to understand the competitive environment surrounding restaurants and food categories.
One valuable application is price benchmarking. Restaurants offering similar products can be compared across different price tiers. This can reveal whether a particular restaurant is positioned as budget-friendly, mid-market, premium, or aggressively promotional.
Another application is promotional intelligence.
A restaurant may maintain its standard menu prices but introduce frequent discounts, bundles, free-item promotions, or limited-time offers. Tracking these changes biweekly provides a more complete picture of effective customer-facing pricing.
Location-level comparisons can also reveal regional differences.
A restaurant brand may price the same product differently in Riyadh and Jeddah because of operating costs, local demand, competition, or market strategy. Monitoring these differences can help identify geographic pricing patterns.
Identifying Pricing Trends Before They Become Obvious
Historical data becomes particularly powerful when multiple tracking cycles are combined.
A single price increase may not mean much. However, if a category shows repeated increases over several cycles, it becomes a recognizable trend.
For example, analysts might observe that premium burgers increased steadily over three months while pizza prices remained relatively stable. That difference can support category-level competitive analysis.
Similarly, repeated discounting may indicate aggressive competition.
If several restaurants continuously reduce prices around weekends or paydays, delivery platforms can investigate whether promotional activity is becoming concentrated around particular demand periods.
This makes Hungerstation Restaurant Data Scraping useful not only for collecting prices but also for identifying patterns across the restaurant ecosystem.
Combining Menu Data With Competitive Intelligence
Menu prices become significantly more valuable when combined with other restaurant attributes.
A competitive intelligence dataset can connect pricing with cuisine, ratings, reviews, location, restaurant popularity, promotions, and menu assortment.
For example, analysts could investigate whether highly rated restaurants command higher prices or whether restaurants with larger menus rely more heavily on discounts.
They can also examine whether certain cuisines have experienced stronger price inflation than others.
This creates Restaurant Competitive Intelligence Data that can support strategic decision-making across pricing, partnerships, promotions, restaurant acquisition, and market expansion.
Why Automation Is Better Than Manual Monitoring?
Manually checking hundreds of restaurant menus every two weeks is time-consuming and difficult to standardize.
Menu pages can contain dozens or hundreds of items. Restaurants may update prices, rename products, add new meals, remove unavailable products, or modify promotions without a centralized notification.
Automated Biweekly Menu Price Data Tracking can create a consistent process for gathering information according to predefined fields and schedules.
The resulting datasets can then be cleaned, normalized, deduplicated, and compared against historical records.
For businesses operating at scale, KSA Food Delivery Data Scraping can therefore transform scattered marketplace information into structured intelligence that analysts can query and visualize.
From Raw Menu Data to Actionable Decisions
Data collection itself is only the first step.
The next stage involves organizing the information into useful analytical outputs.
A dashboard could show:
- Average competitor menu price
- Median price by cuisine
- Highest and lowest-priced menu categories
- Two-week price movements
- Percentage of discounted items
- New menu introductions
- Removed products
- Restaurant-level pricing changes
- City-level pricing differences
- Promotional frequency
This enables decision-makers to quickly identify what has changed since the previous tracking cycle.
For example, if a major competitor increases prices across a large portion of its menu, HungerStation may investigate whether the market is moving toward higher price points. Conversely, if competitors begin discounting heavily, promotional strategy may require closer attention.
The Role of Real-Time Monitoring
Biweekly tracking is ideal for strategic market analysis, but some pricing situations may require more frequent observation.
Real-Time Price Monitoring can complement scheduled competitive tracking when businesses need rapid visibility into important pricing events, promotional campaigns, or high-priority competitors.
A hybrid model can therefore work effectively: biweekly collection for broad market intelligence and more frequent monitoring for selected restaurants, products, or competitive events.
This approach balances data volume with business value.
Ready to gain a competitive edge in Saudi Arabia's food delivery market? Partner with expert food data scraping specialists to track competitor menus, prices, promotions, and market trends with reliable, actionable insights.
Turning Historical Data Into a Pricing Benchmark
After several months of biweekly collection, the dataset becomes considerably more powerful.
Instead of asking, "What is this restaurant charging today?" analysts can ask, "How has this restaurant's pricing changed over the last six months?"
That distinction is important.
Historical benchmarking can reveal recurring promotional patterns, seasonal adjustments, sustained price increases, price stability, product replacements, and competitive reactions.
Businesses using Food Data Scraping Services can build these historical datasets into broader market intelligence programs covering restaurant menus, prices, promotions, availability, and competitive positioning.
How Food Data Scrape Can Help You?
1. Track Competitor Pricing
Food data collection can monitor competitor menu prices at regular intervals, helping businesses identify increases, reductions, promotions, and category-level pricing movements across Saudi restaurant markets.
2. Build Historical Benchmarks
Structured datasets preserve previous menu snapshots, allowing analysts to compare current prices with historical values and identify sustained trends instead of relying on isolated pricing observations.
3. Monitor Promotional Strategies
Automated collection can capture discounts, bundles, promotional prices, and changing offers, helping delivery brands understand how competitors use promotions to attract and retain customers.
4. Strengthen Competitive Intelligence
Combining menu prices with restaurant, cuisine, location, availability, and promotional information creates actionable intelligence that supports pricing strategy, partnership decisions, market analysis, and campaign planning.
5. Improve Market Responsiveness
Regular monitoring gives businesses earlier visibility into competitive changes, enabling pricing teams and category managers to investigate market movements and respond with better-informed commercial strategies.
Conclusion
Biweekly competitor menu monitoring provides KSA delivery brands with a structured way to understand changing restaurant prices, promotions, product availability, and competitive positioning. For a platform such as HungerStation, maintaining consistent historical snapshots can turn fragmented marketplace information into a valuable strategic resource.
Modern Food Data Scraping in Saudi Arabia can support systematic collection across restaurants, cities, cuisines, menu categories, and pricing segments, while HungerStation Food Delivery App Data Scraping can help create structured marketplace intelligence for deeper competitive analysis.
Over time, a well-maintained HungerStation Food Dataset from Saudi Arabia can become more than a collection of menu records. It can provide historical evidence for identifying pricing trends, benchmarking competitors, evaluating promotions, and understanding how Saudi Arabia's rapidly evolving food-delivery market is changing.
If you are seeking for a reliable data scraping services, Food Data Scrape is at your service. We hold prominence in Food Data Aggregator and Mobile Restaurant App Scraping with impeccable data analysis for strategic decision-making.
Get a Free Food Data Sample in 48 Hours.
Tell us your platforms, target markets and required fields — we'll map exactly what's possible with food data scraping, recommend the right approach, and send a working sample so you can verify quality before any commitment.
Request a strategy call
Thanks — our data team will reach out within 48 hours with your sample.