
Introduction
The rapid growth of online food ordering has changed how restaurants understand their customers, competitors, and geographic markets. A restaurant's physical address provides only a partial view of its actual market reach because digital ordering platforms can extend its customer base across multiple neighborhoods. Delivery Radius & Coverage Data scrape helps businesses capture and analyze this extended reach by collecting information about serviceable areas, restaurant locations, delivery distances, estimated delivery times, fees, and geographic availability.
For restaurant chains and QSR operators, restaurant delivery radius analysis can reveal how far individual outlets serve customers and where delivery territories overlap. When this information is combined with restaurant location intelligence for QSRs, businesses can identify underserved neighborhoods, compare competitor coverage, optimize existing territories, and evaluate potential expansion locations.
The resulting datasets can support market research, competitive intelligence, delivery optimization, location planning, and geographic opportunity analysis. By repeatedly collecting delivery information, businesses can also monitor how restaurant coverage changes over time.
Understanding the Data Behind Delivery Coverage
Delivery coverage data represents the geographic area in which a restaurant accepts delivery orders. Although the term "radius" suggests a simple circular area around a restaurant, actual delivery territories can be more complex.
Platforms may determine serviceability based on road networks, courier availability, traffic conditions, restaurant capacity, customer location, operating hours, and other operational factors. Consequently, two restaurants located close to one another may have completely different delivery territories.
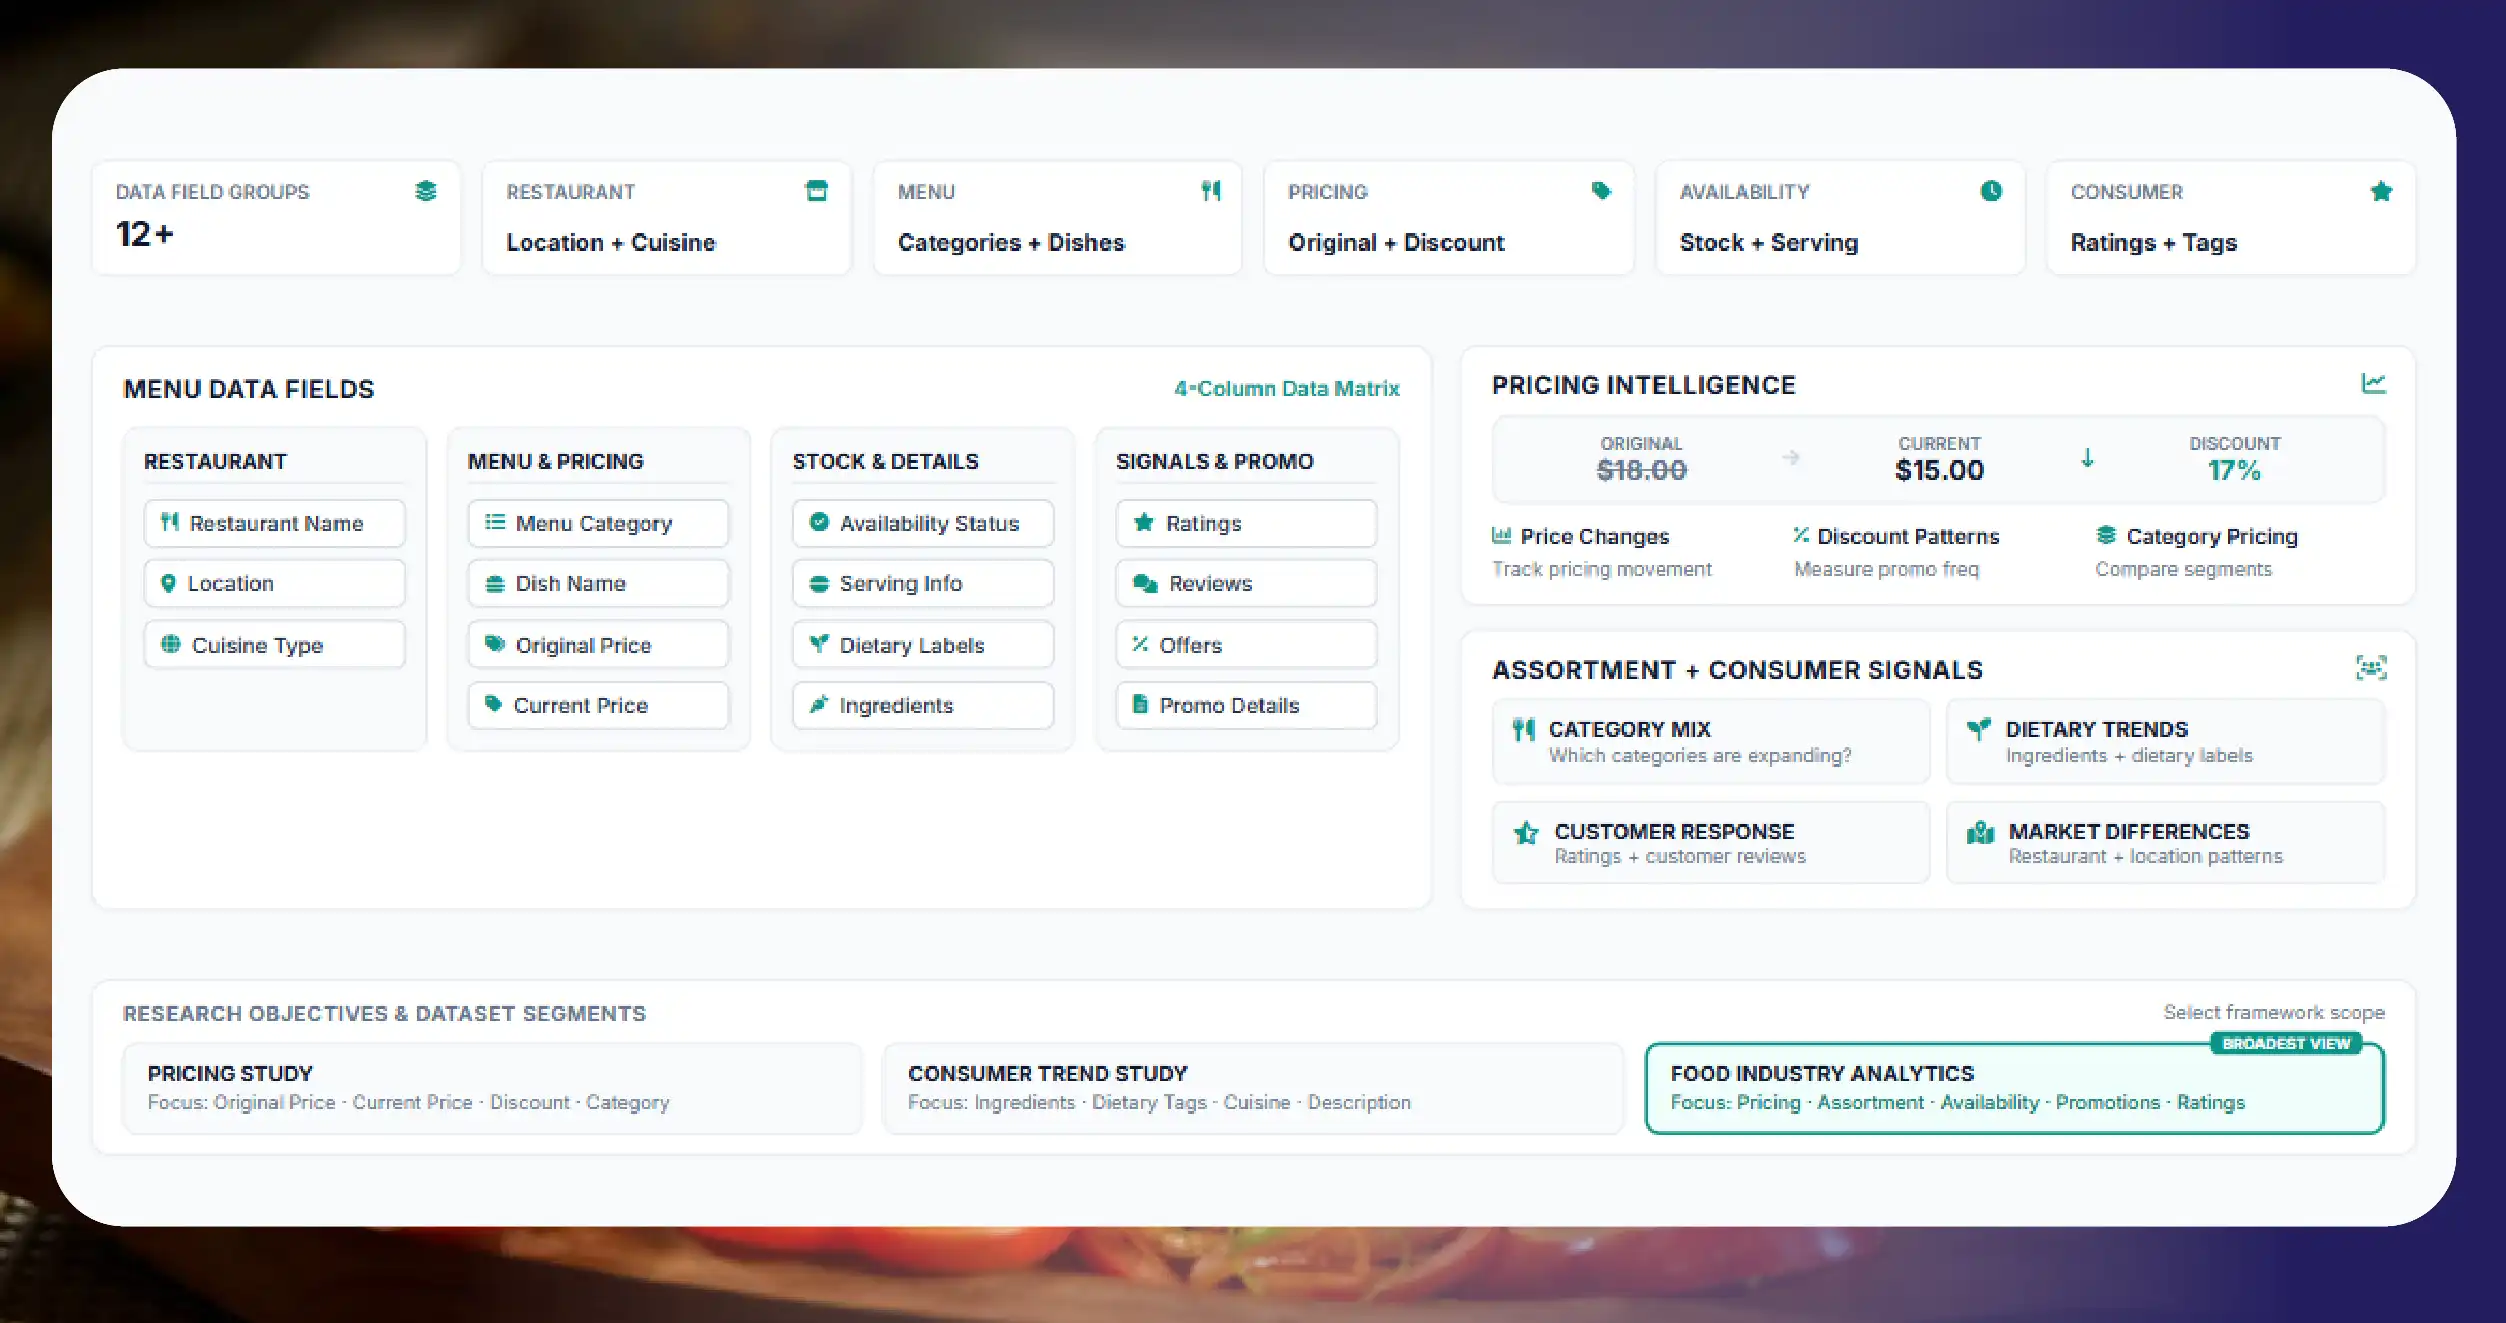
A comprehensive dataset may contain restaurant names, outlet identifiers, addresses, latitude and longitude, serviceable locations, delivery distances, delivery fees, minimum order values, ETAs, operating hours, cuisines, ratings, platform names, and collection timestamps.
These fields can be standardized and connected to geographic coordinates, allowing businesses to create maps and analytical models that represent actual delivery reach.
Mapping Restaurant Service Areas
Delivery zone analysis for restaurants helps businesses understand the geographic distribution of serviceable customers. Instead of looking at individual restaurant addresses, companies can examine the territories surrounding each outlet.
For example, a restaurant located in a central business district may serve several residential areas, office clusters, and nearby commercial zones. Another restaurant located on the outskirts of the same city may have a much smaller effective service area.
Mapping these territories makes it easier to identify areas with strong coverage and locations where customers have limited access to particular restaurants or cuisines.
Businesses can divide cities into geographic grids and determine which restaurants serve each grid. This creates a structured coverage model that can be analyzed at neighborhood, postal code, district, or city level.
Measuring Restaurant Concentration
Restaurant density analysis provides another important layer of geographic intelligence. It measures how many restaurants operate within specific locations and how their delivery territories interact.
High restaurant density may indicate strong competition, but it can also reveal areas with significant consumer demand. A neighborhood with numerous restaurants may still have limited availability for a particular cuisine, price category, or QSR brand.
By combining restaurant locations with delivery coverage, companies can distinguish between physical restaurant concentration and effective digital coverage.
Businesses can analyze restaurant density according to cuisine, brand, price segment, restaurant format, or delivery platform. This creates a more detailed picture of competitive conditions across different geographic markets.
Evaluating Expansion Opportunities
Restaurant expansion location analytics allows restaurant operators to evaluate potential new locations using existing market and delivery information.
Traditional expansion decisions may consider population, rent, foot traffic, demographics, and proximity to competitors. Delivery coverage adds another important dimension by showing whether a proposed location can extend the brand's digital reach.
An expansion model can compare potential locations according to:
- Existing brand coverage
- Competitor coverage
- Restaurant density
- Average delivery distance
- Estimated delivery time
- Customer accessibility
- Geographic coverage gaps
- Potential overlap with existing outlets
This approach can prevent unnecessary cannibalization between nearby outlets while helping businesses identify markets where a new restaurant could extend coverage.
Using Delivery Information for QSR Planning
QSR location planning using delivery data scrape enables quick-service restaurant brands to incorporate digital demand accessibility into their location strategy.
A QSR chain may have several outlets within a metropolitan area, but those outlets might not provide efficient coverage across the entire target market. Scraped delivery data can show where coverage overlaps excessively and where significant geographic gaps remain.
For example, if three outlets serve nearly identical neighborhoods, opening another location nearby may provide limited incremental coverage. However, an area located outside all three service zones could represent a stronger opportunity.
This information can help QSR brands evaluate restaurants, dark kitchens, pickup locations, and delivery-focused facilities based on measurable geographic coverage.
Comparing Fees and Delivery Times
Delivery Fee & ETA Intelligence helps businesses evaluate how delivery economics vary between restaurants, platforms, and locations.
Customers may see different delivery fees depending on their distance from a restaurant. ETAs may also change according to traffic, courier availability, order volumes, and time of day.
By collecting these values repeatedly, businesses can compare competitors and identify geographic patterns.
Useful measurements include average delivery fee, average ETA, maximum observed delivery distance, peak-hour ETA, off-peak ETA, and fee variation by distance.
These metrics can reveal whether a competitor has a delivery advantage in a particular neighborhood and whether operational improvements could help a restaurant compete more effectively.
Collecting Data From Food Delivery Platforms
Scraping Food Delivery Data involves systematically gathering publicly accessible restaurant and delivery information from relevant online sources while respecting applicable legal requirements, platform terms, and responsible data collection practices.
A structured extraction process can capture restaurant information for multiple geographic points. Each location can be tested to determine which restaurants appear available and what delivery conditions are presented.
The workflow may include location discovery, restaurant identification, geographic normalization, data extraction, validation, deduplication, and storage.
Collected records can then be converted into standardized datasets for analysis.
For large projects, automation helps businesses repeat collection across hundreds or thousands of geographic points, making it possible to build broader city-level or national delivery coverage datasets.
Building Geographic Coverage Maps
Once the data has been collected, geographic mapping can transform raw records into visual market intelligence.
Restaurants can be represented as points, while service areas can be represented as polygons, distance bands, geographic grids, or neighborhood-level coverage indicators.
A coverage map can show which restaurants serve each location and how many competing brands overlap within the same area.
Businesses can also create heat maps showing restaurant concentration, average delivery times, or average fees.
Such visualizations make complex geographic relationships easier to understand and can support presentations for operations, marketing, real estate, and executive teams.
Identifying Competitive Gaps
Delivery data can reveal market opportunities that traditional restaurant-location research may overlook.
A neighborhood may have a large population but relatively low coverage from specific restaurant categories. Another area may have extensive restaurant availability but limited coverage from a particular brand.
Businesses can create coverage-gap scores by combining restaurant density, competitor presence, delivery accessibility, and geographic proximity.
These scores can help prioritize areas for further investigation.
For example, a brand could identify neighborhoods where competitors have strong coverage but its own delivery presence is weak. Alternatively, it could locate areas where both the brand and competitors have limited coverage, potentially indicating an underserved market.
Monitoring Coverage Changes Over Time
Restaurant delivery zones are dynamic. Coverage can expand or contract because of changes in courier availability, restaurant operating hours, demand, traffic, weather, staffing, or platform policies.
Regular collection makes it possible to create a historical record of these changes.
Businesses can compare coverage across days, weeks, months, seasons, or specific time periods. This allows them to determine whether changes are temporary or represent a long-term strategic shift.
Historical monitoring can also reveal whether a newly opened outlet is increasing total brand coverage or simply overlapping with existing locations.
Comparing Multiple Delivery Platforms
Restaurants often use more than one food delivery platform, and each platform may display different coverage, fees, and ETAs.
Comparing these differences can provide useful information about platform performance.
A restaurant might receive broader geographic coverage from one platform but faster ETAs from another. Businesses can monitor these differences at outlet and neighborhood levels.
Multi-platform analysis can therefore support decisions about platform partnerships, delivery allocation, pricing, and geographic availability.
Supporting Operational Decisions
Delivery coverage information is not only useful for expansion. It can also help businesses optimize existing operations.
If a restaurant frequently serves customers near the edge of its delivery area, management can evaluate whether delivery times or costs become inefficient at longer distances.
Similarly, if multiple outlets serve the same geographic areas, businesses can investigate whether orders should be redirected to the closest or most operationally efficient outlet.
Coverage information can therefore contribute to delivery network optimization and improved resource allocation.
Ready to turn delivery coverage into actionable restaurant intelligence? Partner with Food Data Scrape to collect accurate delivery radius, service-area, fee, ETA, and location data for smarter expansion decisions.
Challenges in Collecting Delivery Coverage Information
Delivery data scraping can involve technical and analytical challenges. Food delivery platforms may use dynamic interfaces, location-dependent results, frequently changing availability, or automated access controls.
Address information may also contain inconsistencies. The same restaurant could appear under slightly different names across platforms, while franchise outlets may share similar branding.
Accurate analysis therefore requires data cleaning, address normalization, coordinate verification, duplicate detection, timestamping, and validation.
Businesses should also design collection systems according to applicable regulations and the terms governing the relevant data sources.
Creating a Useful Analytics Framework
The value of delivery coverage data increases when multiple datasets are connected.
Restaurant locations can be combined with delivery zones, menus, prices, ratings, fees, ETAs, operating hours, and competitor information.
This creates a comprehensive restaurant intelligence framework that can support several analytical questions.
Businesses can calculate average delivery radius, percentage of market coverage, restaurant overlap, competitor coverage, delivery fee averages, ETA averages, restaurant density, and geographic opportunity scores.
These metrics can be integrated into dashboards that allow users to filter results by city, neighborhood, brand, cuisine, platform, date, and restaurant type.
How Food Data Scrape Can Help You?
1. Map Delivery Territories
Food Data Scrape helps identify restaurant delivery boundaries, serviceable neighborhoods, and geographic gaps, enabling businesses to visualize coverage areas and understand how effectively each outlet reaches potential customers.
2. Optimize New Locations
Collected delivery coverage data helps QSR brands compare underserved markets, competitor presence, restaurant density, and overlapping territories to identify strategic locations for new outlets and expansion opportunities.
3. Benchmark Competitors
Businesses can compare competitor delivery radius, fees, ETAs, and service areas across platforms, revealing geographic advantages, coverage gaps, pricing differences, and opportunities to strengthen their delivery strategy.
4. Improve Delivery Operations
Scraped delivery information helps identify inefficient territories, excessive delivery distances, overlapping outlet coverage, and changing ETAs, allowing restaurants to optimize operational planning and improve customer delivery experiences.
5. Track Market Changes
Regularly collected historical delivery data enables businesses to monitor changing service zones, restaurant openings, competitor expansion, delivery fees, and geographic market movements for stronger long-term strategic decisions.
Conclusion
Geographic delivery information provides restaurants with a clearer understanding of how their digital operations interact with physical markets. Food Delivery App Data Scraping can collect restaurant locations, delivery zones, fees, ETAs, serviceability, and other relevant information across online food ordering platforms.
A Real-Time Delivery Scraping API can support applications that require continuously refreshed restaurant coverage, delivery availability, pricing, and ETA information. At the same time, Historical Food Delivery Data can help businesses analyze changes in service areas, competitor expansion, delivery performance, and long-term market trends.
When these datasets are combined with restaurant locations and competitive information, businesses can make more informed decisions about QSR expansion, outlet placement, delivery territories, market gaps, and operational efficiency. Delivery coverage analysis ultimately transforms restaurant location data into a broader geographic intelligence system for understanding digital food markets.
If you are seeking for a reliable data scraping services, Food Data Scrape is at your service. We hold prominence in Food Data Aggregator and Mobile Restaurant App Scraping with impeccable data analysis for strategic decision-making.



