
The Client
The client was a food-tech intelligence company developing analytical solutions for restaurants, food marketplaces, aggregators, investors, and food-service businesses. Its objective was to compare delivery times across food delivery apps and understand how restaurant delivery performance varied by platform, location, cuisine, and operating period. The company required structured data that could support food delivery performance benchmarking across multiple markets and restaurant categories. It also needed comprehensive information from different restaurant delivery Aggregators to create comparable datasets. Previously, fragmented delivery information made it difficult to establish reliable benchmarks or identify recurring performance patterns. The client therefore partnered with Food Data Scrape to develop a scalable data collection framework. The solution captured restaurant-level delivery information, standardized ETA values, recorded collection timestamps, and organized platform-specific observations. This enabled analysts to evaluate delivery efficiency, identify competitive gaps, monitor geographic differences, and generate actionable intelligence for restaurant partnerships, marketplace strategy, operational planning, and customer experience initiatives.
Key Challenges
-
Inconsistent ETA Formats
The client faced difficulties conducting a reliable food delivery ETA comparison across aggregators because platforms displayed delivery estimates using different formats, ranges, and terminology. Standardizing these variations while preserving original information was essential for accurate restaurant, location, and platform-level benchmarking. -
Dynamic Delivery Information
Real-time Tracking Food Delivery presented another challenge because estimated delivery times could change according to restaurant workload, demand, operating hours, traffic, location, and platform conditions. Capturing these dynamic variations consistently required automated workflows with accurate timestamps and systematic collection intervals. -
Large-Scale Data Requirements
Large-scale Food Delivery Data Scraping was necessary to cover numerous restaurants, platforms, cities, and operating periods. Manual collection was time-consuming and difficult to maintain, making scalable extraction, validation, normalization, duplicate removal, and structured storage essential for recurring delivery performance analysis.
Key Solutions
-
Multi-Platform Data Collection
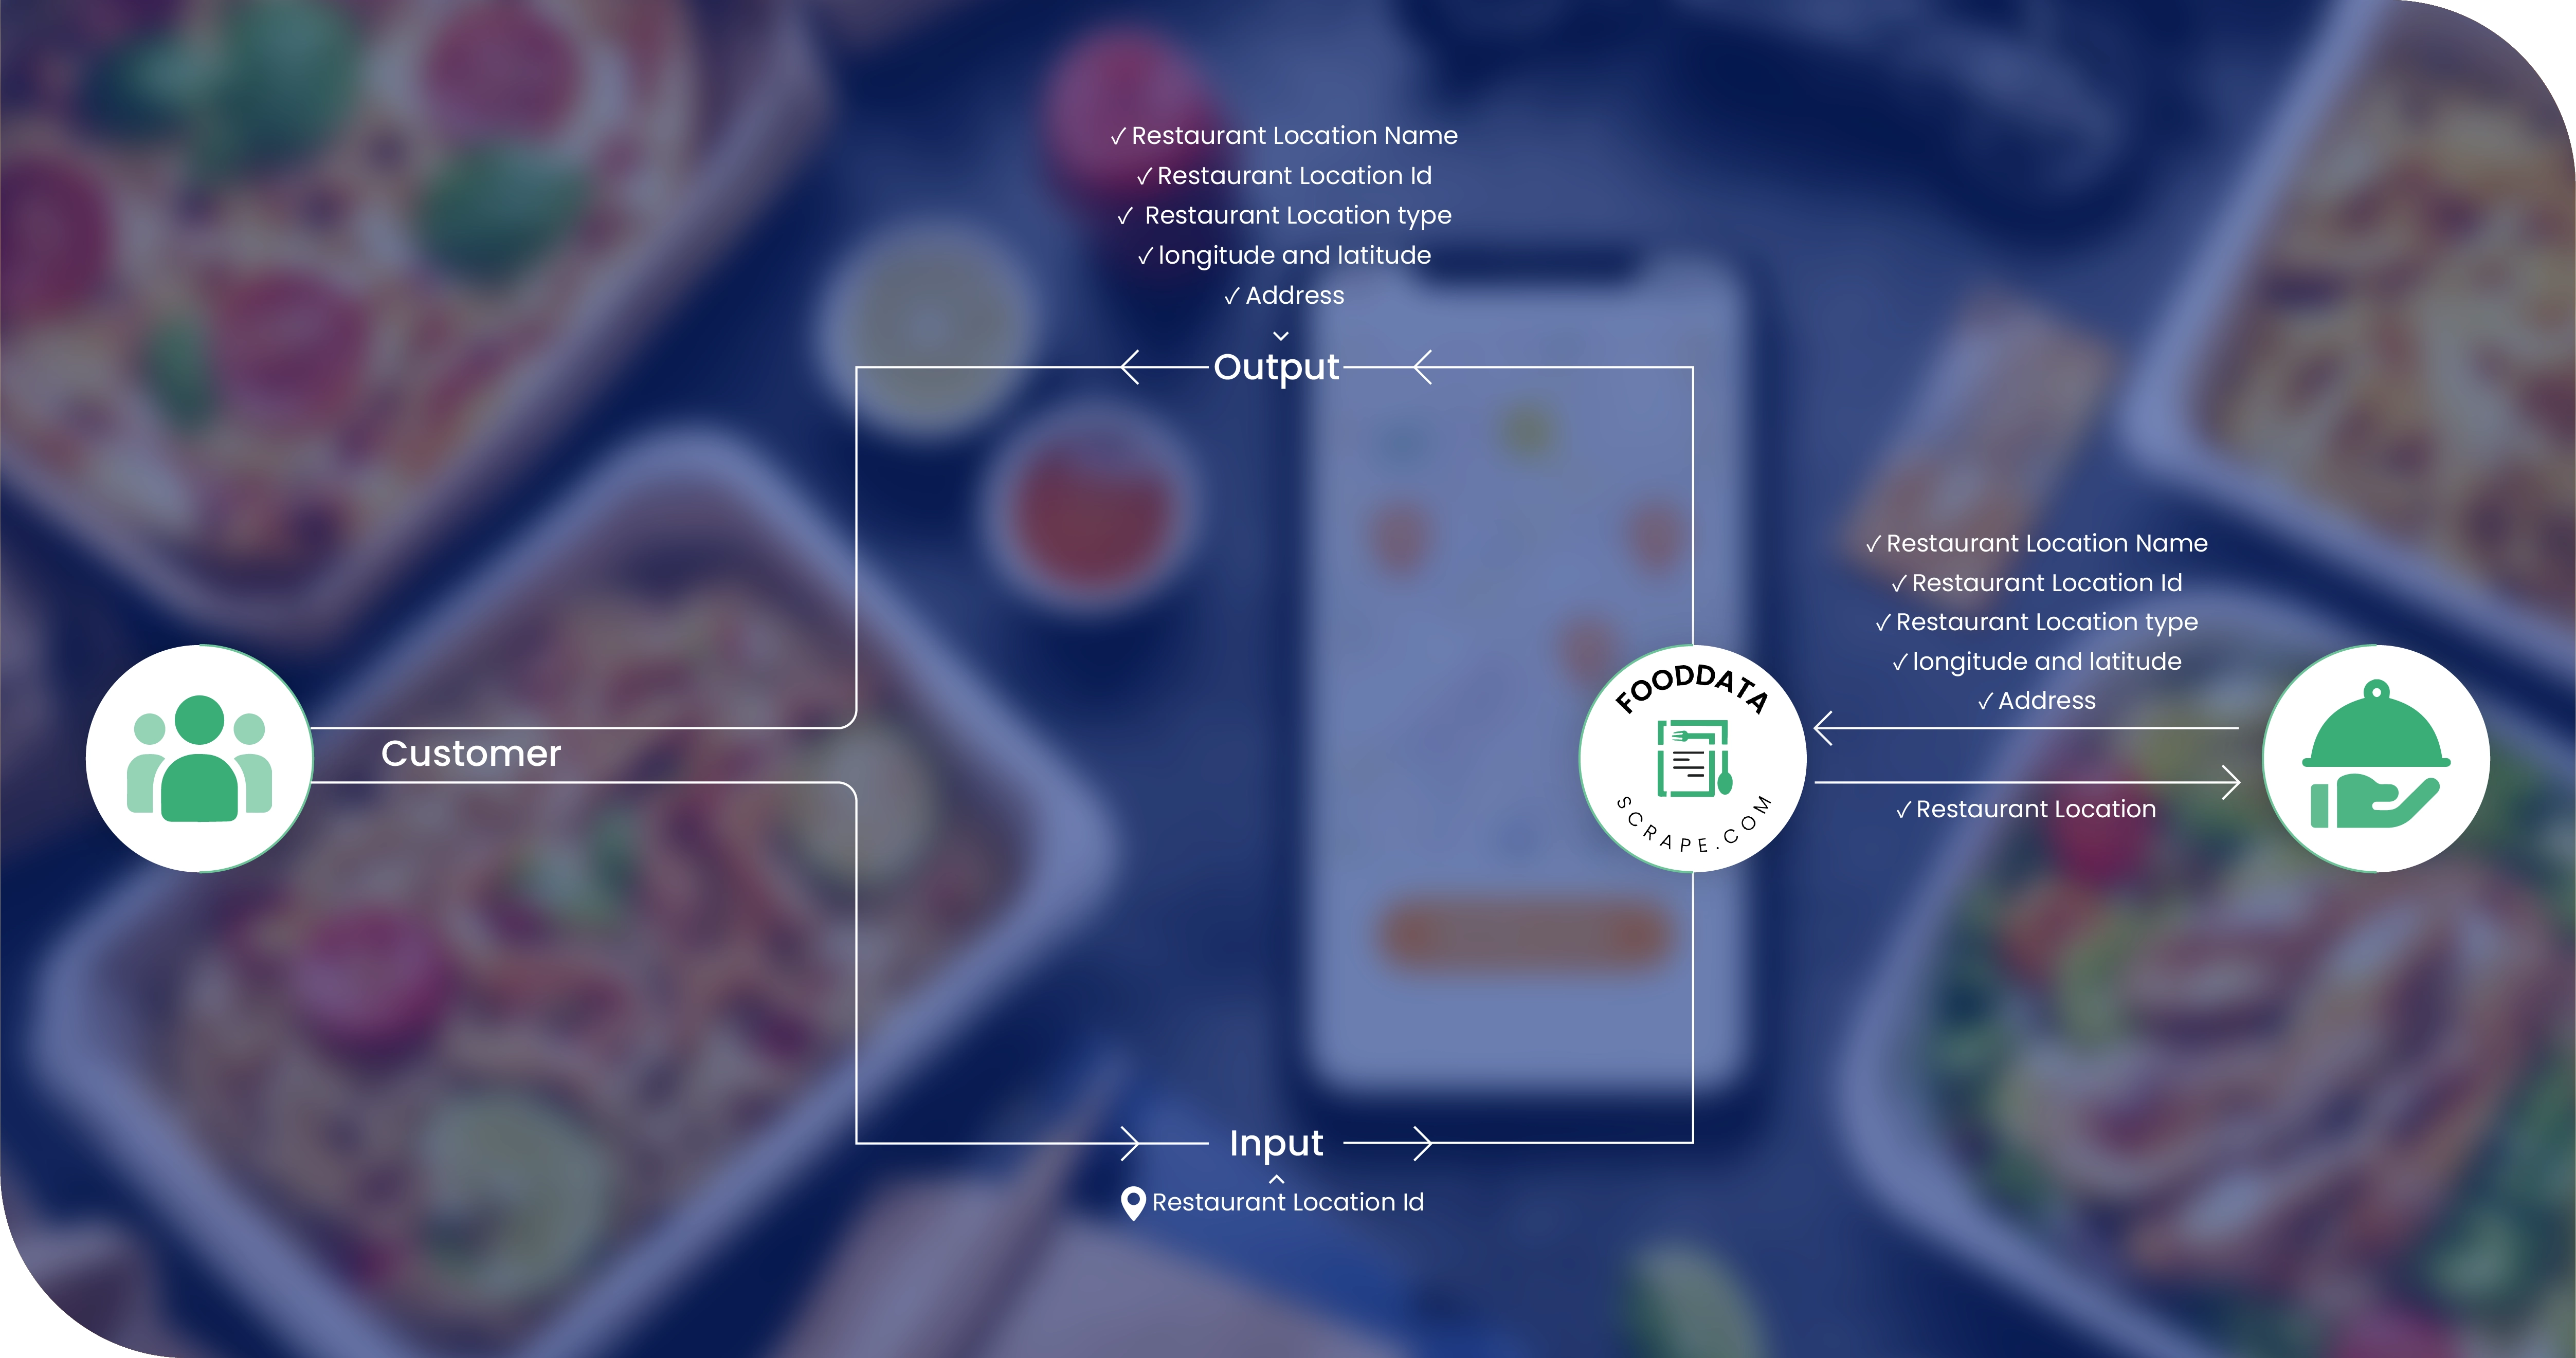
Food Data Scrape implemented Food Aggregator Data Scraping workflows to collect restaurant and delivery information across selected platforms. The process captured restaurant names, locations, cuisines, delivery estimates, availability, timestamps, and platform identifiers, creating standardized records for reliable cross-platform analysis. -
Historical Delivery Monitoring
The solution supported Tracking Food Delivery Trends through recurring data collection and historical snapshots. Delivery observations were organized by restaurant, location, platform, and collection period, enabling the client to identify recurring delays, peak-hour patterns, geographic variations, and changing delivery performance. -
Data Standardization and Validation
Collected information was cleaned, normalized, and validated before delivery. ETA formats, restaurant identifiers, locations, timestamps, and platform fields were standardized, while duplicate and incomplete records were reviewed. This produced an analysis-ready dataset suitable for dashboards, reporting, benchmarking, and competitive intelligence.
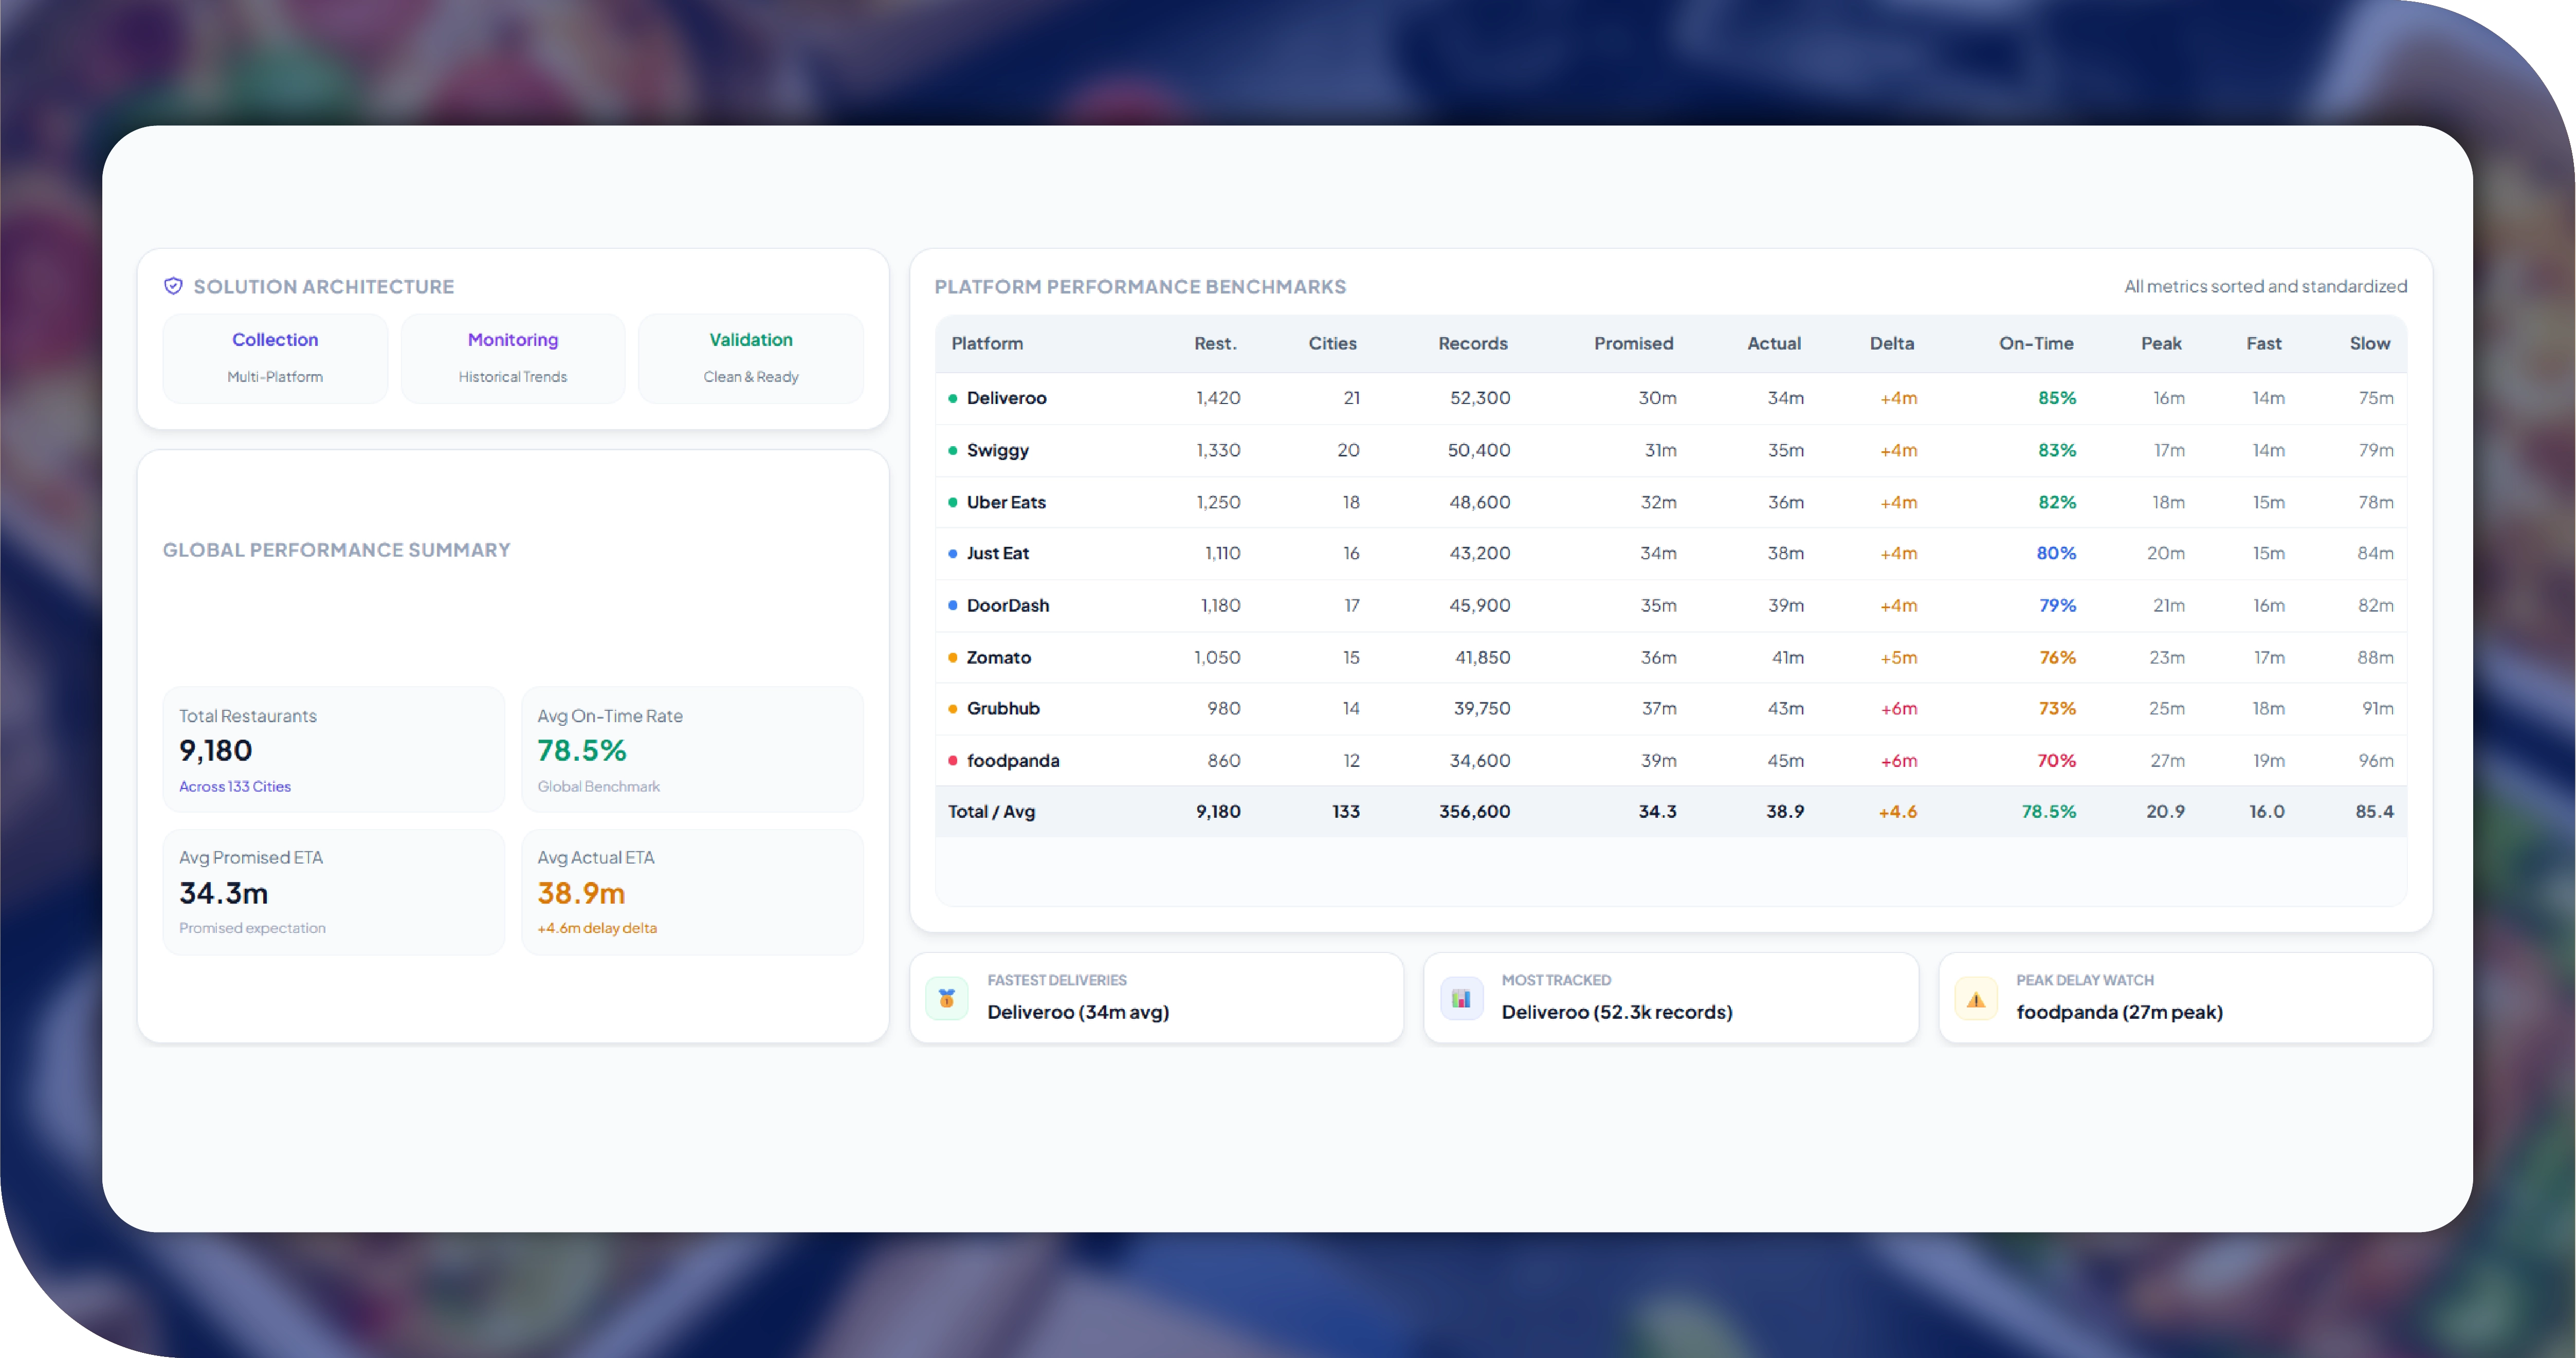
Delivery Performance Benchmark Dataset
Illustrative dataset showing the structure and numerical analysis that can be created from collected delivery observations.
| Platform | Restaurants Tracked | Cities | Records | Avg Promised ETA (Min) | Avg Delivery ETA (Min) | ETA Difference (Min) | On-Time Rate (%) | Peak Delay (Min) | Fastest ETA (Min) | Slowest ETA (Min) |
|---|---|---|---|---|---|---|---|---|---|---|
| Uber Eats | 1,250 | 18 | 48,600 | 32 | 36 | 4 | 82 | 18 | 15 | 78 |
| DoorDash | 1,180 | 17 | 45,900 | 35 | 39 | 4 | 79 | 21 | 16 | 82 |
| Deliveroo | 1,420 | 21 | 52,300 | 30 | 34 | 4 | 85 | 16 | 14 | 75 |
| Grubhub | 980 | 14 | 39,750 | 37 | 43 | 6 | 73 | 25 | 18 | 91 |
| Just Eat | 1,110 | 16 | 43,200 | 34 | 38 | 4 | 80 | 20 | 15 | 84 |
| foodpanda | 860 | 12 | 34,600 | 39 | 45 | 6 | 70 | 27 | 19 | 96 |
| Swiggy | 1,330 | 20 | 50,400 | 31 | 35 | 4 | 83 | 17 | 14 | 79 |
| Zomato | 1,050 | 15 | 41,850 | 36 | 41 | 5 | 76 | 23 | 17 | 88 |
| Total / Average | 9,180 | 133 | 356,600 | 34.3 | 38.9 | 4.6 | 78.5 | 20.9 | 16.0 | 85.4 |
Methodologies Used
-
Source Identification and Mapping
Relevant food delivery platforms, restaurant categories, geographic markets, and target data fields were identified before collection. This established a clearly defined extraction scope and ensured that the resulting dataset addressed the client's specific benchmarking, competitive intelligence, and delivery analysis requirements. -
Automated Data Extraction
Automated extraction workflows collected restaurant and delivery information at scale. Depending on source behavior, appropriate requests, parsing techniques, and browser automation methods were applied. This improved collection efficiency while enabling systematic retrieval of dynamic delivery information across multiple supported platforms. -
Data Normalization
Collected records were normalized into consistent structures covering restaurant identifiers, locations, cuisines, delivery estimates, timestamps, and platform information. Standardized formatting reduced inconsistencies and enabled analysts to perform reliable comparisons across restaurants, cities, platforms, and different collection periods. -
Quality Validation
Quality assurance procedures examined duplicate records, missing values, invalid timestamps, unusual delivery estimates, and inconsistent restaurant information. Automated validation rules helped identify anomalies while review processes improved the reliability and usability of the final benchmark dataset for analytical applications. -
Historical Snapshot Collection
Recurring snapshots were created to support historical performance analysis. Delivery observations were organized by collection date, restaurant, platform, location, and operating period. This approach allowed analysts to identify trends, compare historical changes, evaluate delays, and monitor evolving delivery performance.
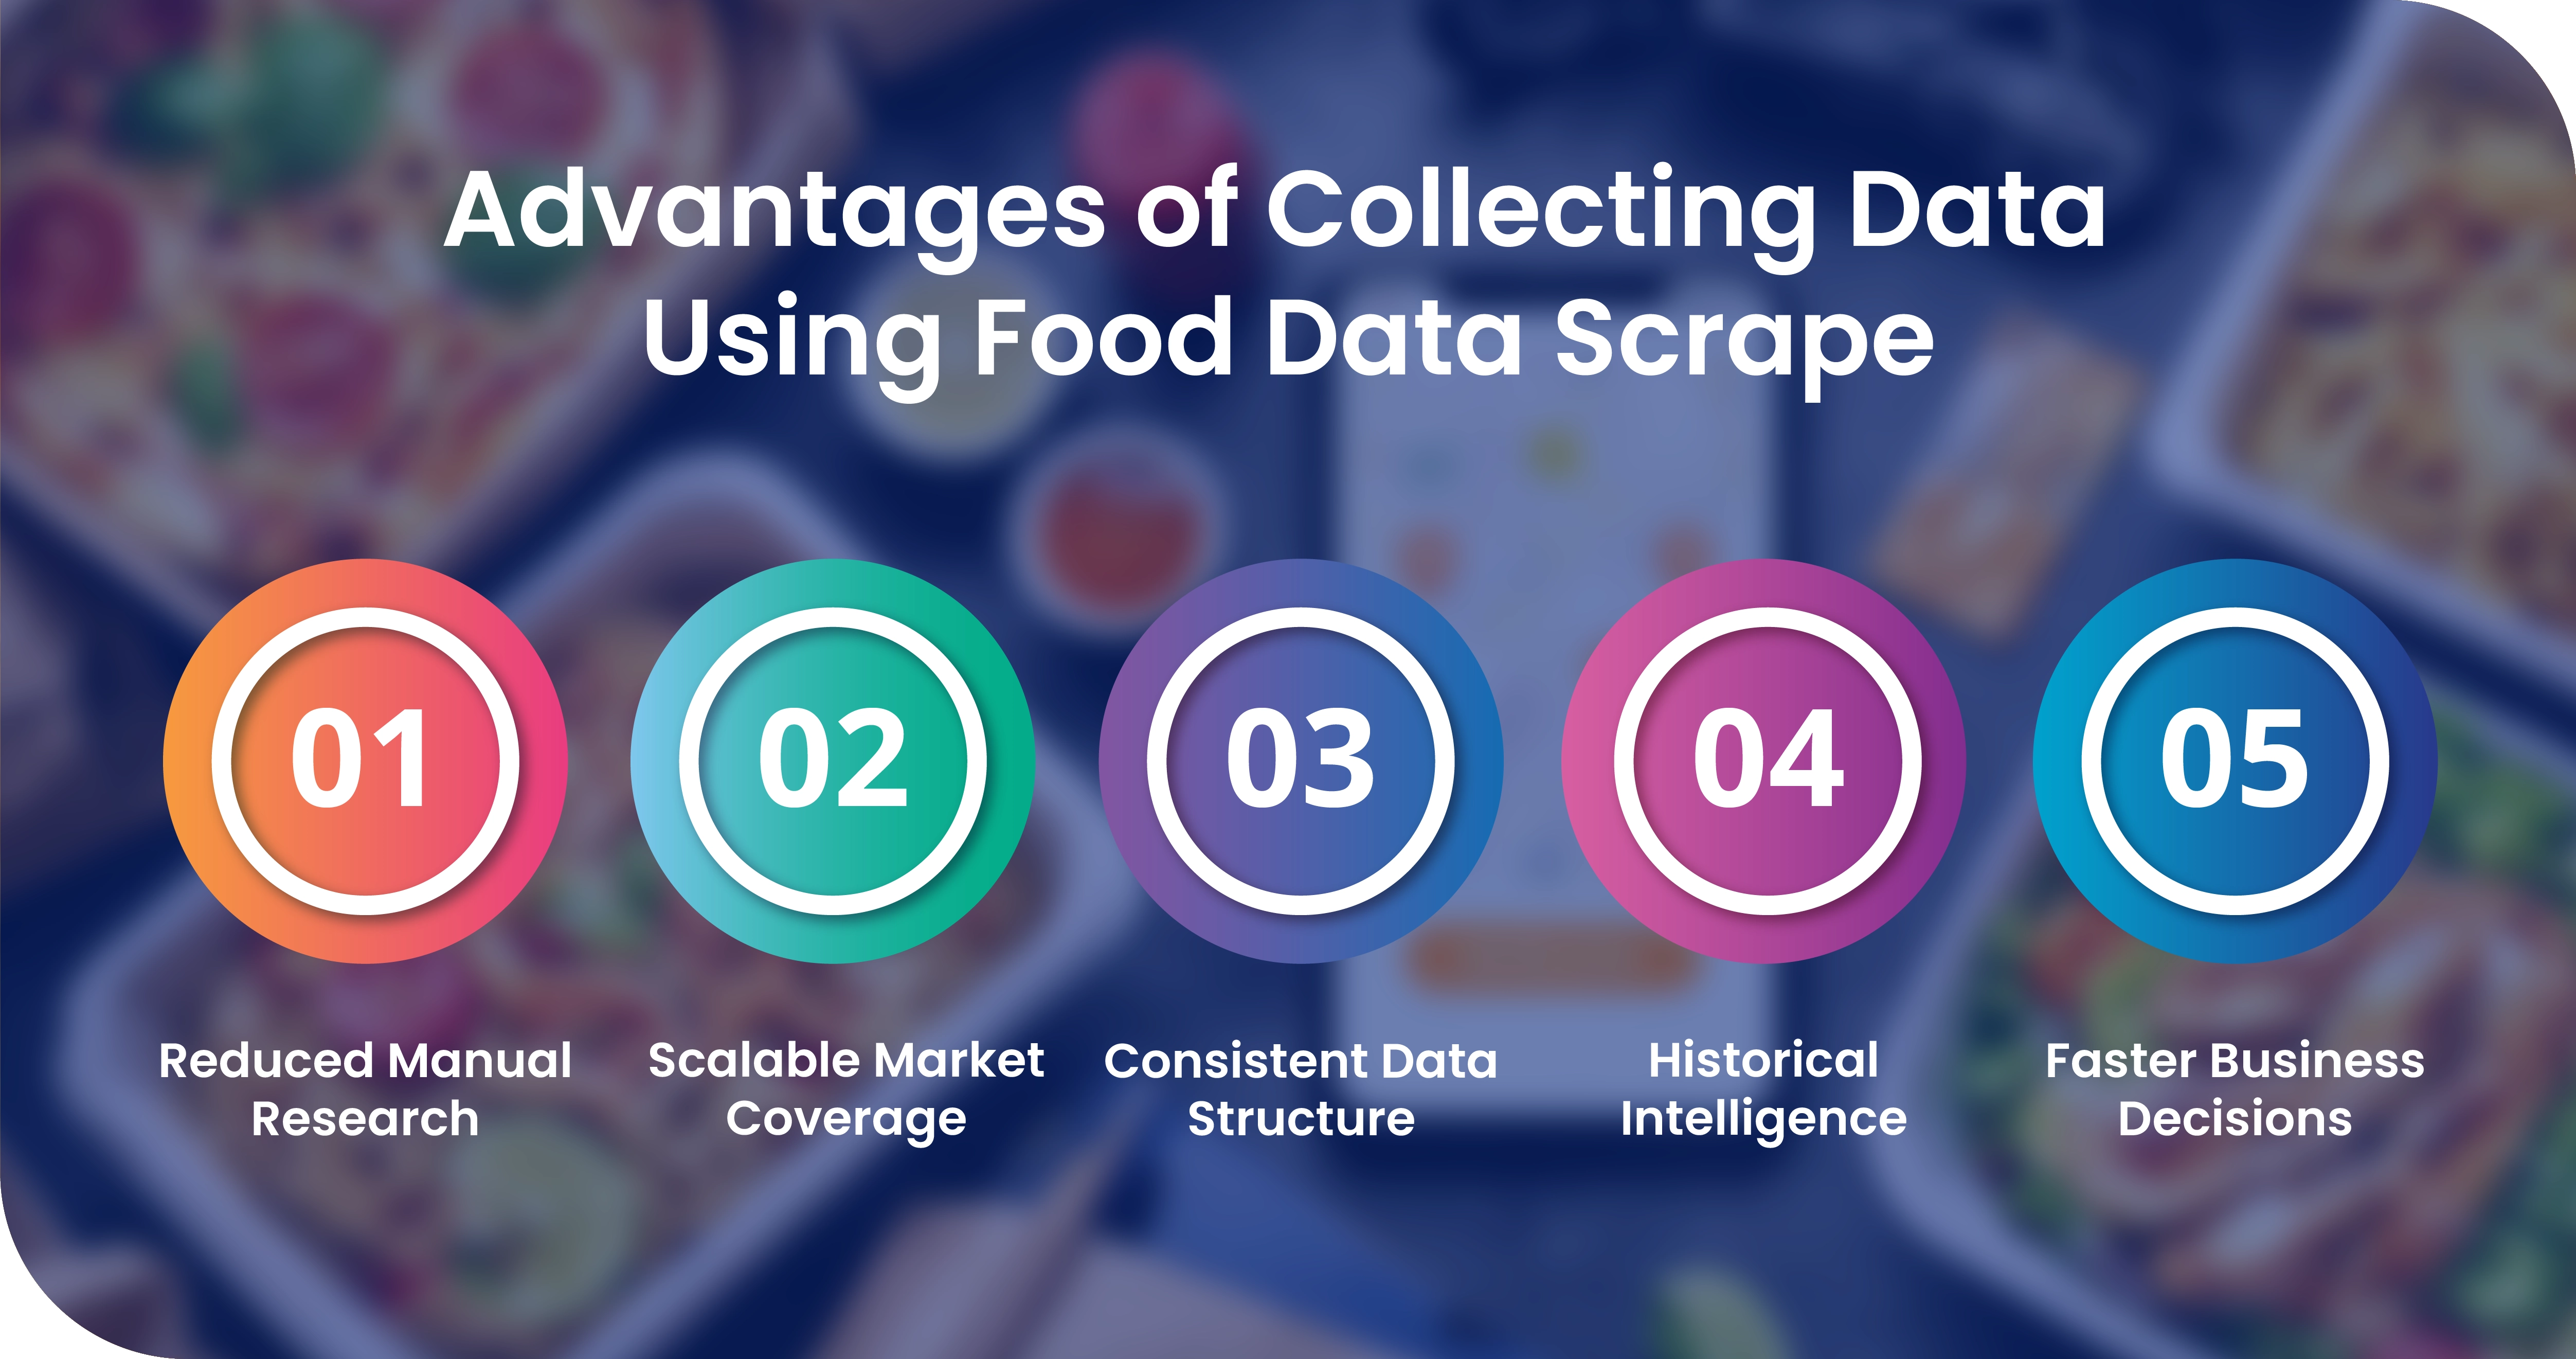
Advantages of Collecting Data Using Food Data Scrape
-
Reduced Manual Research
Food Data Scrape reduces the need for repetitive manual collection across numerous restaurant and delivery pages. Structured extraction allows analysts to receive organized information more efficiently, freeing internal teams to focus on interpretation, reporting, strategy development, and operational decision-making. -
Scalable Market Coverage
Automated collection enables businesses to expand coverage across restaurants, cities, cuisines, and platforms without proportionally increasing manual research requirements. This makes it easier to develop broader competitive datasets and establish consistent delivery benchmarks across multiple geographic markets. -
Consistent Data Structure
Standardized datasets provide consistent field structures across different sources. Restaurant names, delivery estimates, timestamps, locations, and platform identifiers can be organized systematically, making the resulting information easier to compare, process, visualize, and integrate into existing analytical environments. -
Historical Intelligence
Recurring data collection creates a historical record of delivery performance. Businesses can use these records to identify trends, evaluate changes, detect recurring delays, understand seasonal patterns, and determine whether observed performance improvements or declines are temporary or persistent. -
Faster Business Decisions
Reliable structured delivery data enables analysts to reach insights faster. Instead of spending substantial time gathering information, teams can concentrate on comparing performance, identifying competitive opportunities, evaluating marketplace partners, optimizing operations, and supporting strategic decisions with measurable evidence.
Client's Testimonial
"Food Data Scrape provided exactly the structured delivery intelligence our analysts needed. Before this project, comparing delivery estimates across platforms required significant manual effort and produced inconsistent results. The standardized dataset made it much easier to evaluate restaurant performance, identify delivery gaps, and monitor changes over time. We particularly valued the consistent platform, restaurant, location, ETA, and timestamp fields because they simplified our reporting workflows. The recurring collection model also gave us a stronger historical foundation for competitive analysis. Overall, the project improved our research efficiency and helped our team make delivery performance a more measurable component of our market intelligence strategy."
—Director of Data Intelligence, Food-Tech Analytics Company
Final Outcome
The project successfully transformed fragmented delivery information into a structured and scalable intelligence dataset. The client gained standardized restaurant, platform, location, ETA, timestamp, and performance information that could be used for detailed benchmarking. Analysts were able to identify delivery differences between platforms, evaluate promised versus observed estimates, recognize peak-period delays, and compare geographic performance. Recurring collection also created a historical foundation for tracking changes and identifying emerging trends. Data validation improved consistency and reduced the manual preparation required before analysis. The resulting framework supported competitive intelligence, restaurant partner evaluation, marketplace assessment, customer experience planning, and operational research. Most importantly, the client gained a repeatable methodology for continuously collecting delivery intelligence and converting it into measurable insights for strategic and data-driven decision-making.



