
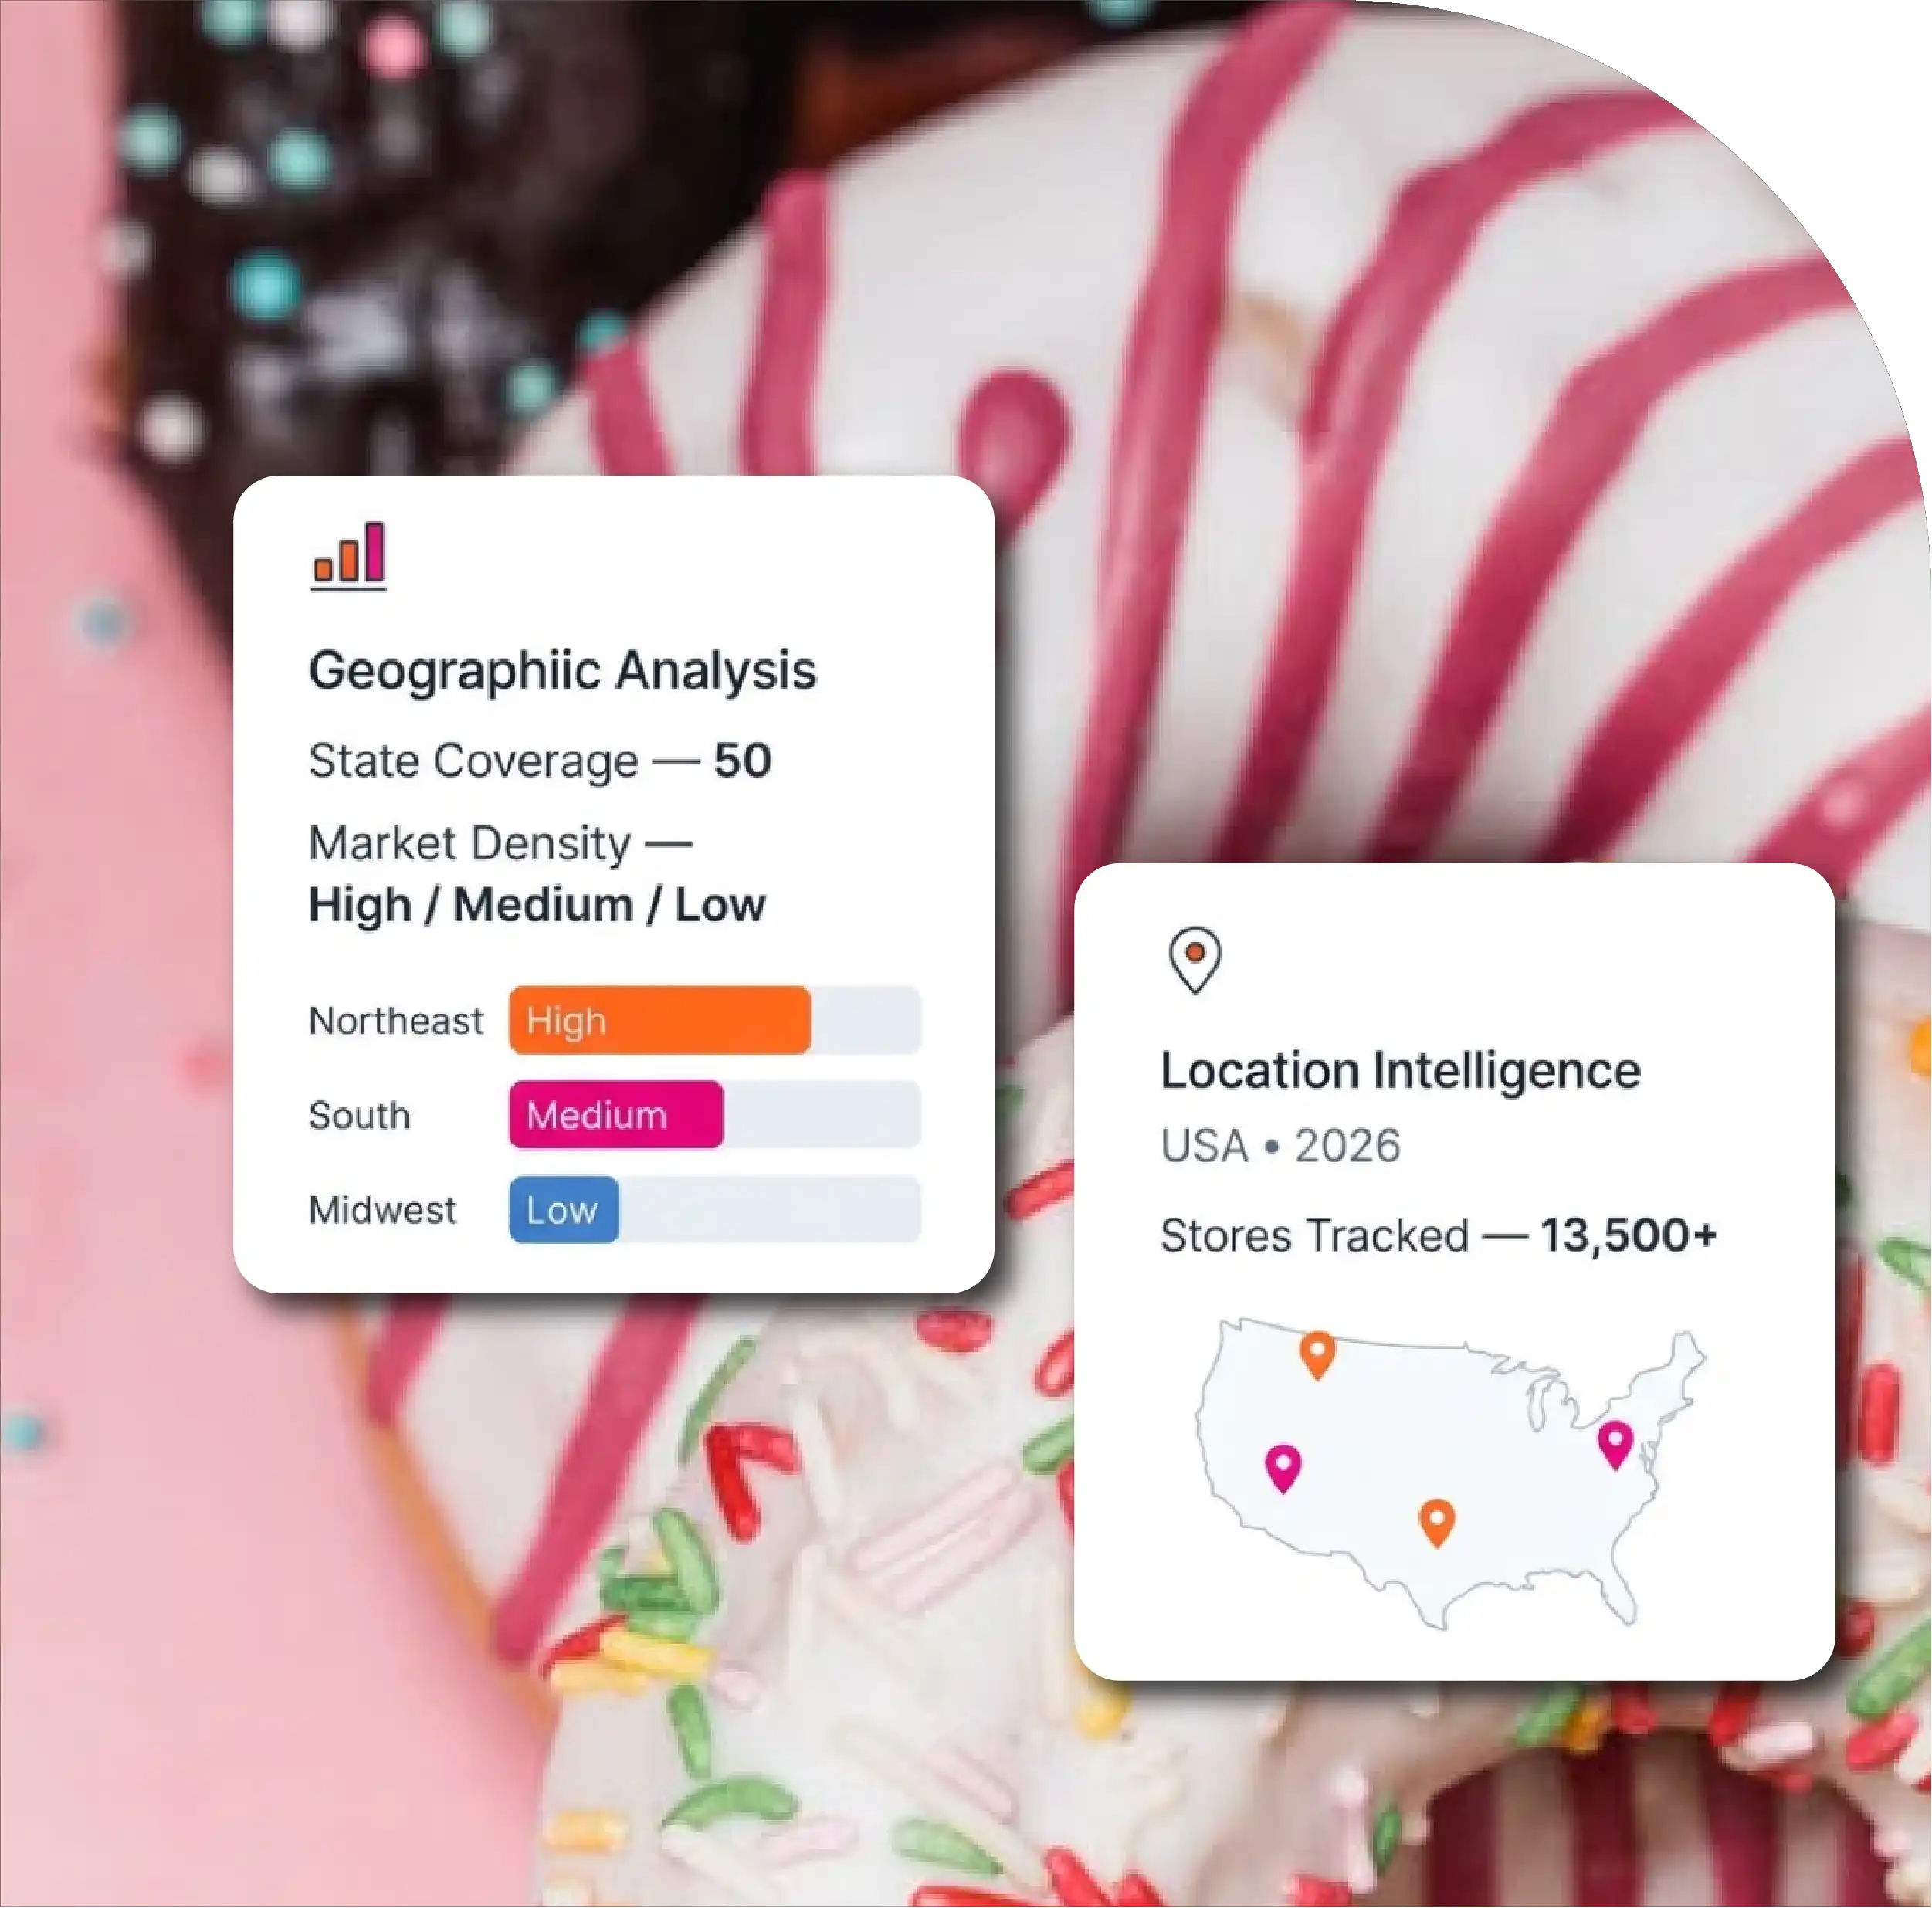
10,135 Locations — Dunkin operates 10,135 U.S. locations as of July 15, 2026.
1,449 New York Stores — New York represents approximately 14% of Dunkin's U.S. network.
44 States Covered — Dunkin locations span 44 states and territories across America.
3,452 Cities — The network provides extensive coverage across thousands of U.S. cities.
3.78 Average Rating — Dunkin locations record an average rating based on 2.58 million reviews.

The United States continues to represent one of the world's most competitive foodservice markets, where store density, geographic expansion, customer ratings, and local market coverage provide valuable signals for restaurant and retail intelligence. As of July 15, 2026, the United States has 10,135 Dunkin Donuts locations, distributed across 44 states and territories and approximately 3,452 cities. This makes structured location intelligence particularly valuable for businesses analyzing restaurant networks, market penetration, expansion opportunities, and competitive positioning. Dunkin' Donuts Locations Data Scraping In USA 2026 provides a structured view of this extensive restaurant footprint, including store names, addresses, cities, states, ZIP codes, phone numbers, geographic coordinates, and update dates.
The dataset also supports Dunkin' Store Location Data Scraping 2026, enabling analysts to examine where stores are concentrated and how the brand's physical presence differs between major markets. New York leads the country with 1,449 locations, representing approximately 14% of the total U.S. network. Massachusetts follows with 1,030 stores, while Florida has 935. These three markets alone account for more than 3,400 locations, highlighting significant geographic concentration.
Another important application is Dunkin' Restaurant Market Data Scraping, which can help businesses evaluate location density, regional demand, population coverage, and competitive saturation. When combined with demographic, geographic, review, and competitor information, restaurant location datasets can become a powerful foundation for market-entry and expansion analysis.
Dunkin's 10,135-store U.S. network demonstrates a strong concentration in the Northeast while maintaining substantial coverage across the Southeast and Midwest. New York has the largest number of locations, followed by Massachusetts, Florida, New Jersey, Illinois, and Pennsylvania.
The difference between location count and population coverage is particularly important. Massachusetts has 1,030 Dunkin locations serving a population of approximately 6.89 million, resulting in one location for roughly every 6,692 people. Florida, despite having 935 locations, has approximately 21.48 million residents, creating a much higher population-per-location ratio of approximately 22,971.
This difference allows analysts to distinguish between absolute store presence and market penetration. A state with fewer stores may still represent a major expansion opportunity if population density, consumer demand, and competitive intensity support additional locations.
| Rank | State/Territory | Dunkin Locations | Share of U.S. Network | Population | Population per Location | Market Observation |
|---|---|---|---|---|---|---|
| 1 | New York | 1,449 | 14% | 19.45M | 13.43K | Largest store concentration |
| 2 | Massachusetts | 1,030 | 10% | 6.89M | 6.69K | Highest location density |
| 3 | Florida | 935 | 9% | 21.48M | 22.97K | Large expansion market |
| 4 | New Jersey | 858 | 8% | 8.88M | 10.35K | Strong Northeast penetration |
| 5 | Illinois | 725 | 7% | 12.67M | 17.48K | Major Midwest footprint |
| 6 | Pennsylvania | 680 | 7% | 12.80M | 18.83K | Broad regional coverage |
| 7 | Connecticut | 475 | 5% | 3.56M | 7.50K | Very high store density |
| 8 | Maryland | 330 | 3% | 6.05M | 18.32K | Established Mid-Atlantic market |
| 9 | Georgia | 318 | 3% | 10.62M | 33.39K | Lower relative penetration |
| 10 | Ohio | 313 | 3% | 11.69M | 37.34K | Potential whitespace |
| Total | Top 10 | 7,113 | 70% | --- | --- | Concentrated market footprint |
The top ten states collectively account for approximately 7,113 locations, or around 70% of the total U.S. network. This concentration demonstrates that Dunkin's footprint is not evenly distributed across the country.
City-level analysis provides another layer of insight. Chicago has the highest number of Dunkin locations, with 204 stores. New York follows with 169, while Brooklyn has 134 and Philadelphia has 127.
The concentration across New York metropolitan locations is especially notable. New York City, Brooklyn, Bronx, and Staten Island together contribute hundreds of locations, demonstrating how urban population density and commuter traffic can support large restaurant networks.
Extract Dunkin' Restaurant Location Data to help businesses transform individual store records into structured geographic datasets for city-level comparisons. Latitude and longitude fields can also support mapping, territory analysis, proximity calculations, and site-selection models.
| Rank | City | State | Locations | Approx. Share of U.S. Network | Primary Intelligence Use |
|---|---|---|---|---|---|
| 1 | Chicago | Illinois | 204 | 2.01% | Urban market analysis |
| 2 | New York | New York | 169 | 1.67% | Metro density analysis |
| 3 | Brooklyn | New York | 134 | 1.32% | Neighborhood coverage |
| 4 | Philadelphia | Pennsylvania | 127 | 1.25% | Regional competition |
| 5 | Bronx | New York | 96 | 0.95% | Urban penetration |
| 6 | Boston | Massachusetts | 60 | 0.59% | Dense-market analysis |
| 7 | Baltimore | Maryland | 48 | 0.47% | Mid-Atlantic coverage |
| 8 | Orlando | Florida | 47 | 0.46% | Tourism-market coverage |
| 9 | Staten Island | New York | 41 | 0.40% | Local market density |
| 10 | Miami | Florida | 37 | 0.36% | Southeast expansion analysis |
Dunkin's network extends across 45 states and territories, while 12 states and territories in the supplied dataset have no locations. These include Washington, Oregon, Montana, Guam, U.S. Virgin Islands, Northern Mariana Islands, North Dakota, Idaho, Puerto Rico, Alaska, South Dakota, and American Samoa.
Geographic gaps do not automatically indicate expansion opportunities. Population, purchasing power, real estate costs, transportation patterns, consumer preferences, existing competitors, and franchise economics must also be considered. Nevertheless, mapping areas with no stores against demographic and commercial datasets can reveal potential whitespace markets.
This is where Dunkin Donuts Location Intelligence becomes valuable. Instead of examining store counts independently, analysts can combine location records with population, competitor density, customer ratings, traffic patterns, and local economic indicators to create a more comprehensive market view.
Competitive benchmarking provides another important application of restaurant location datasets. In the supplied comparison, Subway has 20,122 U.S. locations, Starbucks has 16,909, McDonald's has 13,882, Hunt Brothers Pizza has 11,541, and Taco Bell has 8,248.
Dunkin's 10,135 locations therefore place it above Taco Bell in total U.S. location count while remaining below several larger national restaurant networks. Comparing the number of locations, states, and cities gives businesses a practical way to evaluate geographic reach.
For example, Subway operates in 51 states and territories and approximately 6,594 cities, compared with Dunkin's 44 states and territories and 3,452 cities. Starbucks operates across 52 states and territories and 3,858 cities. Such differences demonstrate why geographic breadth should be analyzed alongside raw store counts.
US Food Chain Location Data Scraping allows analysts to standardize restaurant location information across competing brands and create comparable market coverage datasets.
Location datasets can also be enriched with customer review information to evaluate store-level performance. The supplied data indicates an average Dunkin rating of 3.78 based on more than 2.58 million customer reviews. Approximately 67.91% of customer feedback is classified as high satisfaction, while 19.84% represents poor feedback.
The highest-rated locations in the supplied sample include stores in Dayton, Tucson, Lawrenceburg, and El Paso, with ratings reaching 4.4. Meanwhile, some locations record substantially lower scores, including a 1.7-rated store in Aberdeen, Maryland.
This variation shows why geographic coverage alone does not provide a complete picture of restaurant performance. A market may have a large number of stores but still contain significant differences in customer experience between individual locations.
A comprehensive Dunkin dataset can contain fields such as store name, street address, city, state, ZIP code, telephone number, latitude, longitude, country, and last updated date. The supplied sample records demonstrate how these fields can be organized into a standardized database.
Businesses can use this structured information for territory mapping, competitor benchmarking, franchise research, market expansion, lead generation, location scoring, and geographic visualization.
Food Data Scraping in the USA extends this concept beyond individual restaurant brands. A broader dataset can incorporate multiple restaurant chains, delivery platforms, menus, prices, reviews, categories, locations, and availability information to create a more complete food-market intelligence environment.
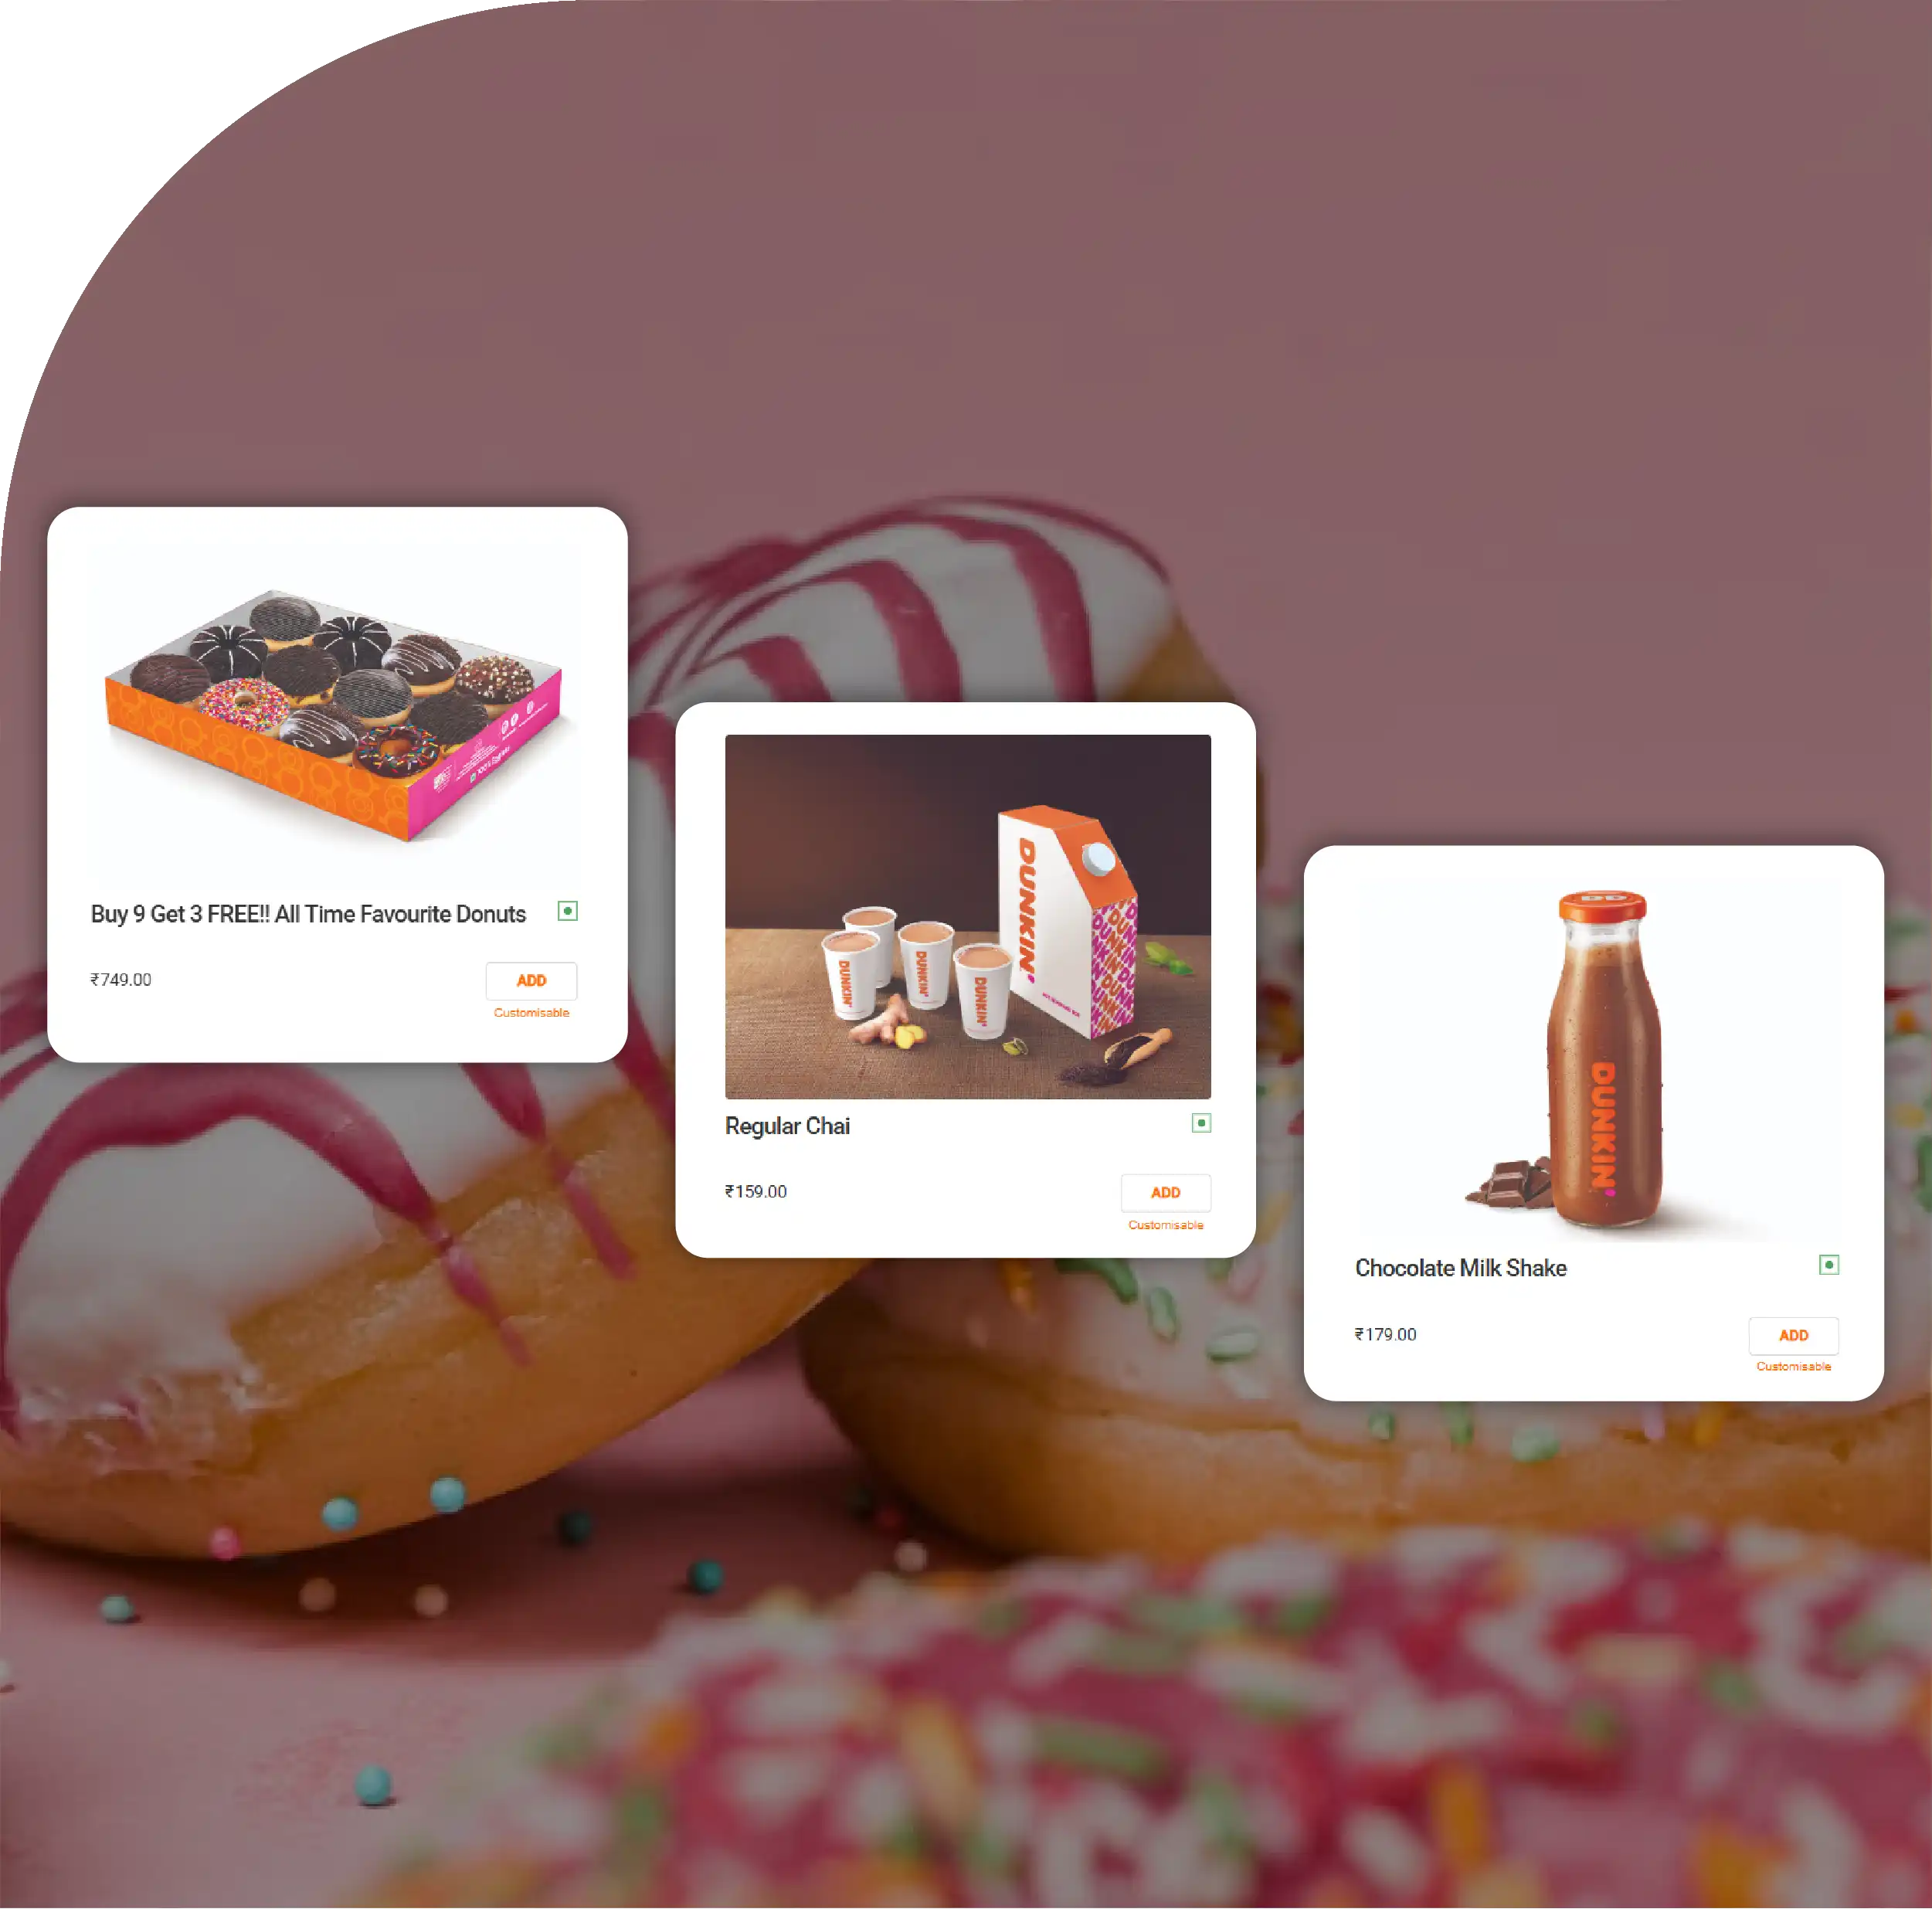
Location intelligence can become significantly more valuable when combined with menu information. Restaurant Menu Data Scraping can provide structured information about menu items, categories, prices, descriptions, promotions, and product availability.
When location and menu datasets are analyzed together, businesses can compare product assortment by geography, identify regional menu differences, track pricing patterns, and understand how restaurant offerings vary between markets.
The next stage involves applying machine learning and automated analytics. AI Restaurant Intelligence can help identify patterns across store networks, customer sentiment, pricing, menu assortment, and competitive coverage. Predictive models can potentially support store expansion analysis, demand forecasting, location scoring, and restaurant performance benchmarking.
The 2026 Dunkin' Donuts U.S. location dataset provides a detailed snapshot of a 10,135-store restaurant network with substantial concentration across New York, Massachusetts, Florida, New Jersey, Illinois, and Pennsylvania. City-level analysis further highlights major markets such as Chicago, New York, Brooklyn, and Philadelphia, while uncovered states and territories present areas for deeper market evaluation.
Combining location, geographic, competitive, review, menu, and pricing datasets creates a much broader restaurant intelligence framework. Food Data Scraping can support this framework by bringing together structured information from multiple foodservice sources for ongoing analysis.
Businesses can also Extract Dunkin' Donuts Menu Prices Data to study product-level pricing, menu assortment, regional variations, and competitive positioning. Finally, Starbucks vs Dunkin' Donuts Data Scraping can provide a direct framework for comparing store coverage, geographic penetration, menus, prices, ratings, and market expansion patterns.
Overall, Dunkin's extensive U.S. footprint demonstrates the value of structured restaurant datasets. As foodservice competition becomes increasingly data-driven, continuously updated location and market intelligence can help businesses identify geographic opportunities, benchmark competitors, understand customer behavior, and make more informed strategic decisions.
If you are seeking for a reliable data scraping services, Food Data Scrape is at your service. We hold prominence in Food Data Aggregator and Mobile Restaurant App Scraping with impeccable data analysis for strategic decision-making.