

The Energy Bar Trends Data Scraping 2026 report provides detailed insights into market growth, consumer preferences, ingredient innovations, pricing movements, and competitive developments shaping the energy bar industry. The report analyzes digital data from retailers, eCommerce platforms, brand websites, menus, and consumer discussions to identify emerging opportunities. It highlights the increasing demand for high-protein, plant-based, functional, and clean-label energy bars while examining changing dietary preferences and purchasing behaviors. Businesses can leverage these insights to improve product development, optimize pricing strategies, understand consumer needs, and forecast future demand. The report supports food manufacturers, retailers, and market researchers in making data-driven decisions by providing real-time visibility into category trends, product performance, and evolving consumer expectations.
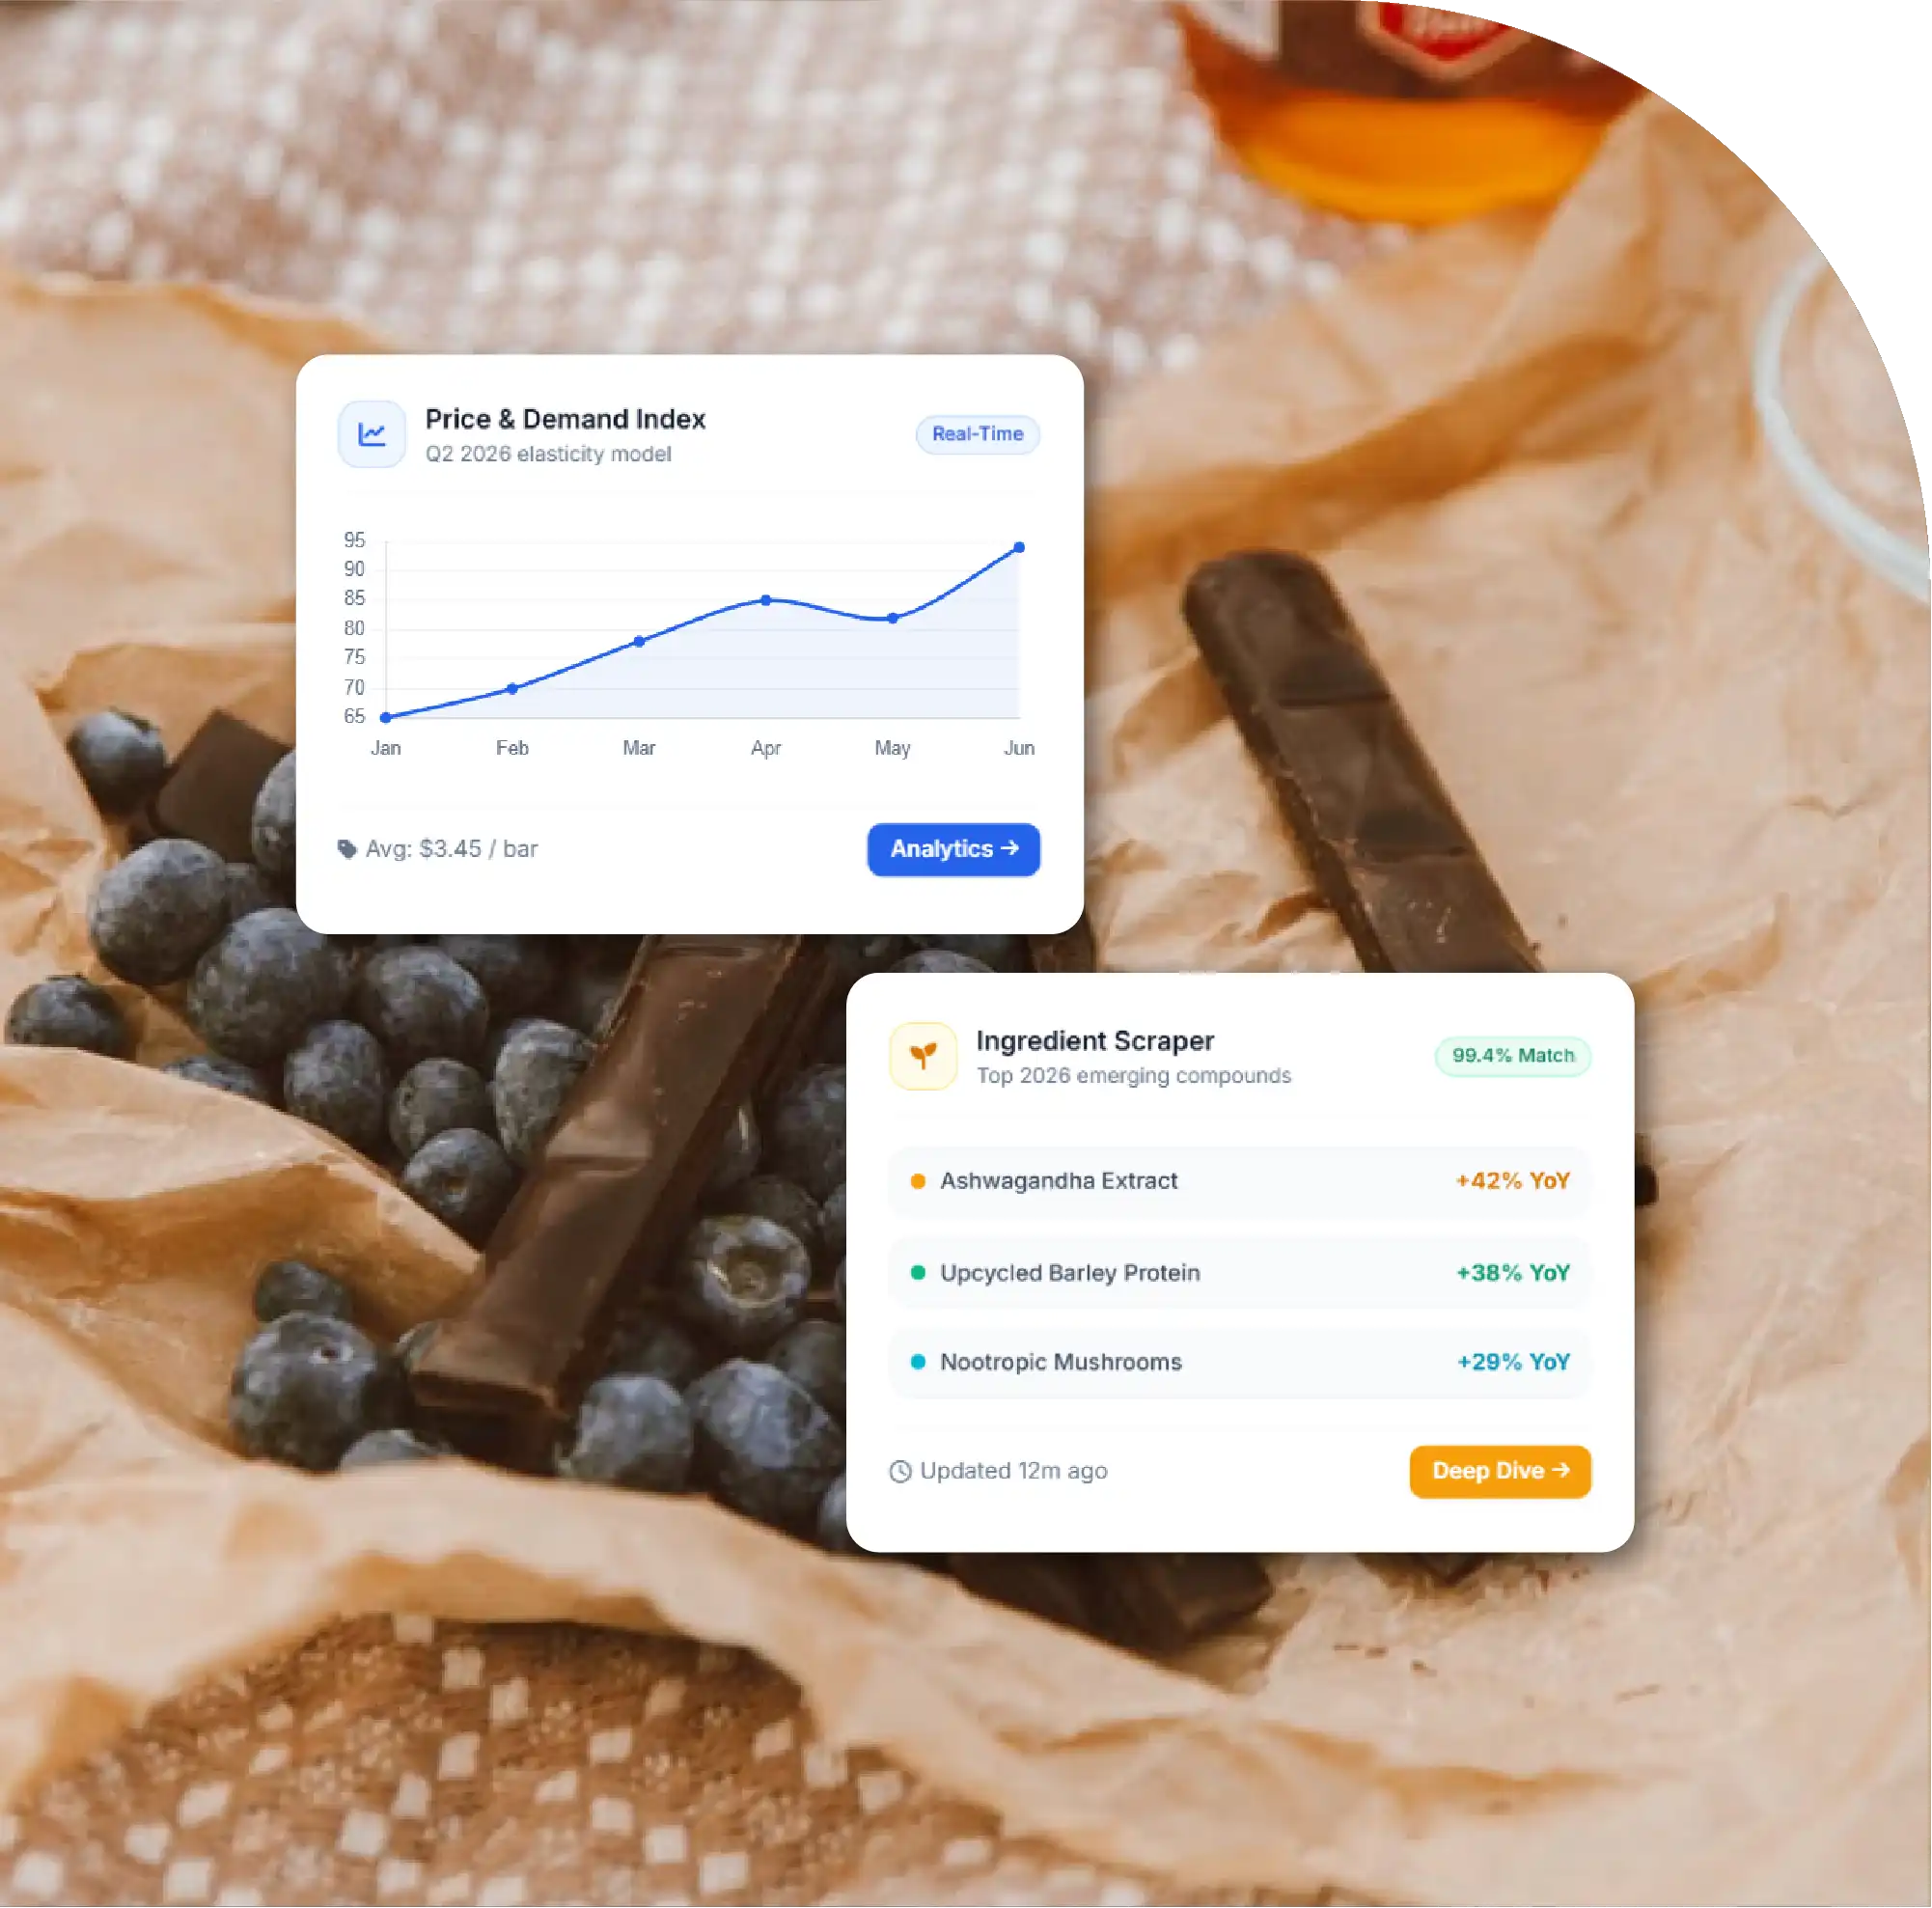
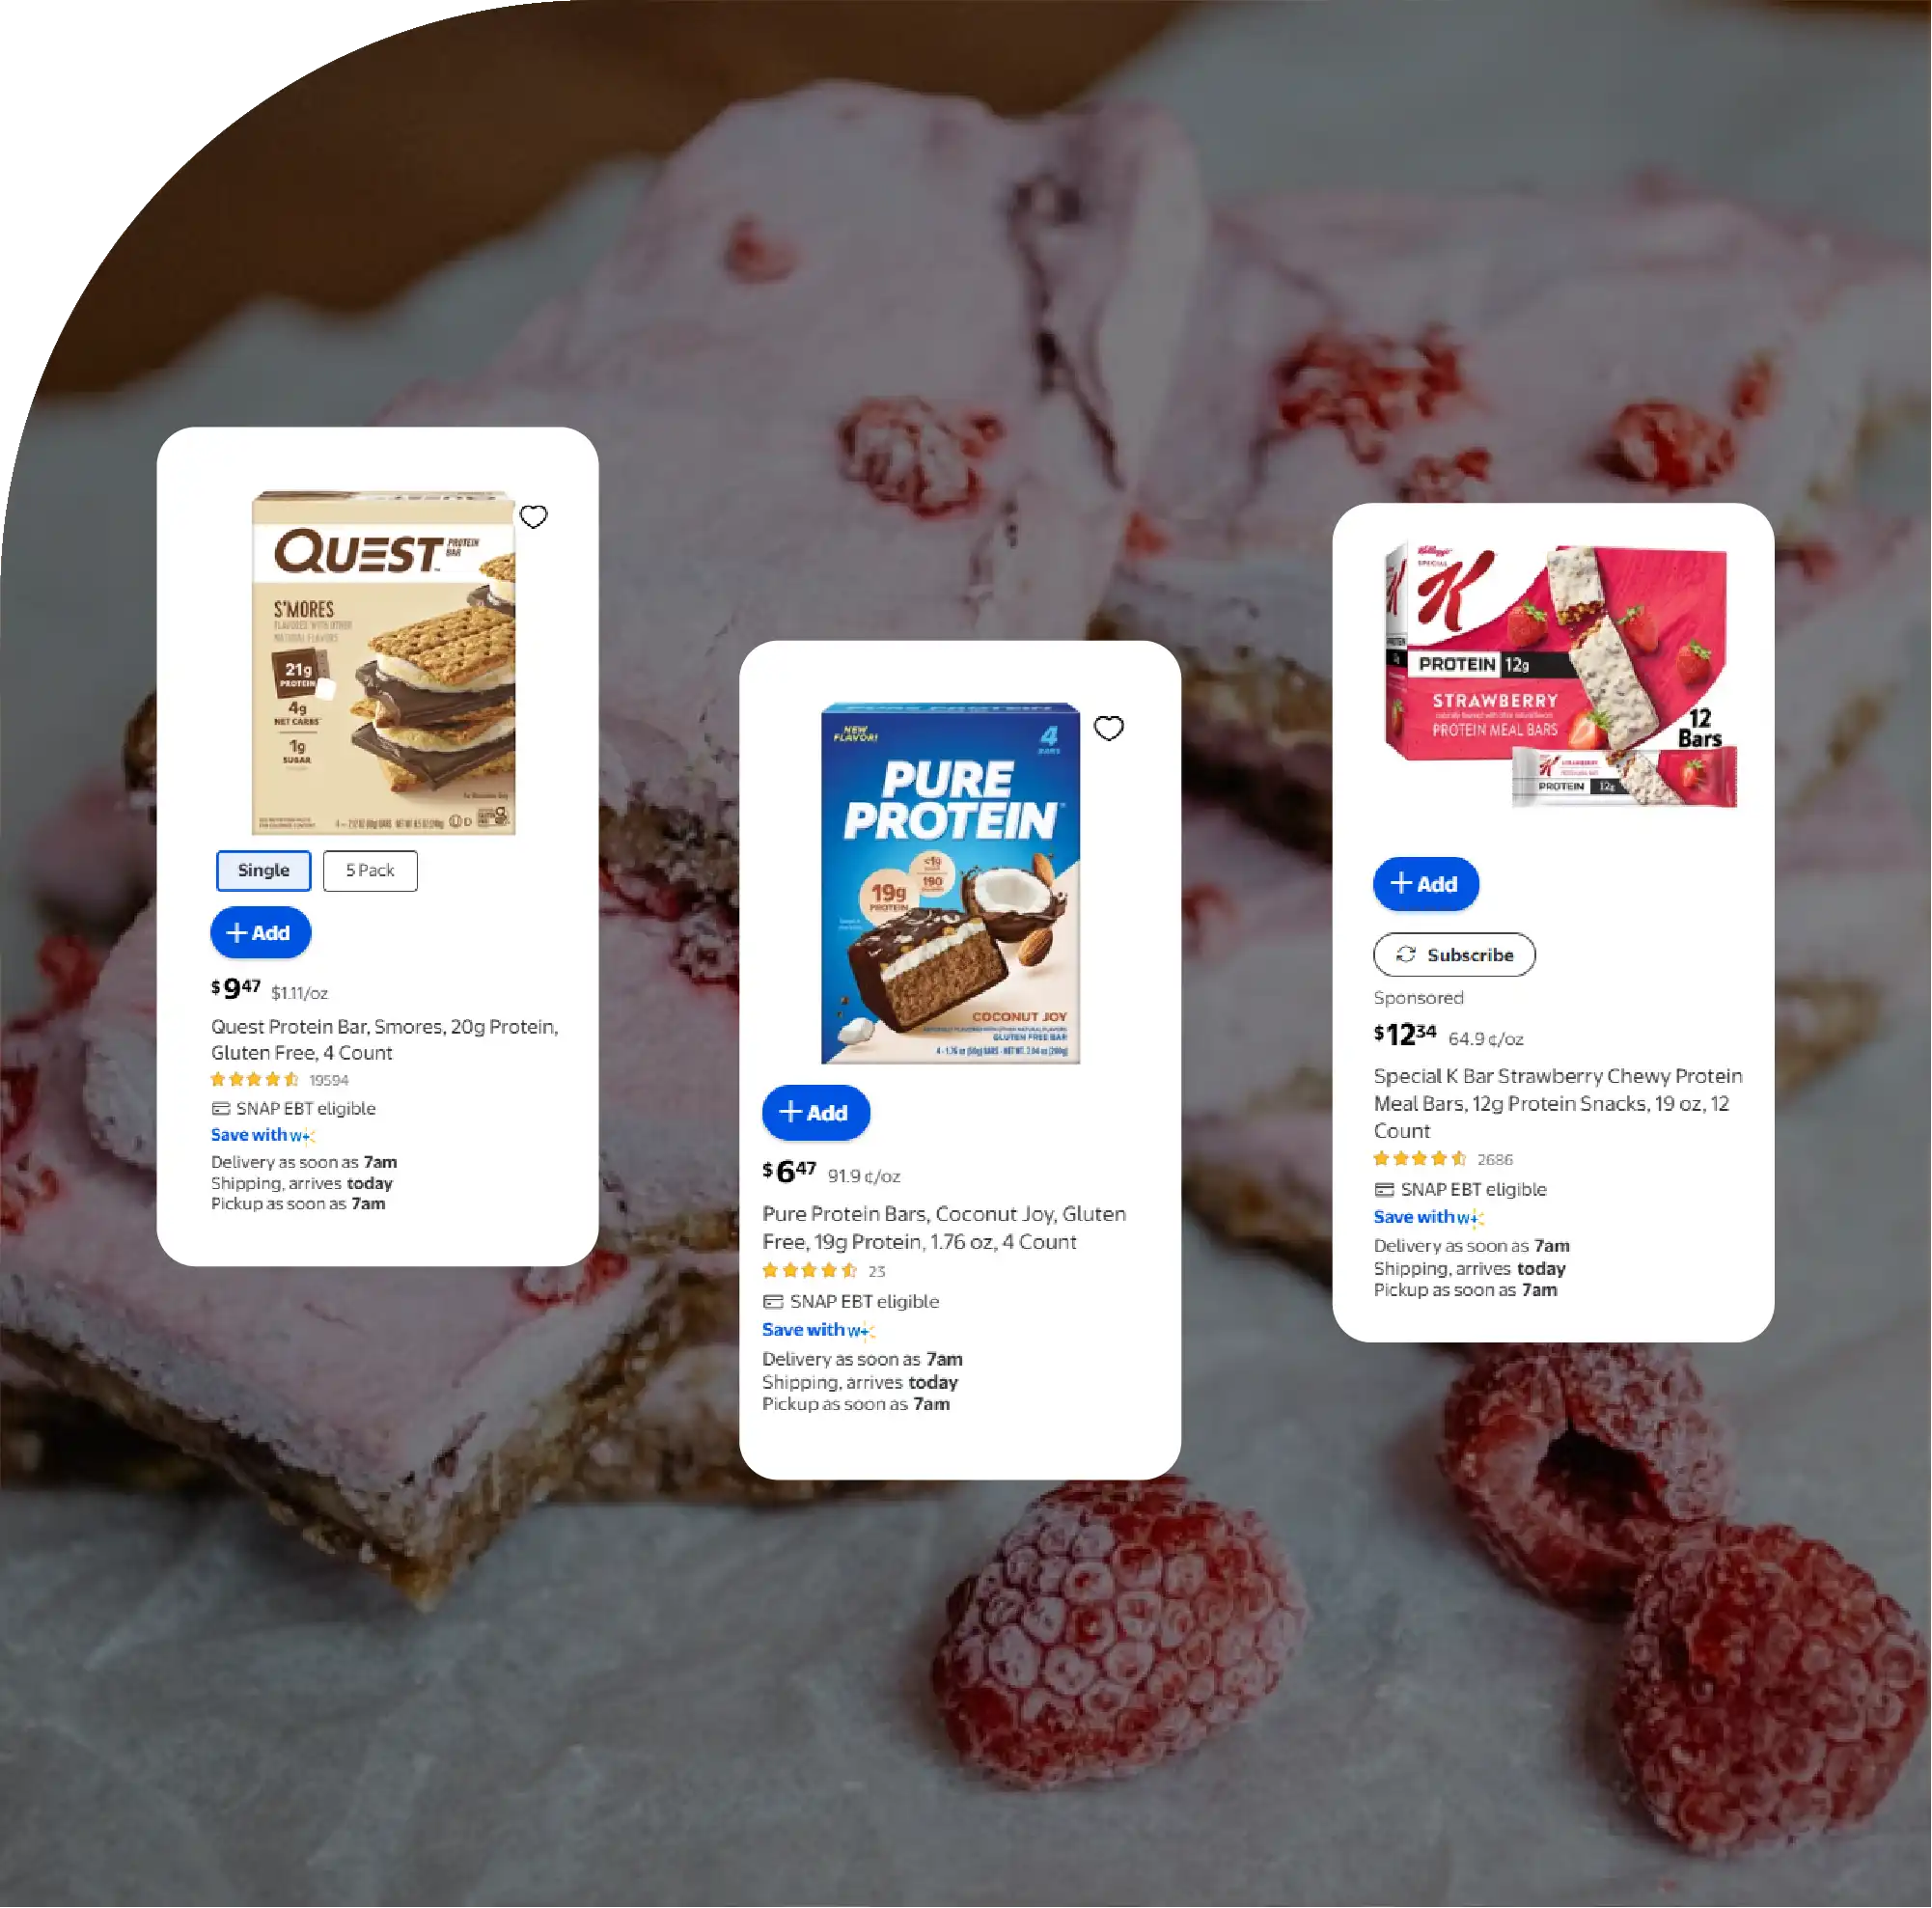
Market Growth
Energy bar category expands through wellness-driven consumer adoption.
Consumer Insights
Analyzes preferences, reviews, and purchasing behavior patterns.
Ingredient Trends
Tracks proteins, flavors, and functional ingredient innovations.
Pricing Analysis
Monitors competitor pricing and promotional strategies.
Demand Forecast
Predicts future market opportunities using analytics.

The global energy bar industry is undergoing significant transformation in 2026 as consumers increasingly prioritize convenient nutrition, functional benefits, and healthier snacking alternatives. Once considered primarily a fitness product, energy bars have expanded into mainstream food categories, attracting athletes, professionals, students, travelers, and wellness-focused consumers. The growing demand for protein-rich, low-sugar, plant-based, and functional snacks has encouraged brands to continuously develop innovative formulations that address specific nutritional requirements.
With rapid changes in consumer preferences and increasing competition across retail channels, businesses require accurate and continuous market visibility. Energy Bar Trends Data Scraping 2026 enables food manufacturers, retailers, ingredient suppliers, and research organizations to collect structured information from digital sources such as online grocery stores, eCommerce marketplaces, restaurant menus, brand websites, and consumer platforms. This approach helps companies analyze product innovation, ingredient adoption, pricing movements, customer preferences, and competitive strategies with improved accuracy.
Companies that Scrape Energy Bar Trends 2026 can identify emerging market opportunities by monitoring real-time changes in product launches, flavor preferences, nutritional claims, customer reviews, and regional demand patterns. Instead of depending only on traditional market studies, businesses can use continuously updated datasets to make faster decisions related to product development, marketing strategies, and category expansion.
The energy bar segment is increasingly influenced by health-conscious consumers who seek products offering sustained energy, improved performance, and targeted wellness benefits. Brands are now introducing products focused on immunity support, digestive health, cognitive performance, weight management, and recovery nutrition. This evolution has created a competitive environment where understanding consumer behavior and market movement has become essential for long-term success.
The energy bar market in 2026 reflects a shift from basic snack consumption toward personalized nutrition. Consumers are evaluating products based on ingredient transparency, nutritional value, functional benefits, and alignment with individual dietary lifestyles. Clean-label formulations, sustainable sourcing, and innovative ingredient combinations are becoming important purchase drivers.
Retailers and online marketplaces have expanded their energy bar categories significantly, offering hundreds of variations based on protein levels, flavors, dietary adaptations, and health claims. Monitoring these changes manually across multiple platforms is challenging, making automated data collection increasingly valuable.
Through Energy Bar Pricing Data Scraping, organizations can analyze price variations across supermarkets, online retailers, and direct-to-consumer platforms. This information allows brands to evaluate competitor pricing strategies, identify promotional patterns, understand regional price differences, and optimize their own pricing decisions.
Energy bar market research depends on collecting information from multiple digital ecosystems. Grocery platforms provide valuable insights into product availability, pricing, package sizes, customer ratings, and promotional activities. Online marketplaces reveal consumer demand through bestseller rankings, reviews, product visibility, and purchasing trends.
Brand websites contribute detailed information about ingredients, certifications, nutritional profiles, product launches, and sustainability initiatives. Restaurant and café menus provide additional insights into how nutrition bars are positioned within healthy food offerings, breakfast menus, and convenience snack categories.
Consumer conversations across digital communities provide early signals about changing preferences. Social discussions, product reviews, and online feedback reveal consumer opinions regarding taste, texture, ingredient quality, packaging, and overall satisfaction.
Combining these sources creates comprehensive Energy Bar Market Intelligence that helps organizations understand market performance beyond basic sales numbers. Businesses can identify why certain products succeed, which ingredients attract attention, and what improvements consumers expect from future products.
Ingredient innovation remains one of the strongest growth factors within the energy bar industry. Manufacturers are increasingly experimenting with plant-based proteins, natural sweeteners, functional botanicals, and nutrient-dense ingredients to differentiate their products.
Protein continues to be a major category driver, with brands introducing bars containing pea protein, whey protein, brown rice protein, pumpkin seed protein, and other alternative protein sources. Consumers are also showing increasing interest in ingredients such as almonds, oats, chia seeds, flaxseed, coconut, dates, dark chocolate, and nut butters.
Functional ingredients are becoming more prominent as consumers look beyond basic nutrition. Products containing adaptogens, probiotics, superfoods, and botanical extracts are gaining attention due to rising awareness around holistic wellness.
Flavor innovation is also accelerating as brands move beyond traditional chocolate and peanut butter combinations. New flavor concepts include salted caramel, chocolate sea salt, matcha coconut, lemon blueberry, coffee mocha, apple cinnamon, and tropical fruit blends.
The following dataset represents a sample market intelligence framework showing how businesses can evaluate category performance using structured information collected from multiple digital channels.
| Market Performance Indicators | Q1 2026 | Q2 2026 | Q3 2026 | Q4 2026 Forecast |
|---|---|---|---|---|
| Energy Bar Products Monitored | 14,250 | 15,860 | 17,420 | 19,100 |
| New Product Launches | 185 | 230 | 278 | 340 |
| Average Product Price (USD) | 2.42 | 2.49 | 2.57 | 2.65 |
| Consumer Reviews Analyzed | 520,000 | 640,000 | 785,000 | 950,000 |
| Retail Platforms Covered | 240 | 275 | 315 | 360 |
| High Protein Product Share (%) | 48% | 54% | 61% | 67% |
| Plant-Based Product Share (%) | 22% | 27% | 33% | 39% |
| Low Sugar Product Listings | 4,850 | 5,760 | 6,940 | 8,200 |
| Functional Ingredient Mentions | 8,900 | 11,400 | 14,200 | 17,500 |
| Average Consumer Rating | 4.21 | 4.27 | 4.33 | 4.38 |
Consumer expectations are reshaping the energy bar category by creating demand for products that provide specific health advantages. Fitness-focused consumers continue prioritizing protein and recovery benefits, while professionals increasingly choose energy bars as convenient meal replacements during busy schedules.
Parents are also showing greater interest in healthier snack options containing recognizable ingredients and reduced sugar levels. Meanwhile, travelers and outdoor consumers value portability, shelf stability, and sustained energy support.
Understanding these behavioral changes requires continuous monitoring of consumer discussions, purchasing patterns, and product interactions. The analysis of an Energy Bar Consumer Trend helps brands understand which nutritional benefits, flavors, and product claims influence buying decisions.
Modern food businesses require immediate visibility into changing market conditions. Traditional research methods often provide delayed insights, while digital data collection allows organizations to monitor developments as they occur.
Using Real-Time Energy Bar Market Analytics, companies can evaluate competitor movements, track new product introductions, measure consumer engagement, and identify fast-growing market segments. These insights support strategic decisions related to product positioning, inventory management, and promotional planning.
Predictive analysis based on historical sales patterns, seasonal changes, consumer interest, and competitive activity improves Energy Bar Demand forecasting. Companies can estimate future demand more accurately, reduce inventory risks, and optimize supply chain operations.
Dietary preferences continue to influence energy bar innovation. Consumers increasingly seek products aligned with vegan, gluten-free, keto-friendly, organic, dairy-free, and high-fiber lifestyles. Brands are responding by creating specialized products designed for specific health goals and dietary requirements.
The expansion of personalized nutrition has increased the importance of understanding niche consumer groups. Data-driven research allows companies to evaluate which dietary categories are growing, which ingredients are gaining acceptance, and how consumers respond to new formulations.
The following table highlights how brands can measure evolving consumer preferences and product innovation patterns.
| Consumer and Product Metrics | 2024 Data | 2025 Data | 2026 Data |
|---|---|---|---|
| Consumers Seeking Protein Benefits | 46% | 55% | 64% |
| Consumers Preferring Natural Ingredients | 58% | 67% | 76% |
| Plant-Based Energy Bar Demand | 21% | 29% | 38% |
| Low Sugar Product Interest | 34% | 43% | 55% |
| Functional Nutrition Searches | 5.8M | 7.6M | 10.2M |
| Online Energy Bar Purchases | 31% | 39% | 48% |
| Consumers Checking Labels Before Purchase | 54% | 65% | 74% |
| Premium Energy Bar Adoption | 28% | 36% | 45% |
| Repeat Purchase Rate | 45% | 53% | 61% |
| New Flavor Trial Interest | 41% | 52% | 68% |
The energy bar industry will continue expanding as consumers demand convenient products that combine taste, nutrition, and functional benefits. Future growth will be influenced by personalized wellness, sustainable ingredients, advanced formulations, and innovative product experiences.
Brands that continuously analyze Energy Bar Demand Trends will gain stronger market awareness and identify opportunities before competitors. By monitoring pricing changes, ingredient developments, consumer conversations, and product innovations, companies can improve decision-making and create products aligned with evolving expectations.
The integration of Specialty Diet Data Scraping will further support businesses in understanding dietary preferences such as vegan, gluten-free, keto, and functional nutrition categories. As the food industry becomes increasingly data-driven, automated intelligence will remain essential for developing successful products, optimizing market strategies, and maintaining competitive advantages within the rapidly evolving energy bar sector.



