Boo-st your food data. Save 20% on scraping services
Menus · Grocery · Alcohol · AI Intelligence, across 40+ countries

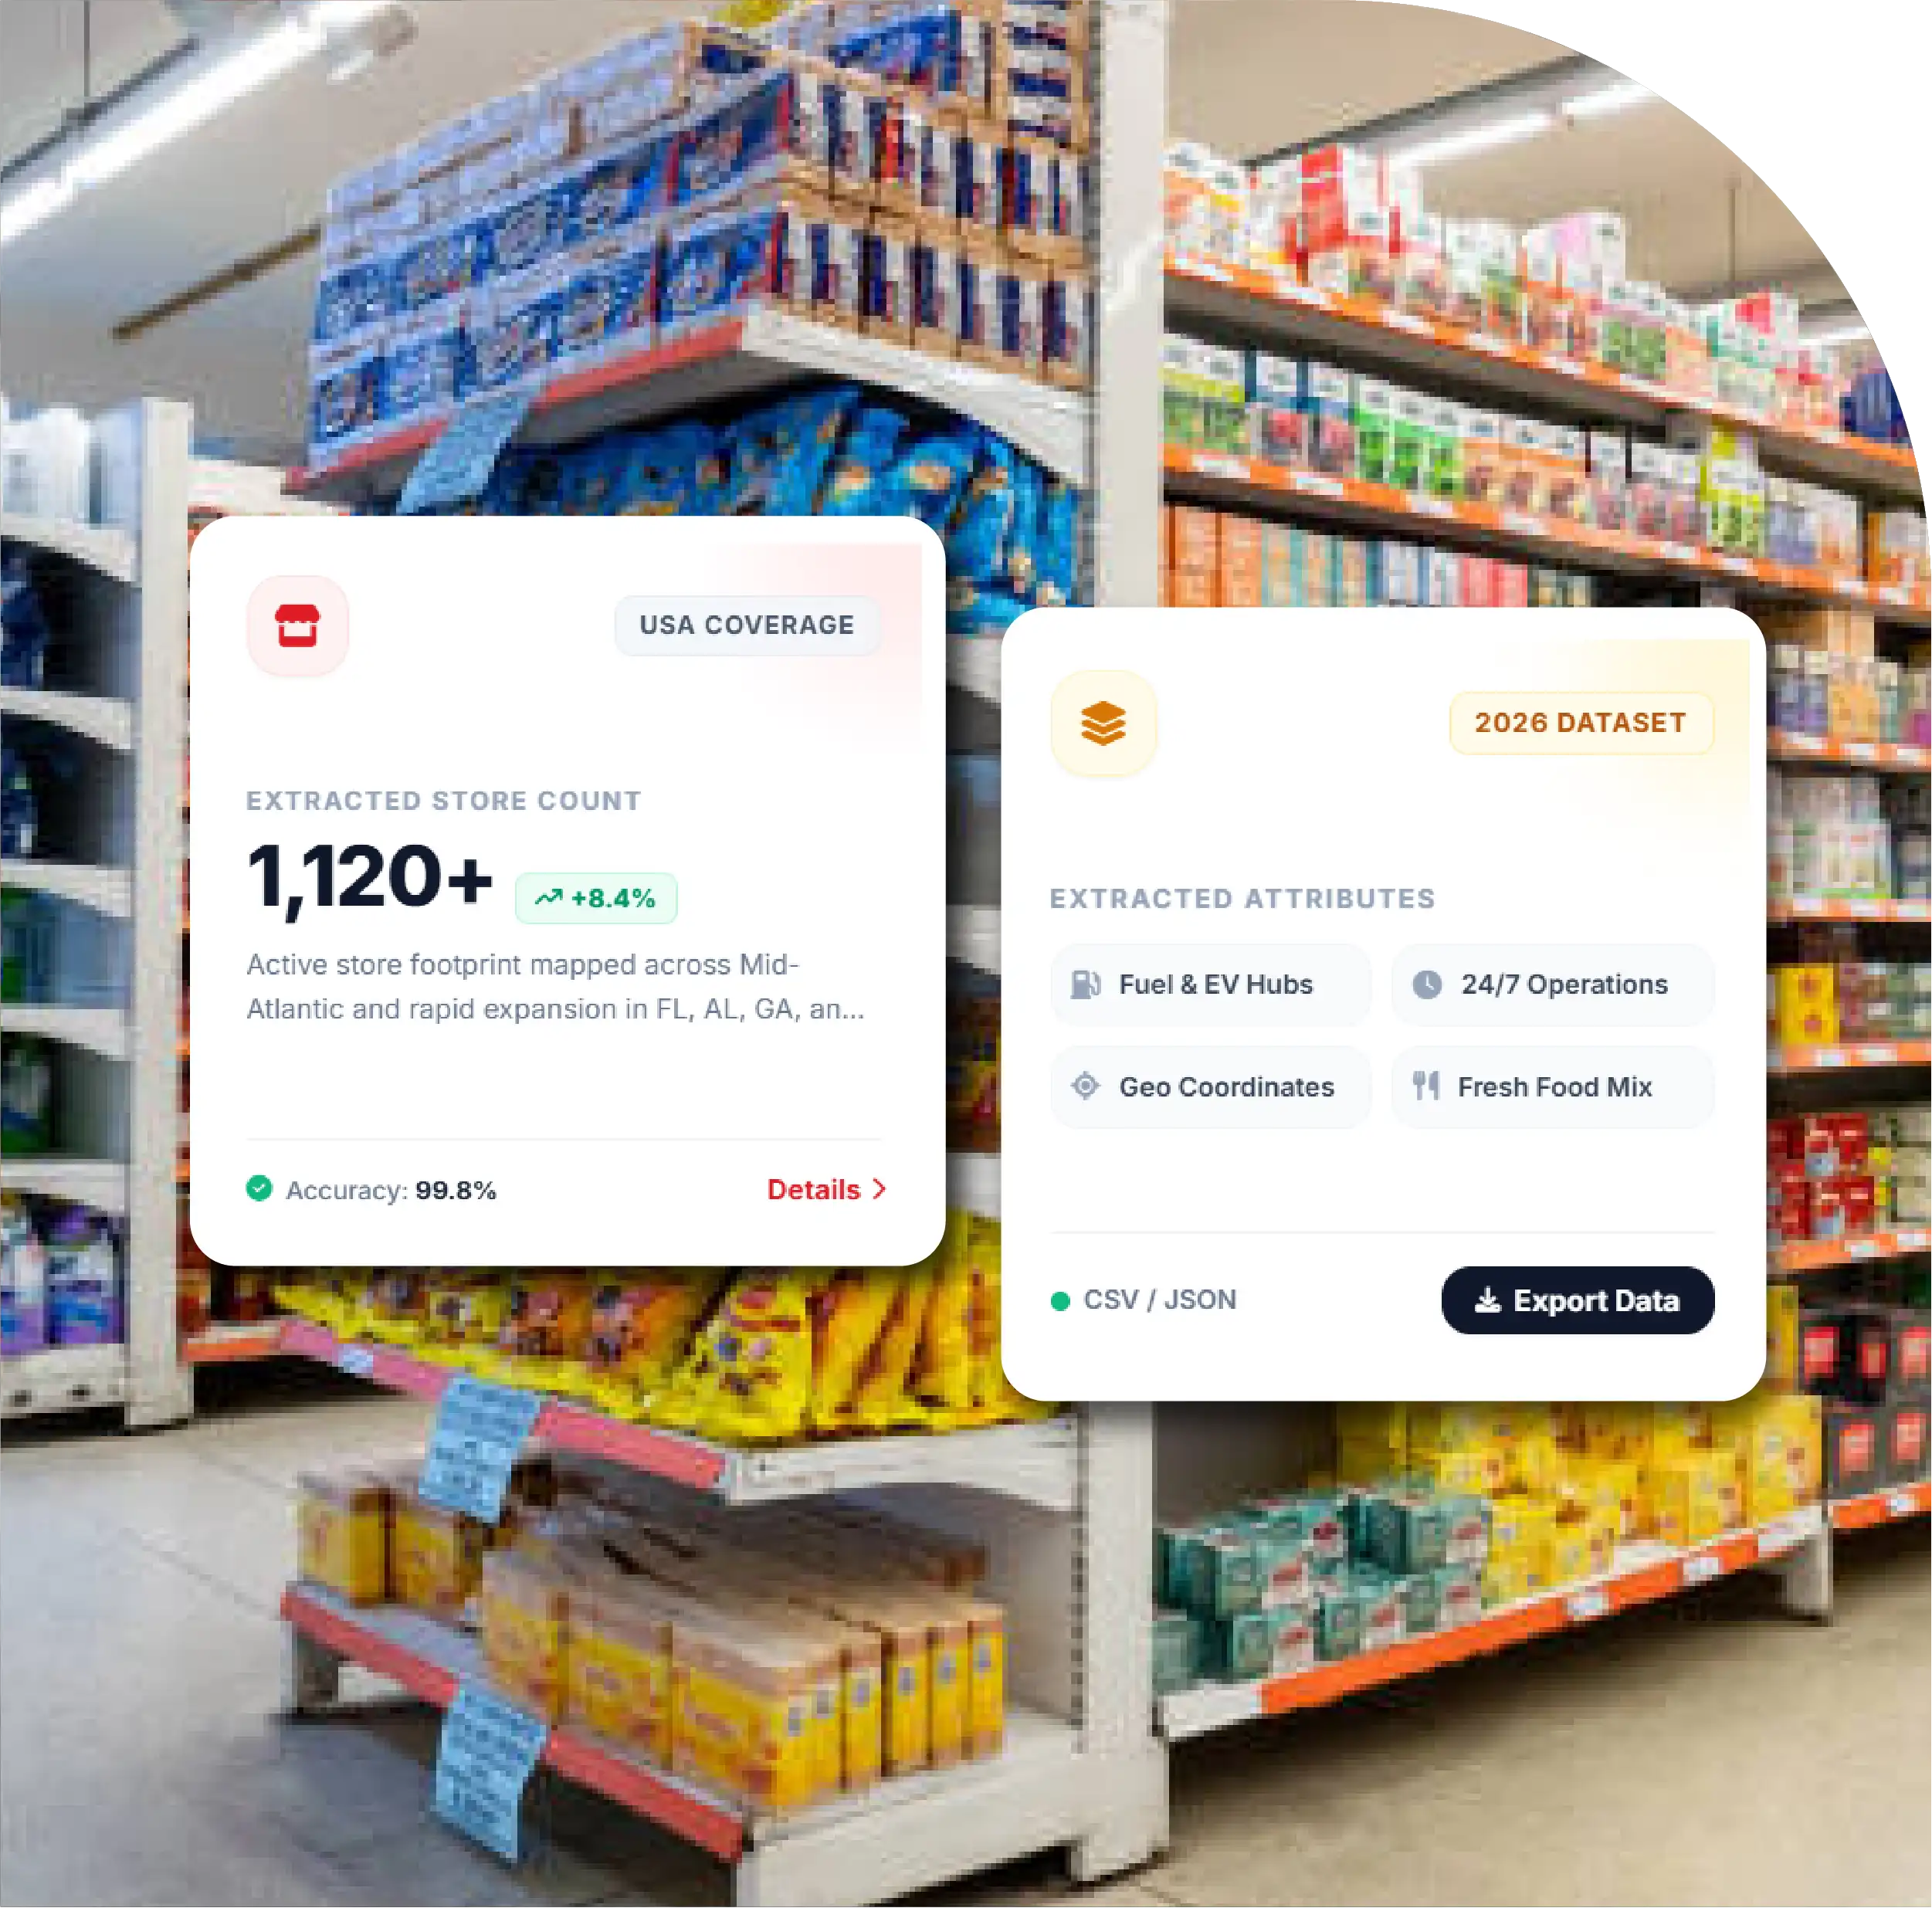
1. 372 H-E-B Stores: H-E-B operates 372 recorded stores in the United States as of September 22, 2026.
2. 100% Texas Concentration: All 372 identified H-E-B locations are concentrated in Texas, representing the complete U.S. store footprint.
3. 175 Cities Covered: The H-E-B network spans 175 Texas cities, with San Antonio leading at 49 stores.
4. 4.51 Average Rating: H-E-B locations record an average customer rating of 4.51 based on more than 793.71K reviews.
5. Detailed Location Dataset: Store records include addresses, ZIP codes, phone numbers, geographic coordinates, and September 2026 update dates.

The United States grocery retail landscape continues to evolve through store expansion, geographic concentration, customer experience, and increasingly data-driven location intelligence. As of September 22, 2026, H-E-B operates 372 stores across the United States, with its entire store network concentrated in Texas. This geographic footprint makes H-E-B a significant regional grocery retailer and creates a distinctive opportunity for analyzing store density, market coverage, and customer engagement.
Extract Number Of H-E-B Stores In USA Data to get a structured view of the retailer's nationwide footprint, including store counts, cities, addresses, contact information, geographic coordinates, and update dates.
H-E-B Store Location Data Extraction In USA helps researchers examine where stores are concentrated and identify markets with substantial H-E-B presence. Scrape H-E-B US Store Data to further support location-based research by organizing individual store records into usable datasets.
The September 2026 dataset shows that H-E-B operates across 175 cities, with an average location rating of 4.51 based on more than 793.71K reviews. San Antonio leads the city distribution with 49 locations, followed by Houston with 30 and Austin with 27.
| Metric | 2026 Data |
|---|---|
| Total H-E-B Locations | 372 |
| States & Territories with Stores | 1 |
| States & Territories without Stores | 55 |
| Cities with H-E-B Locations | 175 |
| Leading State | Texas |
| Texas Store Count | 372 |
| Share of U.S. Locations in Texas | 100% |
| Average Rating | 4.51 |
| Customer Reviews | 793.71K+ |
| High Customer Satisfaction | 89.27% |
| Poor Customer Feedback | 4.81% |
| Data Updated | September 22, 2026 |
The most distinctive characteristic of H-E-B's U.S. network is its complete concentration in Texas. The supplied September 2026 data records 372 locations in Texas, representing 100% of the identified U.S. H-E-B footprint.
This concentration creates a highly localized retail ecosystem rather than a nationwide supermarket network. For grocery market researchers, this makes Texas an important geographic area for examining store density, neighborhood coverage, competitive positioning, and consumer accessibility.
The dataset also identifies 55 states and territories without H-E-B locations. These include major markets such as California, Florida, New York, Illinois, Georgia, Colorado, Arizona, and Pennsylvania. The absence of stores across these markets highlights the regional nature of the retailer's physical footprint.
Store distribution becomes more concentrated when examined at the city level. The 10 leading cities account for a substantial portion of the network and provide useful indicators of H-E-B's strongest metropolitan markets.
| Rank | City | State | Locations |
|---|---|---|---|
| 1 | San Antonio | Texas | 49 |
| 2 | Houston | Texas | 30 |
| 3 | Austin | Texas | 27 |
| 4 | Corpus Christi | Texas | 10 |
| 5 | Katy | Texas | 7 |
| 6 | Laredo | Texas | 7 |
| 7 | Spring | Texas | 6 |
| 8 | Round Rock | Texas | 5 |
| 9 | Dallas | Texas | 5 |
| 10 | Cypress | Texas | 5 |
San Antonio has the largest concentration with 49 stores, making it the leading city in the supplied dataset. Houston follows with 30 locations, while Austin has 27. Together, these three cities contain 106 stores, representing approximately 28.5% of the total 372-store network.
The distribution demonstrates that H-E-B's footprint is not evenly spread across Texas. Instead, stores are clustered around major population centers and surrounding communities.
Store-level information can support H-E-B Competitive Intelligence Data analysis by allowing researchers to examine geographic presence, market concentration, customer ratings, and individual store characteristics.
A structured location database can help organizations compare H-E-B's footprint against competing supermarkets, evaluate market saturation, and identify areas with different levels of retail accessibility. Combining store coordinates with demographic, pricing, traffic, or competitor information can provide additional context for market research.
For grocery businesses, this type of intelligence can also help identify potential expansion markets, understand local competition, and monitor changes in retail distribution over time.
Grocery Retail Location Data Scraping provides a systematic way to collect store-level information from grocery retail networks. The H-E-B dataset demonstrates the range of fields that can be captured and organized for location intelligence.
The supplied records contain:
These fields transform individual store listings into structured geographic data. Latitude and longitude, for example, enable mapping and proximity analysis, while city and ZIP-code information supports regional segmentation.
H-E-B Store Count Data Scraping can help organizations monitor changes in retail networks over time. A September 2026 snapshot records 372 locations, providing a reference point for future comparisons.
Historical snapshots can reveal whether store networks are expanding, contracting, or shifting toward particular cities. Analysts can also calculate changes in store density, identify newly added locations, and monitor market-level developments.
For retail intelligence teams, maintaining regularly updated location datasets is particularly useful because store information can change through openings, closures, relocations, rebranding, and other network adjustments.
Customer feedback provides another dimension of the H-E-B location landscape. Across the analyzed locations, the average rating is 4.51, based on more than 793.71K customer reviews.
The supplied data reports an 89.27% high customer satisfaction rating and 4.81% poor customer feedback. These figures provide an aggregate view of customer sentiment associated with the analyzed locations.
| Store | City | Rating | Reviews |
|---|---|---|---|
| H-E-B | Burleson | 4.7 | 6,503 |
| H-E-B | Houston | 4.7 | 4,014 |
| H-E-B | Hutto | 4.7 | 3,794 |
| H-E-B | Copperas Cove | 4.7 | 3,731 |
| H-E-B | San Antonio | 4.7 | 3,431 |
Five locations in the supplied sample have ratings of 4.7. Burleson has the highest review volume among these five, with 6,503 reviews.
| Store | City | Rating | Reviews |
|---|---|---|---|
| H-E-B | Cleveland | 4.0 | 2,332 |
| H-E-B | San Antonio | 4.1 | 2,410 |
| H-E-B | Austin | 4.2 | 3,813 |
| H-E-B | Austin | 4.2 | 3,236 |
| H-E-B | San Antonio | 4.2 | 3,026 |
The difference between individual location ratings illustrates why store-level analysis can be more informative than relying solely on a network-wide average. Location-specific datasets enable analysts to identify variations in customer feedback between markets.
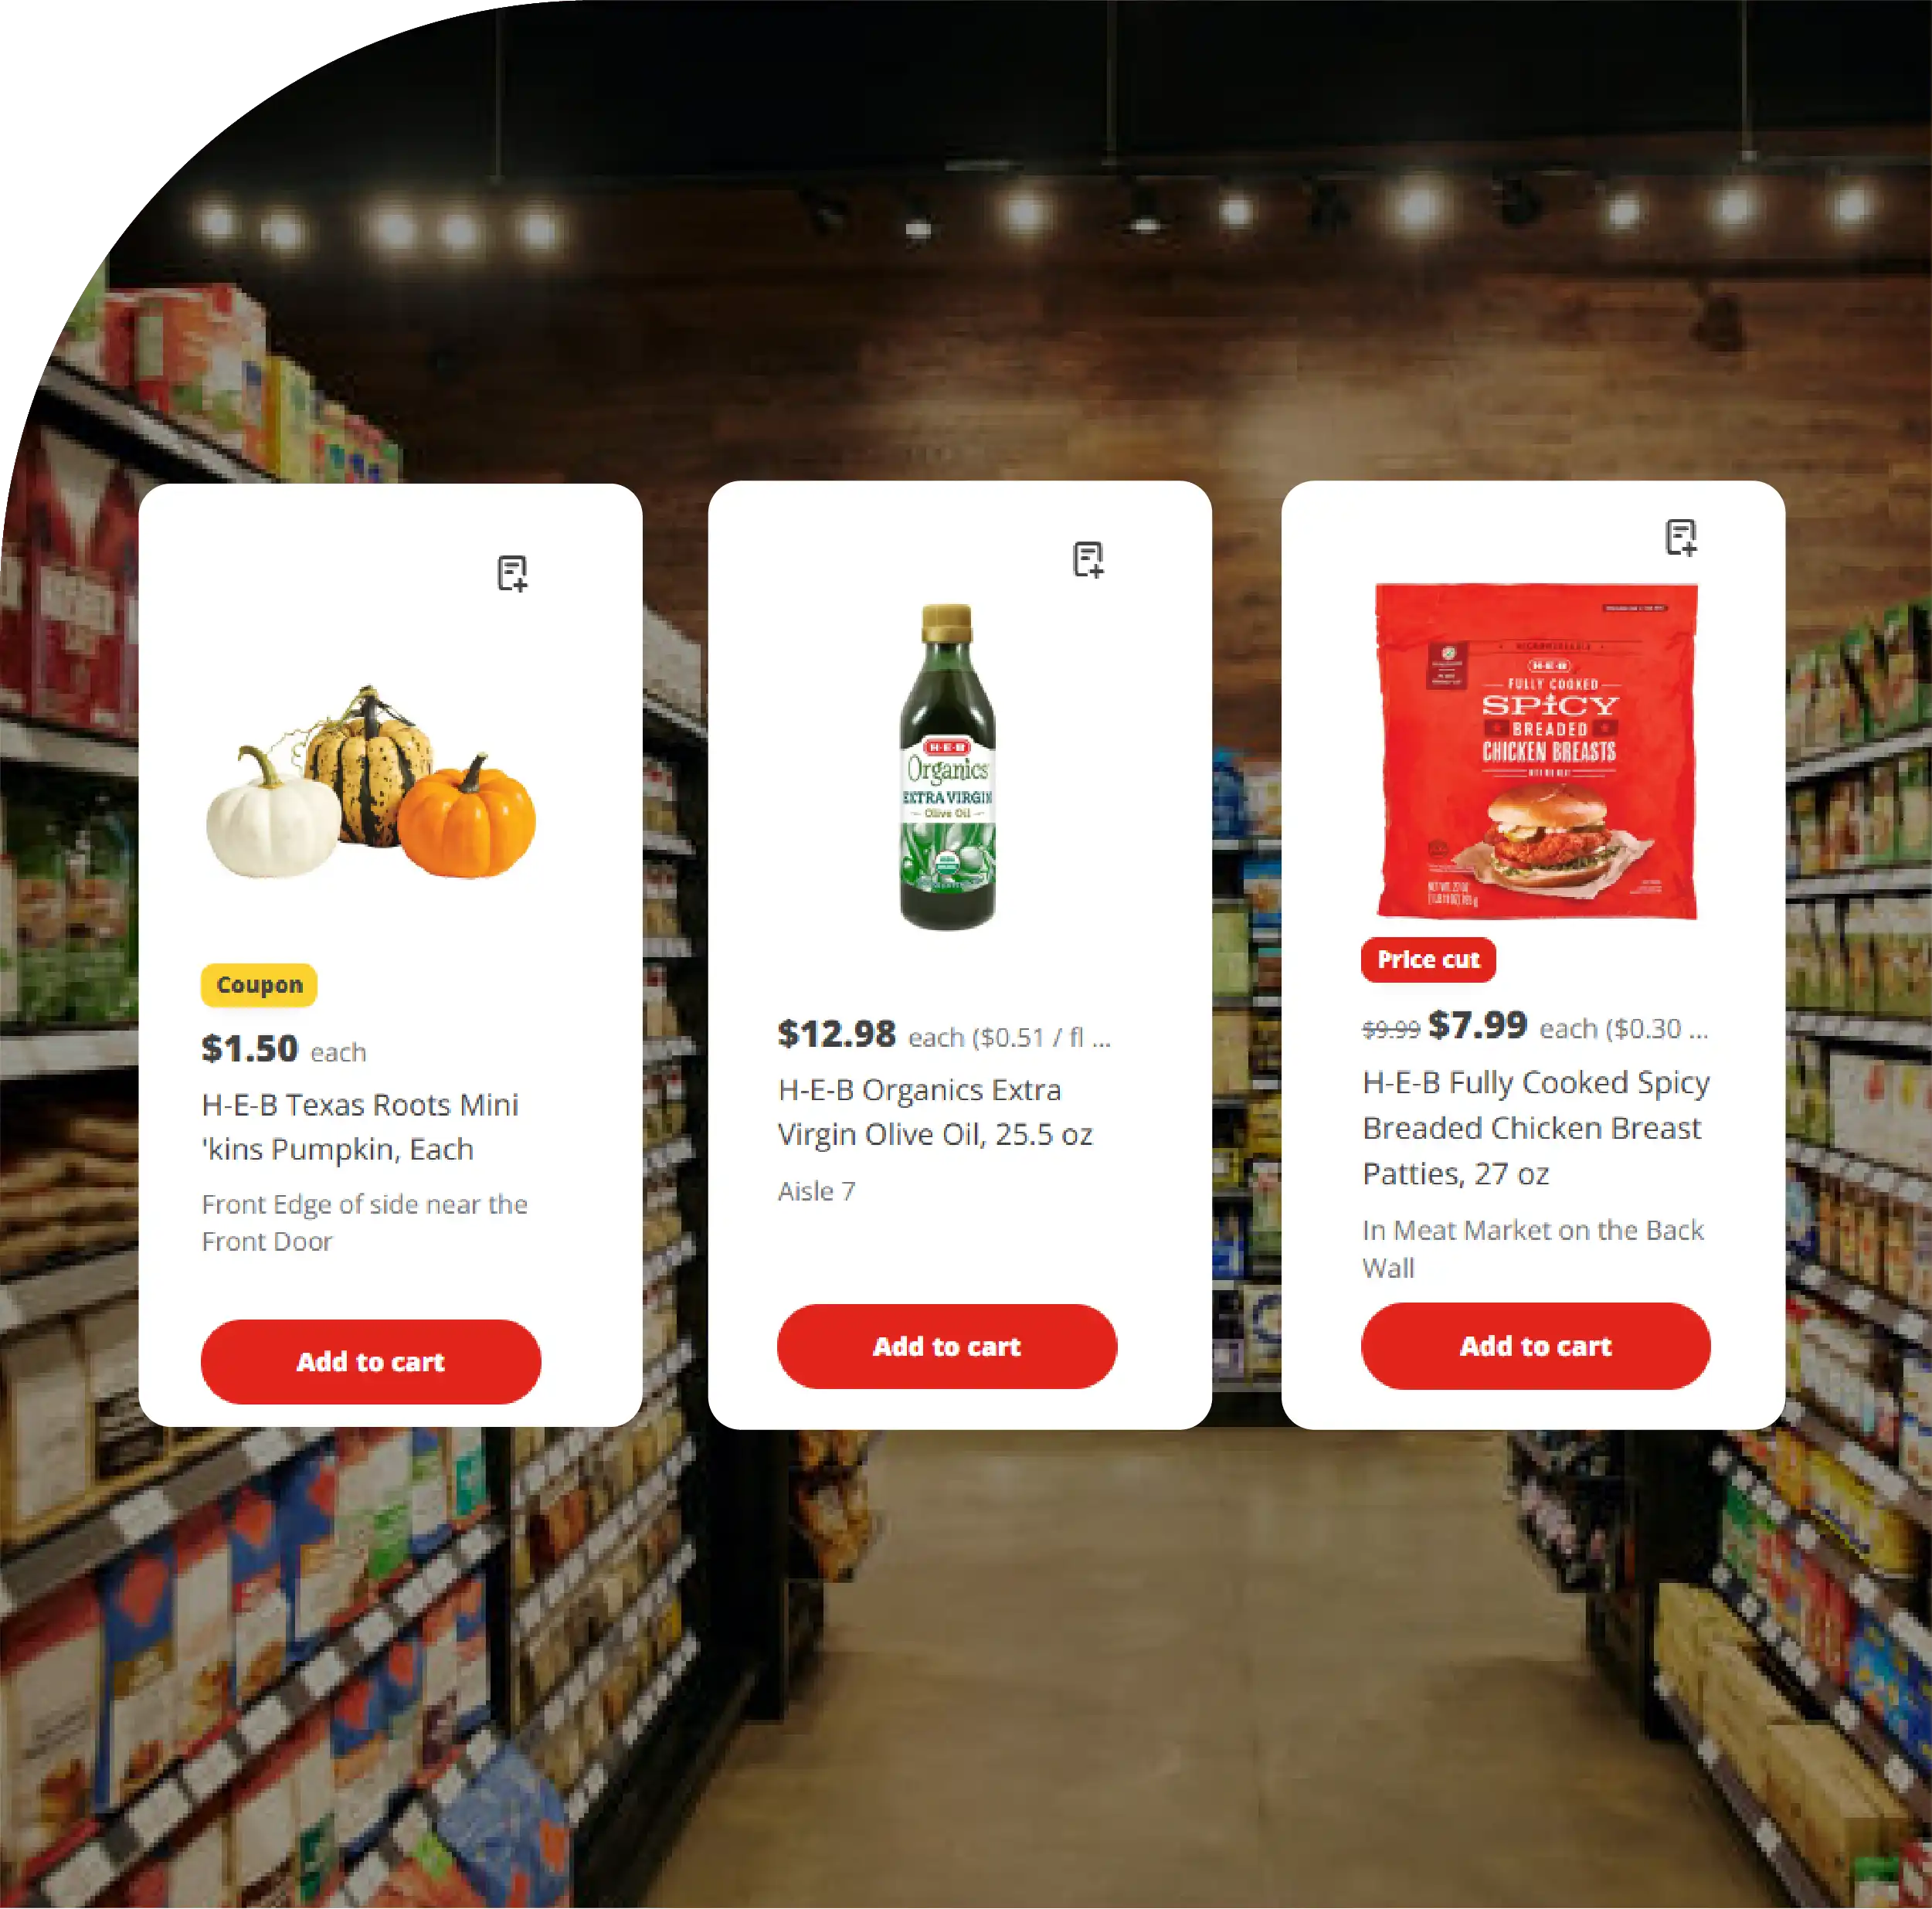
An H-E-B Grocery Delivery Scraping API can extend location intelligence beyond physical stores by connecting store information with online grocery availability, product information, pricing, promotions, and delivery-related attributes where legally and technically accessible.
Such structured data can support grocery price monitoring, assortment comparison, delivery coverage analysis, and competitive research. Combining physical store coordinates with digital grocery information can provide a broader view of the retailer's omnichannel presence.
Grocery Data Scraping in the USA can bring together store locations, product catalogs, prices, categories, promotions, ratings, and availability from multiple grocery retailers. For analysts studying H-E-B, the 372-store network provides a defined geographic base for comparing retail activity within Texas.
When store-level data is combined with competitor datasets, organizations can analyze geographic overlap, identify underserved areas, compare local assortment, and monitor retail competition.
The supplied dataset contains detailed records for individual locations. A sample of the available structure is shown below.
| Store | City | State | ZIP | Latitude | Longitude | Updated |
|---|---|---|---|---|---|---|
| Central Market North Lamar | Austin | TX | 78756 | 30.30732 | -97.73967 | 2026-09-22 |
| New Braunfels And Houston H-E-B | San Antonio | TX | 78202 | 29.42444 | -98.46143 | 2026-09-22 |
| Central Market Westgate | Austin | TX | 78745 | 30.23111 | -97.79773 | 2026-09-22 |
| Central Market Fort Worth | Fort Worth | TX | 76107 | 32.72990 | -97.38911 | 2026-09-22 |
| Livingston H-E-B | Livingston | TX | 77351 | 30.70973 | -94.95085 | 2026-09-22 |
| Pecan And Greenwood H-E-B | Del Rio | TX | 78840 | 29.35805 | -100.89729 | 2026-09-22 |
| Mercedes H-E-B | Mercedes | TX | 78570 | 26.15394 | -97.91288 | 2026-09-22 |
| Victory Smart Shop | Houston | TX | 77088 | 29.87081 | -95.41419 | 2026-09-22 |
| H-E-B Main St | Frisco | TX | 75033 | 33.15458 | -96.84583 | 2026-09-22 |
| Fm 1960 Smart Shop | Houston | TX | 77073 | 30.02099 | -95.38374 | 2026-09-22 |
1. Texas Represents the Entire Recorded Network
All 372 H-E-B locations in the September 22, 2026 dataset are located in Texas, making the retailer's physical footprint entirely concentrated within one state.
2. San Antonio Is the Largest Store Market
San Antonio has 49 locations, the highest city-level count in the dataset. Houston and Austin follow with 30 and 27 stores respectively.
3. Major Cities Drive Store Concentration
The leading cities demonstrate substantial clustering around major Texas population centers. This creates opportunities for city-level store density and competitive market analysis.
4. Customer Feedback Shows High Aggregate Ratings
The network has an average rating of 4.51 from 793.71K+ reviews, while individual stores range from 4.0 to 4.7 in the supplied examples.
5. Location Data Supports Multiple Research Applications
Store names, addresses, phone numbers, coordinates, ZIP codes, and update dates provide a foundation for mapping, market analysis, competitor monitoring, and retail intelligence.
The September 2026 H-E-B store dataset records 372 locations across 175 cities, with every identified U.S. location situated in Texas. San Antonio, Houston, and Austin represent the largest city markets, while the overall network demonstrates a strongly concentrated regional retail strategy.
For businesses studying grocery competition, store expansion, market coverage, or consumer accessibility, structured location data can provide a consistent foundation for ongoing analysis.
Grocery Data Scraping Services can help organizations collect and structure store, product, pricing, and competitive datasets for recurring retail intelligence programs.
AI Grocery Intelligence can further transform structured grocery datasets into automated monitoring, anomaly detection, market comparisons, and location-based insights.
A Supermarket Store Locator DB can consolidate store addresses, coordinates, contact information, ratings, and update timestamps into a searchable resource for retail research and operational analysis.
Are you in need of high-class scraping services? Food Data Scrape should be your first point of call. We are undoubtedly the best in Food Data Aggregator and Mobile Grocery App Scraping service and we render impeccable data insights and analytics for strategic decision-making. With a legacy of excellence as our backbone, we help companies become data-driven, fueling their development. Please take advantage of our tailored solutions that will add value to your business. Contact us today to unlock the value of your data.