

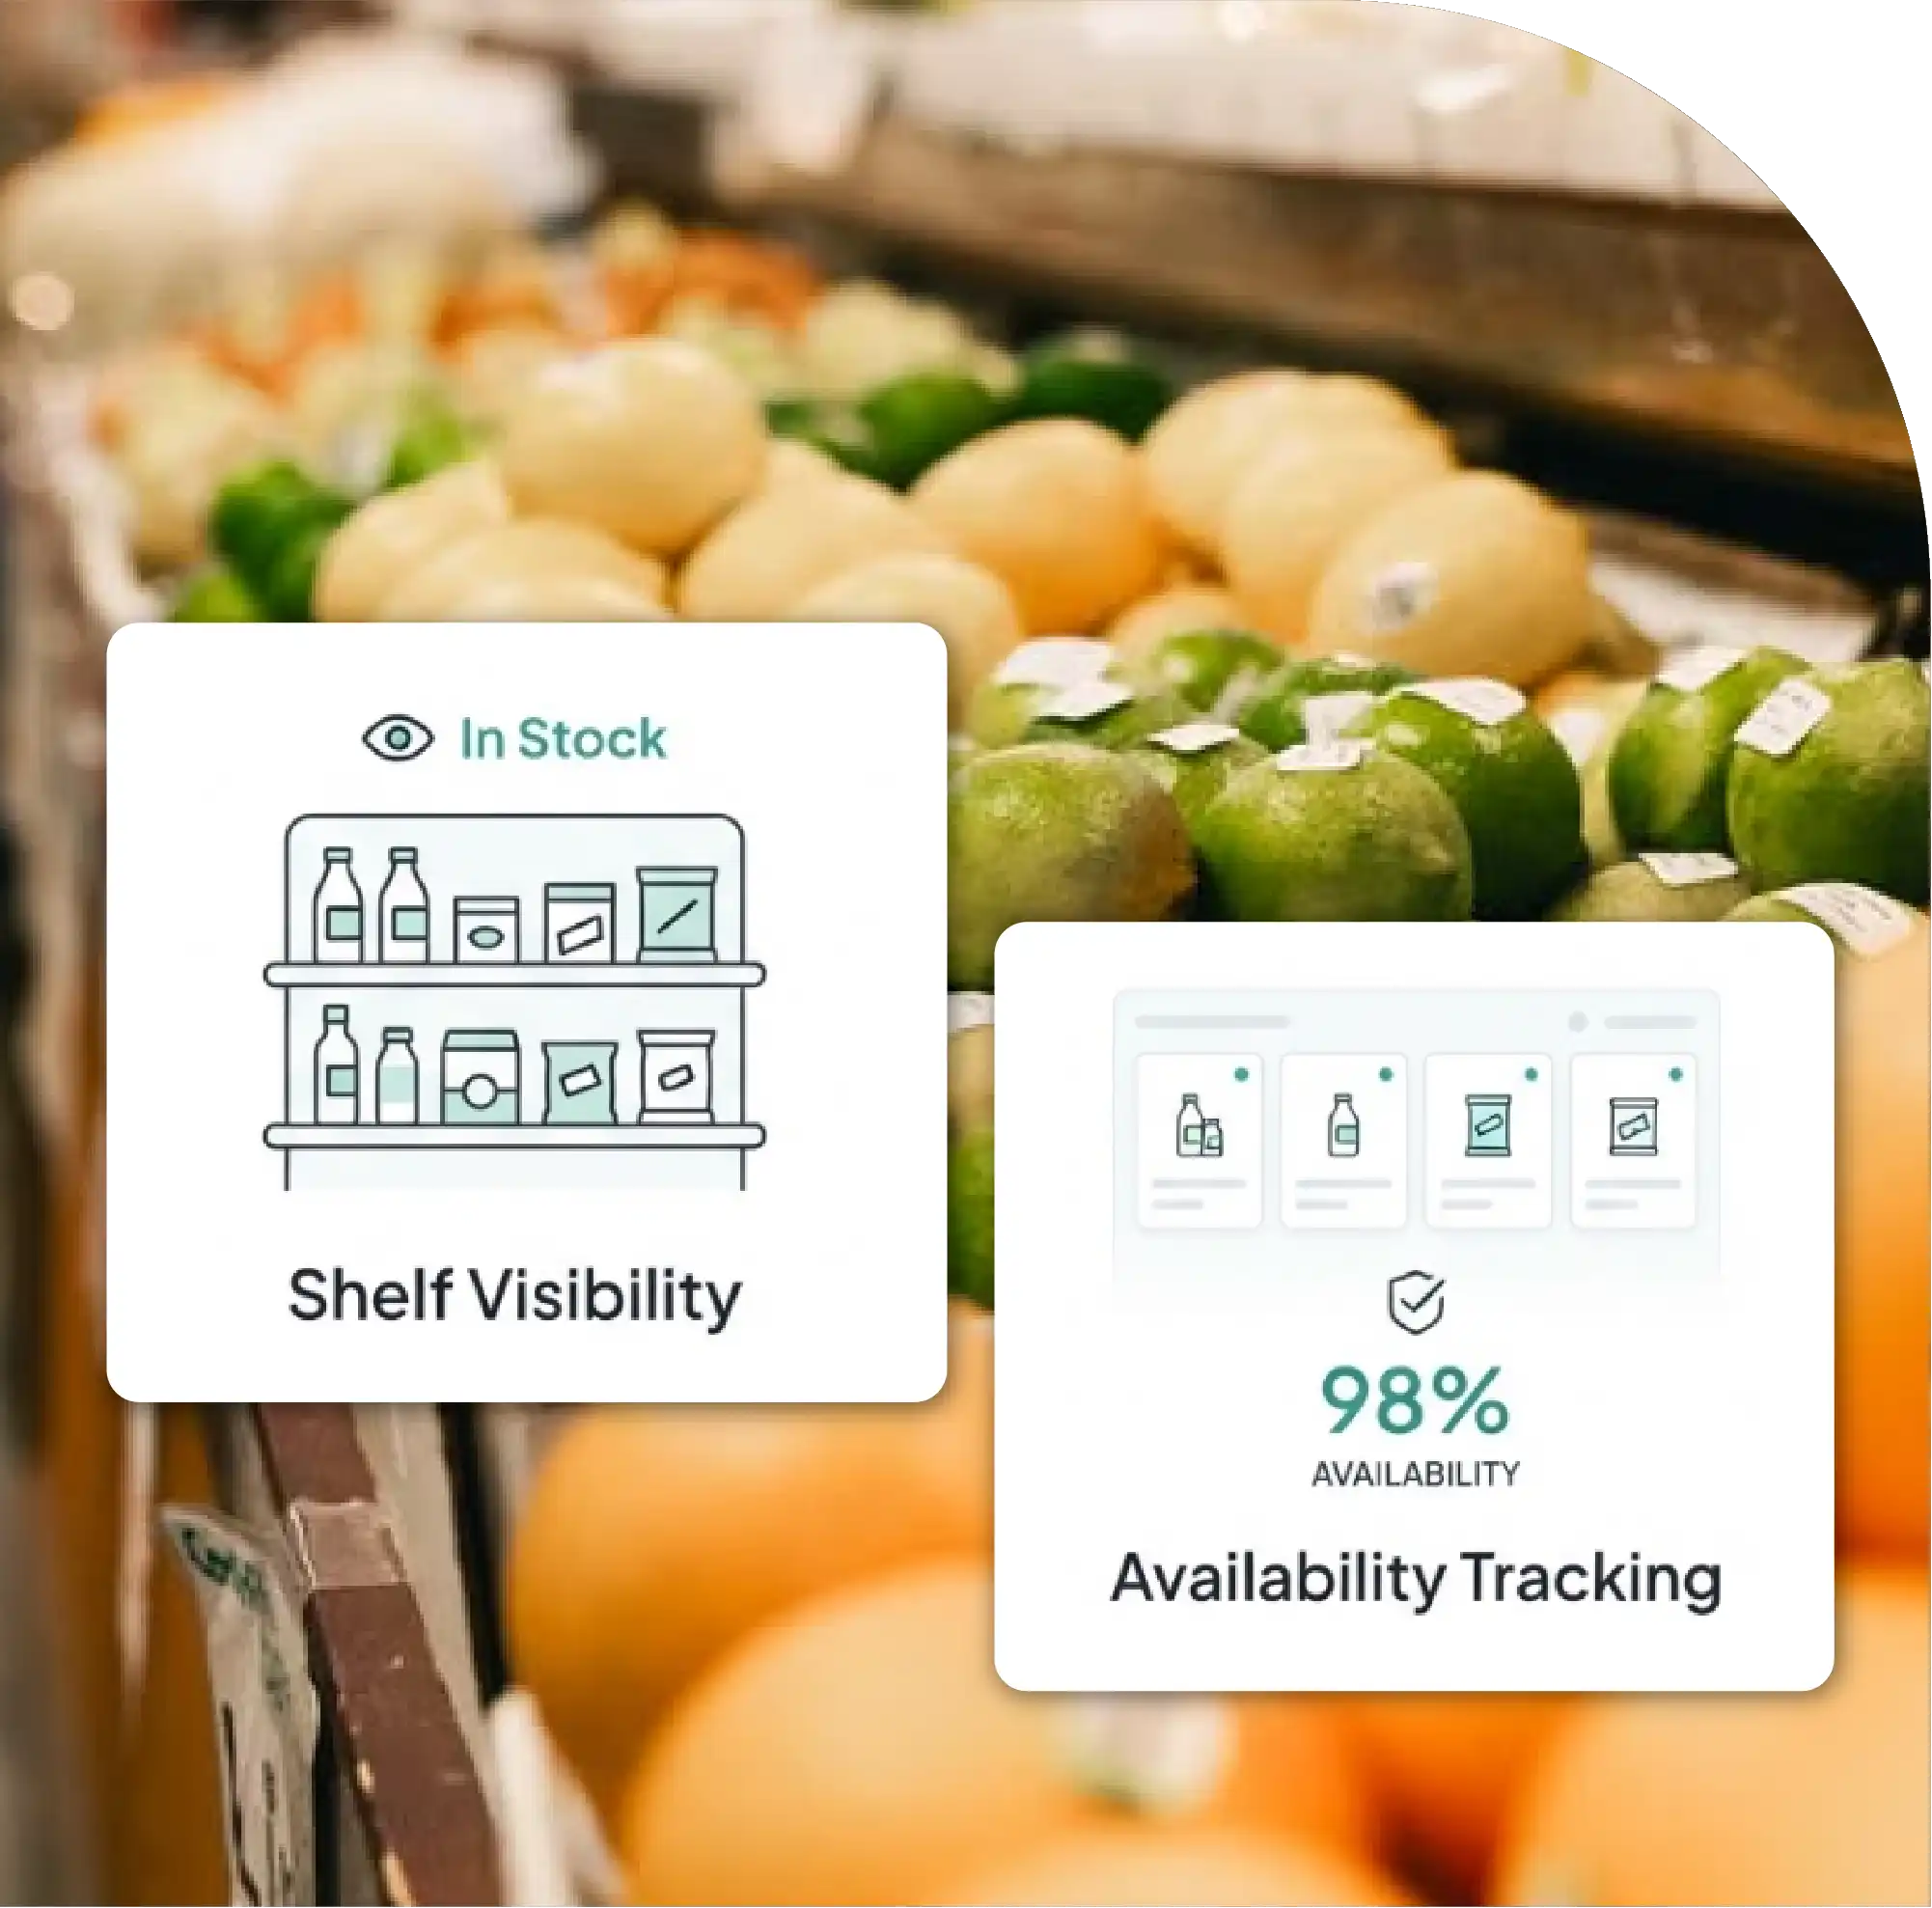
Real-Time Stock Visibility: Continuously identify SKU-level stock-outs across retailers, locations, stores, and digital channels.
Regional Gap Detection: Compare availability by city, retailer, product variant, and geography to uncover distribution weaknesses.
Promotional Execution: Monitor whether advertised and promotional SKUs remain available throughout active campaigns.
Competitive Benchmarking: Compare brand availability, pricing, delivery accessibility, and digital shelf performance against competitors.
Actionable Retail Intelligence: Use historical availability data, automated alerts, and performance metrics to improve replenishment and sales decisions.

In fast-moving consumer goods, a product that is not available at the moment of purchase is effectively invisible to the shopper. Brands can invest heavily in advertising, distribution, promotions, and pricing, yet still lose sales when consumers encounter an empty shelf, an unavailable online listing, or a product page showing "out of stock." This makes FMCG Shelf Availability Monitoring a critical component of modern retail intelligence.
The challenge has become more complex as FMCG brands sell through supermarkets, marketplaces, grocery applications, quick-commerce platforms, retailer websites, and omnichannel stores. A brand may have excellent physical distribution but still experience availability gaps across specific cities, stores, SKUs, pack sizes, or digital channels.
FMCG digital shelf intelligence enables brands to continuously examine how products appear, rank, and remain available across digital retail environments.
At the same time, online shelf availability monitoring provides a structured way to identify stock-outs, regional gaps, inactive listings, unavailable variants, and changes in product visibility.
Traditional retail audits often depend on periodic store visits and manually collected observations. While useful, these methods provide only snapshots. Automated data collection can instead capture availability signals at significantly greater frequency, creating a more detailed picture of retail execution.
Shelf availability directly influences revenue, customer satisfaction, promotional performance, and retailer relationships. If a shopper searches for a specific shampoo, snack, beverage, detergent, or personal-care product and cannot purchase it, the shopper may switch to a competing brand.
For FMCG businesses, the problem is not simply determining whether a product exists in a retailer's catalog. The important question is whether the right SKU is available in the right location, at the right price, in the right pack size, and at the right time.
Availability monitoring therefore connects operational execution with commercial performance.
For example, a brand might discover that a 500-gram cereal SKU has 94% availability nationally but only 78% availability in a particular metropolitan market. Another brand may find that its flagship product remains available while promotional multipacks frequently become unavailable. These patterns can reveal distribution weaknesses that national averages conceal.
A robust monitoring framework should capture multiple dimensions rather than relying on a simple in-stock or out-of-stock flag.
FMCG product availability data scraping can collect product-level information from retailer websites, grocery marketplaces, quick-commerce applications, and other digital storefronts.
The dataset can include SKU identifiers, product names, brands, pack sizes, prices, promotional prices, stock status, seller information, delivery eligibility, product URLs, images, ratings, and timestamps.
SKU availability monitoring for brands becomes especially valuable when hundreds or thousands of products are distributed across different retailers and geographic markets.
A monitoring system can classify each product into statuses such as available, unavailable, temporarily unavailable, discontinued, listing inactive, location restricted, or delivery unavailable.
| Data Category | Example Fields | Monitoring Frequency | Typical Coverage | Business Value | Alert Trigger |
|---|---|---|---|---|---|
| Product Identity | SKU, UPC, EAN, product ID | Daily | 95-100% | Product matching | ID mismatch |
| Brand | Brand name, sub-brand | Daily | 99% | Brand tracking | Brand classification change |
| Product Name | Title, variant, flavor | Daily | 98% | Catalog intelligence | Name modification |
| Pack Size | Weight, volume, units | Daily | 97% | Variant comparison | Pack-size change |
| Availability | In-stock, out-of-stock | Hourly | 90-99% | Stock-out detection | Availability drop |
| Price | MRP, selling price | Hourly | 95-99% | Price intelligence | Price variance |
| Promotion | Discount, coupon, offer | Hourly | 90-98% | Promotion monitoring | Offer starts/ends |
| Seller | Retailer, marketplace seller | Daily | 90-99% | Channel analysis | Seller change |
| Delivery | ETA, delivery eligibility | Hourly | 85-98% | Service-level analysis | ETA increase |
| Location | City, store, postcode | Hourly | 80-100% | Geographic analysis | Regional gap |
| Images | Primary image, thumbnails | Daily | 90-98% | Digital shelf quality | Image change |
| Ratings | Rating score, review count | Daily | 90-99% | Consumer perception | Rating decline |
| Timestamp | Collection date and time | Every run | 100% | Historical analysis | Missing data |
| URL | Product-page URL | Daily | 98-100% | Traceability | URL change |
A basic dashboard may show that 12% of monitored SKUs are unavailable. A sophisticated system goes further by identifying why.
Availability problems can emerge from several sources. A retailer may genuinely have no inventory, while another product may be listed but restricted to a different delivery zone. A product may also disappear because of catalog restructuring, discontinued inventory, incorrect inventory synchronization, or a temporary retailer issue.
This distinction matters because each cause requires a different response.
A genuine inventory shortage may require replenishment. A location-specific issue may require distribution adjustments. A catalog error may need retailer intervention. A discontinued SKU may require assortment replacement.
This makes automated monitoring valuable not only for detection but also for diagnosis.
The strongest FMCG monitoring programs compare availability across retailers, cities, stores, and product variants.
Consider a brand selling 40 SKUs across five retailers and 20 geographic markets. Instead of reporting one national availability figure, the system can calculate availability by retailer, SKU, city, pack size, category, and day.
| Retail Channel | SKUs Tracked | Markets | Daily Checks | Avg Availability % | Stock-Out Rate % | Promo SKUs | Price Variance % | Delivery Gap % | Alert Events/Month |
|---|---|---|---|---|---|---|---|---|---|
| Walmart | 1,250 | 32 | 40,000 | 94.8 | 5.2 | 185 | 3.8 | 2.1 | 1,420 |
| Target | 980 | 25 | 29,400 | 92.6 | 7.4 | 142 | 4.6 | 3.4 | 1,685 |
| Amazon Fresh | 1,480 | 41 | 44,400 | 91.9 | 8.1 | 210 | 5.2 | 4.8 | 2,140 |
| Instacart | 760 | 18 | 22,800 | 88.7 | 11.3 | 126 | 6.8 | 8.7 | 2,560 |
| Kroger | 690 | 16 | 20,700 | 90.4 | 9.6 | 118 | 5.9 | 7.5 | 2,180 |
| Tesco | 1,100 | 28 | 33,000 | 95.7 | 4.3 | 165 | 3.1 | 1.9 | 1,150 |
| Sainsbury's | 1,320 | 35 | 39,600 | 89.8 | 10.2 | 198 | 7.1 | 6.4 | 2,390 |
| Aldi | 840 | 21 | 25,200 | 87.9 | 12.1 | 155 | 7.6 | 9.2 | 2,870 |
| Woolworths | 520 | 14 | 15,600 | 93.2 | 6.8 | 74 | 4.2 | 3.7 | 1,120 |
| Coles | 430 | 12 | 12,900 | 91.5 | 8.5 | 68 | 4.9 | 4.1 | 980 |
| Total / Average | 9,370 | 242 | 283,600 | 91.7 | 8.3 | 1,441 | 5.3 | 4.8 | 18,495 |
These figures illustrate how the same FMCG portfolio can perform differently across retail channels. A supermarket may maintain high availability while quick-commerce platforms experience greater stock-outs because of localized inventory constraints.
This comparison allows brands to prioritize retailer-specific interventions instead of treating availability as a single national metric.
Digital shelf analytics for FMCG brands extends availability monitoring into broader product-performance intelligence.
Brands can compare their products against competitors across search visibility, pricing, promotions, ratings, content completeness, product titles, images, pack sizes, and availability.
This creates a competitive view of the digital shelf. A product might be technically available but still underperform because its listing lacks an optimized image, has incomplete attributes, carries a higher price, or appears below competing products in retailer search results.
The result is a shift from basic stock monitoring toward comprehensive digital execution management.
FMCG stock-out monitoring becomes particularly powerful when availability data is collected at frequent intervals.
Instead of waiting for a weekly report, brands can establish thresholds such as:
Real-Time Online Shelf Monitoring can therefore connect data collection with operational workflows.
For example, a dashboard could display 10,000 monitored SKUs and automatically identify 430 products requiring attention. Teams could then prioritize products based on revenue contribution, campaign status, retailer importance, and duration of the stock-out.
Availability intelligence becomes more actionable when businesses calculate standardized metrics.
A basic availability rate can be calculated as:
Availability Rate = Available SKU Observations ÷ Total SKU Observations × 100
Brands can also calculate stock-out duration, retailer availability, geographic availability, promotional availability, and competitor availability.
A weighted availability score can provide greater commercial accuracy by assigning more importance to high-revenue products. A premium flagship SKU should not necessarily have the same business weight as a low-volume product.
| Metric | Formula / Measurement | Example Value | Interpretation | Recommended Frequency | Priority |
|---|---|---|---|---|---|
| Overall Availability | Available ÷ Total × 100 | 93.4% | Network-wide stock health | Daily | High |
| Stock-Out Rate | OOS ÷ Total × 100 | 6.6% | Lost-sales risk | Hourly | Critical |
| Average OOS Duration | Total OOS Hours ÷ OOS Events | 8.4 hrs | Persistence of shortages | Daily | High |
| Retailer Availability | Available Retailer SKUs ÷ Retailer SKUs | 91.8% | Channel performance | Daily | High |
| City Availability | Available City SKUs ÷ City SKUs | 89.7% | Geographic health | Daily | High |
| Priority SKU Availability | Available Priority SKUs ÷ Priority SKUs | 96.1% | Key-product health | Hourly | Critical |
| Promotional Availability | Available Promo SKUs ÷ Promo SKUs | 87.3% | Promotion execution | Hourly | Critical |
| Competitor Availability | Competitor Available ÷ Competitor Total | 95.2% | Competitive benchmark | Daily | Medium |
| Availability Gap | Brand Availability − Competitor Availability | -3.4 pp | Competitive disadvantage | Daily | High |
| Price Gap | Brand Price − Competitor Price | +4.8% | Pricing disadvantage | Hourly | High |
| Delivery Availability | Deliverable SKUs ÷ Listed SKUs | 90.2% | Fulfillment accessibility | Hourly | High |
| Weighted Availability | Revenue-weighted available SKUs | 94.8% | Commercial availability | Daily | Critical |
| Regional Stock-Outs | Locations with OOS SKUs | 47 | Distribution gaps | Daily | High |
| Repeat Stock-Out Rate | Repeat OOS SKUs ÷ OOS SKUs | 22.6% | Persistent issue | Weekly | High |
| Recovery Time | OOS Detection to Reavailability | 11.7 hrs | Replenishment efficiency | Daily | High |
Automated monitoring can support sales, supply-chain, category-management, e-commerce, marketing, and revenue teams simultaneously.
Sales teams can identify retailers with persistent availability problems. Supply-chain teams can identify markets requiring replenishment. Category managers can examine assortment gaps. E-commerce teams can monitor digital product visibility. Marketing teams can verify whether advertised products are actually purchasable.
The same historical dataset can also support demand planning. If specific SKUs repeatedly become unavailable after promotions, brands can use historical patterns to improve future inventory allocation.
Competitor monitoring adds another layer. If a competitor maintains 97% availability while a brand remains at 89%, the difference may represent significant potential sales leakage.
Extracting FMCG Data at scale requires consistent product identification, structured schemas, location-aware collection, timestamping, validation, and historical storage.
A reliable pipeline typically follows several stages: source discovery, product matching, automated extraction, data validation, normalization, deduplication, availability classification, historical storage, analytics, and alert generation.
SKU matching is particularly important because the same product can appear under different titles or identifiers across retailers. Pack size, brand, flavor, variant, barcode, and product attributes can be combined to create reliable product matching logic.
Historical data is equally important because availability is dynamic. A single snapshot cannot reveal whether a product was unavailable for ten minutes, ten hours, or ten days.
FMCG shelf availability is increasingly becoming a measurable, continuously monitored business variable rather than an occasional retail-audit metric. Brands that monitor thousands of products across retailers and geographic locations can identify stock-outs earlier, understand recurring availability gaps, evaluate promotional execution, and compare their retail presence against competitors.
The most effective programs combine availability data with pricing, product content, promotions, delivery information, and competitive intelligence. This creates a unified view of what shoppers can actually find and purchase across modern retail channels.
For businesses building a comprehensive intelligence pipeline, FMCG Price Data Extraction can complement availability monitoring by revealing price movements alongside stock conditions.
Likewise, Web Scraping FMCG Product Details Data can provide structured product names, variants, pack sizes, images, specifications, ratings, and other attributes required for digital shelf analysis.
Finally, brands can Extract FMCG and Grocery Product Data across multiple retail environments to build historical datasets that support assortment optimization, competitive benchmarking, pricing decisions, replenishment planning, and revenue protection.
Ultimately, shelf availability monitoring is not simply about finding empty digital shelves. It is about transforming constantly changing retail data into actionable intelligence that helps FMCG brands keep the right products visible, available, competitively positioned, and ready for purchase.
Are you in need of high-class scraping services? Food Data Scrape should be your first point of call. We are undoubtedly the best in Food Data Aggregator and Mobile Grocery App Scraping service and we render impeccable data insights and analytics for strategic decision-making. With a legacy of excellence as our backbone, we help companies become data-driven, fueling their development. Please take advantage of our tailored solutions that will add value to your business. Contact us today to unlock the value of your data.



