

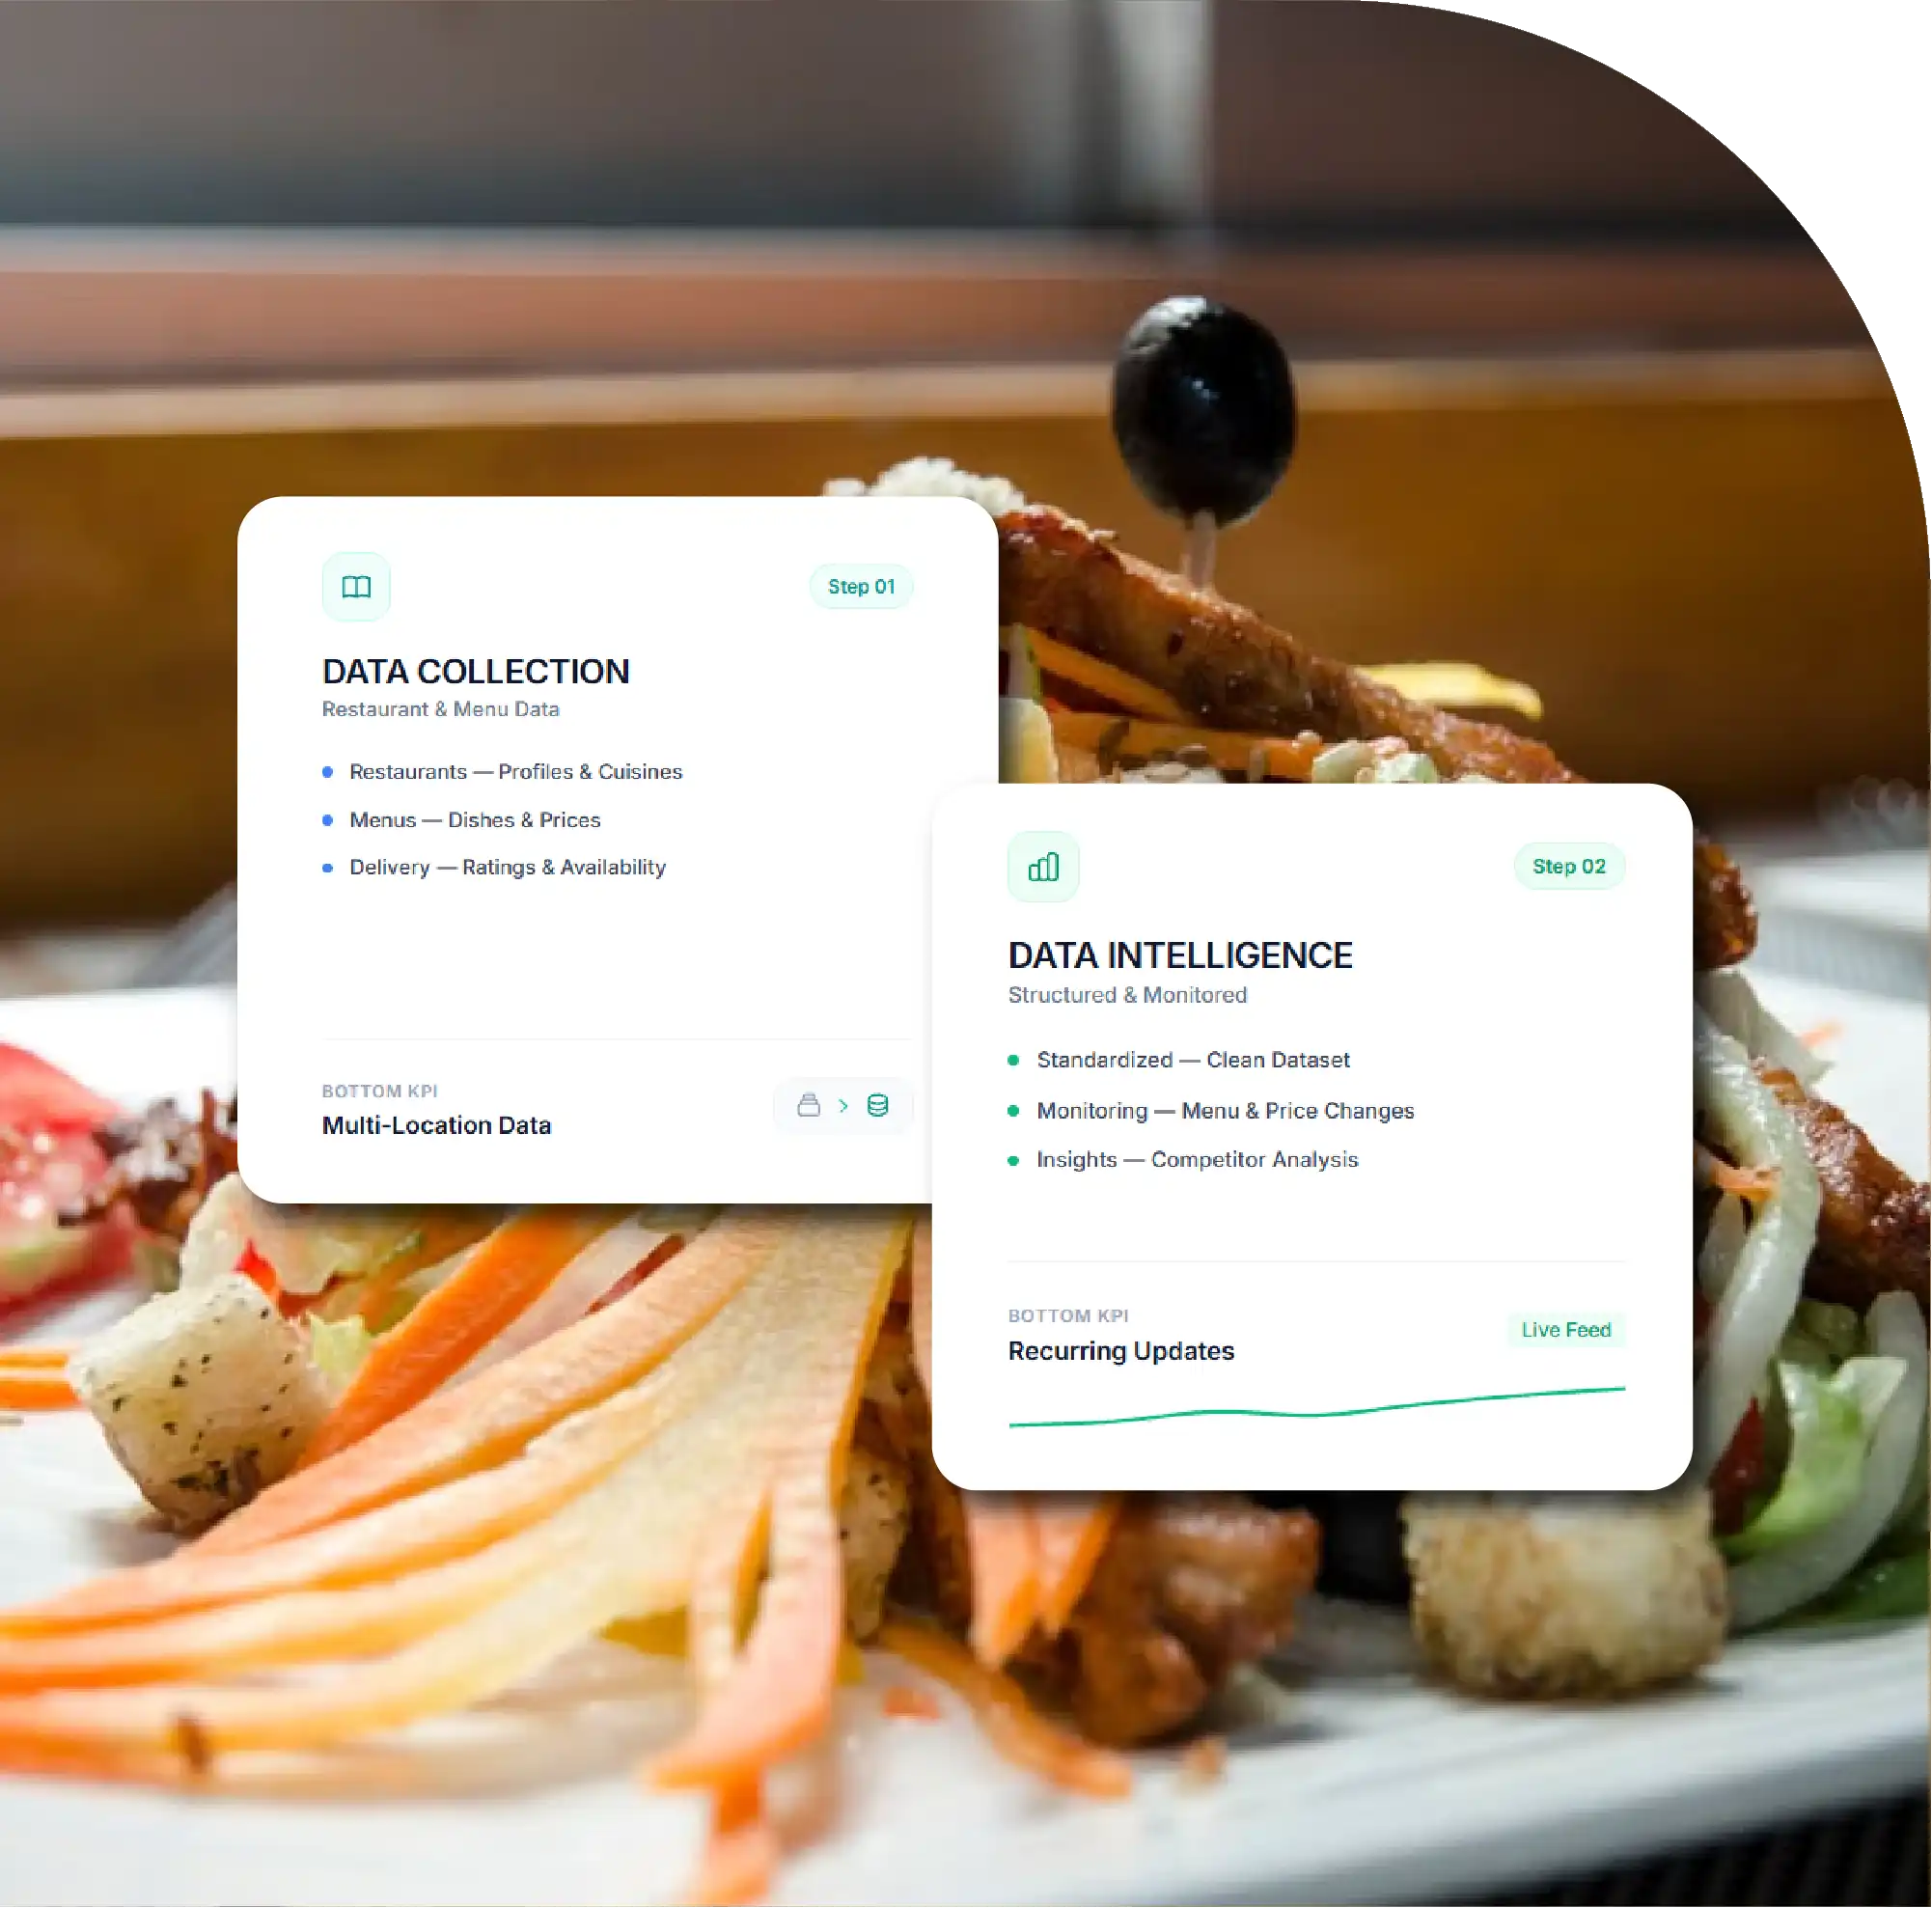
Market Intelligence: Tracks competitive pricing, menus, promotions, delivery, and availability changes.
Platform Comparison: Compares restaurant coverage, pricing, discounts, fees, ratings, delivery performance.
Price Monitoring: Identifies price gaps, discount patterns, promotional activity, historical changes.
Restaurant Insights: Reveals assortment gaps, competitor expansion, availability trends, geographic opportunities.
Predictive Analytics: Transforms historical marketplace data into actionable forecasting and strategies.

The food delivery industry has evolved into a highly competitive digital marketplace where restaurants, aggregators, food-tech companies, retailers, investors, and consumer applications compete across pricing, assortment, promotions, delivery speed, availability, and customer experience. Food Delivery Data Scraping Services provide businesses with structured information that can be used to understand these rapidly changing market conditions.
The growing adoption of food delivery app scraping enables companies to collect restaurant listings, menu information, prices, discounts, ratings, delivery estimates, locations, availability, and promotional information at scale.
A structured food delivery dataset can bring these individual observations together into a centralized analytical resource, allowing businesses to compare competitors, identify pricing patterns, monitor restaurant coverage, analyze menu changes, and understand market-level trends.
Unlike traditional market research, automated data collection can be scheduled repeatedly. This makes it possible to create historical records showing how restaurants, menus, prices, promotions, and delivery conditions change over time.
For restaurant chains, such intelligence can support competitor benchmarking and menu strategy. For food-tech businesses, it can strengthen restaurant discovery and comparison applications. For investors and market researchers, it can provide measurable signals about marketplace expansion, pricing behavior, and competitive intensity.
Food delivery marketplaces are highly dynamic. Restaurant menus can change frequently, promotional offers may be introduced for short periods, prices can vary by location, and delivery estimates can change according to demand and operational conditions.
Manual research captures only a small portion of this activity. A researcher might check a restaurant today and record its price, but that observation does not reveal whether the price increased yesterday, whether a promotion was active last week, or whether the same restaurant is priced differently on another marketplace.
Automated data extraction addresses this limitation by collecting information repeatedly according to predefined schedules.
The resulting datasets can help businesses answer important questions:
The ability to answer these questions using structured data turns food delivery information into a strategic business asset.
Multi-platform food delivery data scrape projects provide a standardized way to compare restaurants and marketplaces.
A restaurant may appear on several platforms but display different prices, menu combinations, promotions, delivery fees, and estimated delivery times. Without cross-platform normalization, companies may struggle to determine whether these differences represent genuine pricing strategies or simply differences in data presentation.
A multi-platform dataset can assign standardized fields to every observation. Restaurant names, menu categories, prices, locations, ratings, delivery estimates, and promotional information can then be compared using consistent definitions.
This approach is especially useful for restaurant chains operating across multiple marketplaces. Management teams can identify pricing disparities, monitor competitor behavior, and evaluate whether their own menu positioning remains competitive.
It can also help food-tech companies understand marketplace overlap. For example, a business may discover that 80% of restaurants in a particular area appear on two major platforms, while another platform has a significantly different restaurant base.
Restaurant information forms the foundation of a food delivery intelligence dataset.
Typical restaurant-level fields include restaurant name, restaurant ID, cuisine, address, locality, city, geographic coordinates, rating, review count, operating hours, chain name, delivery availability, and platform presence.
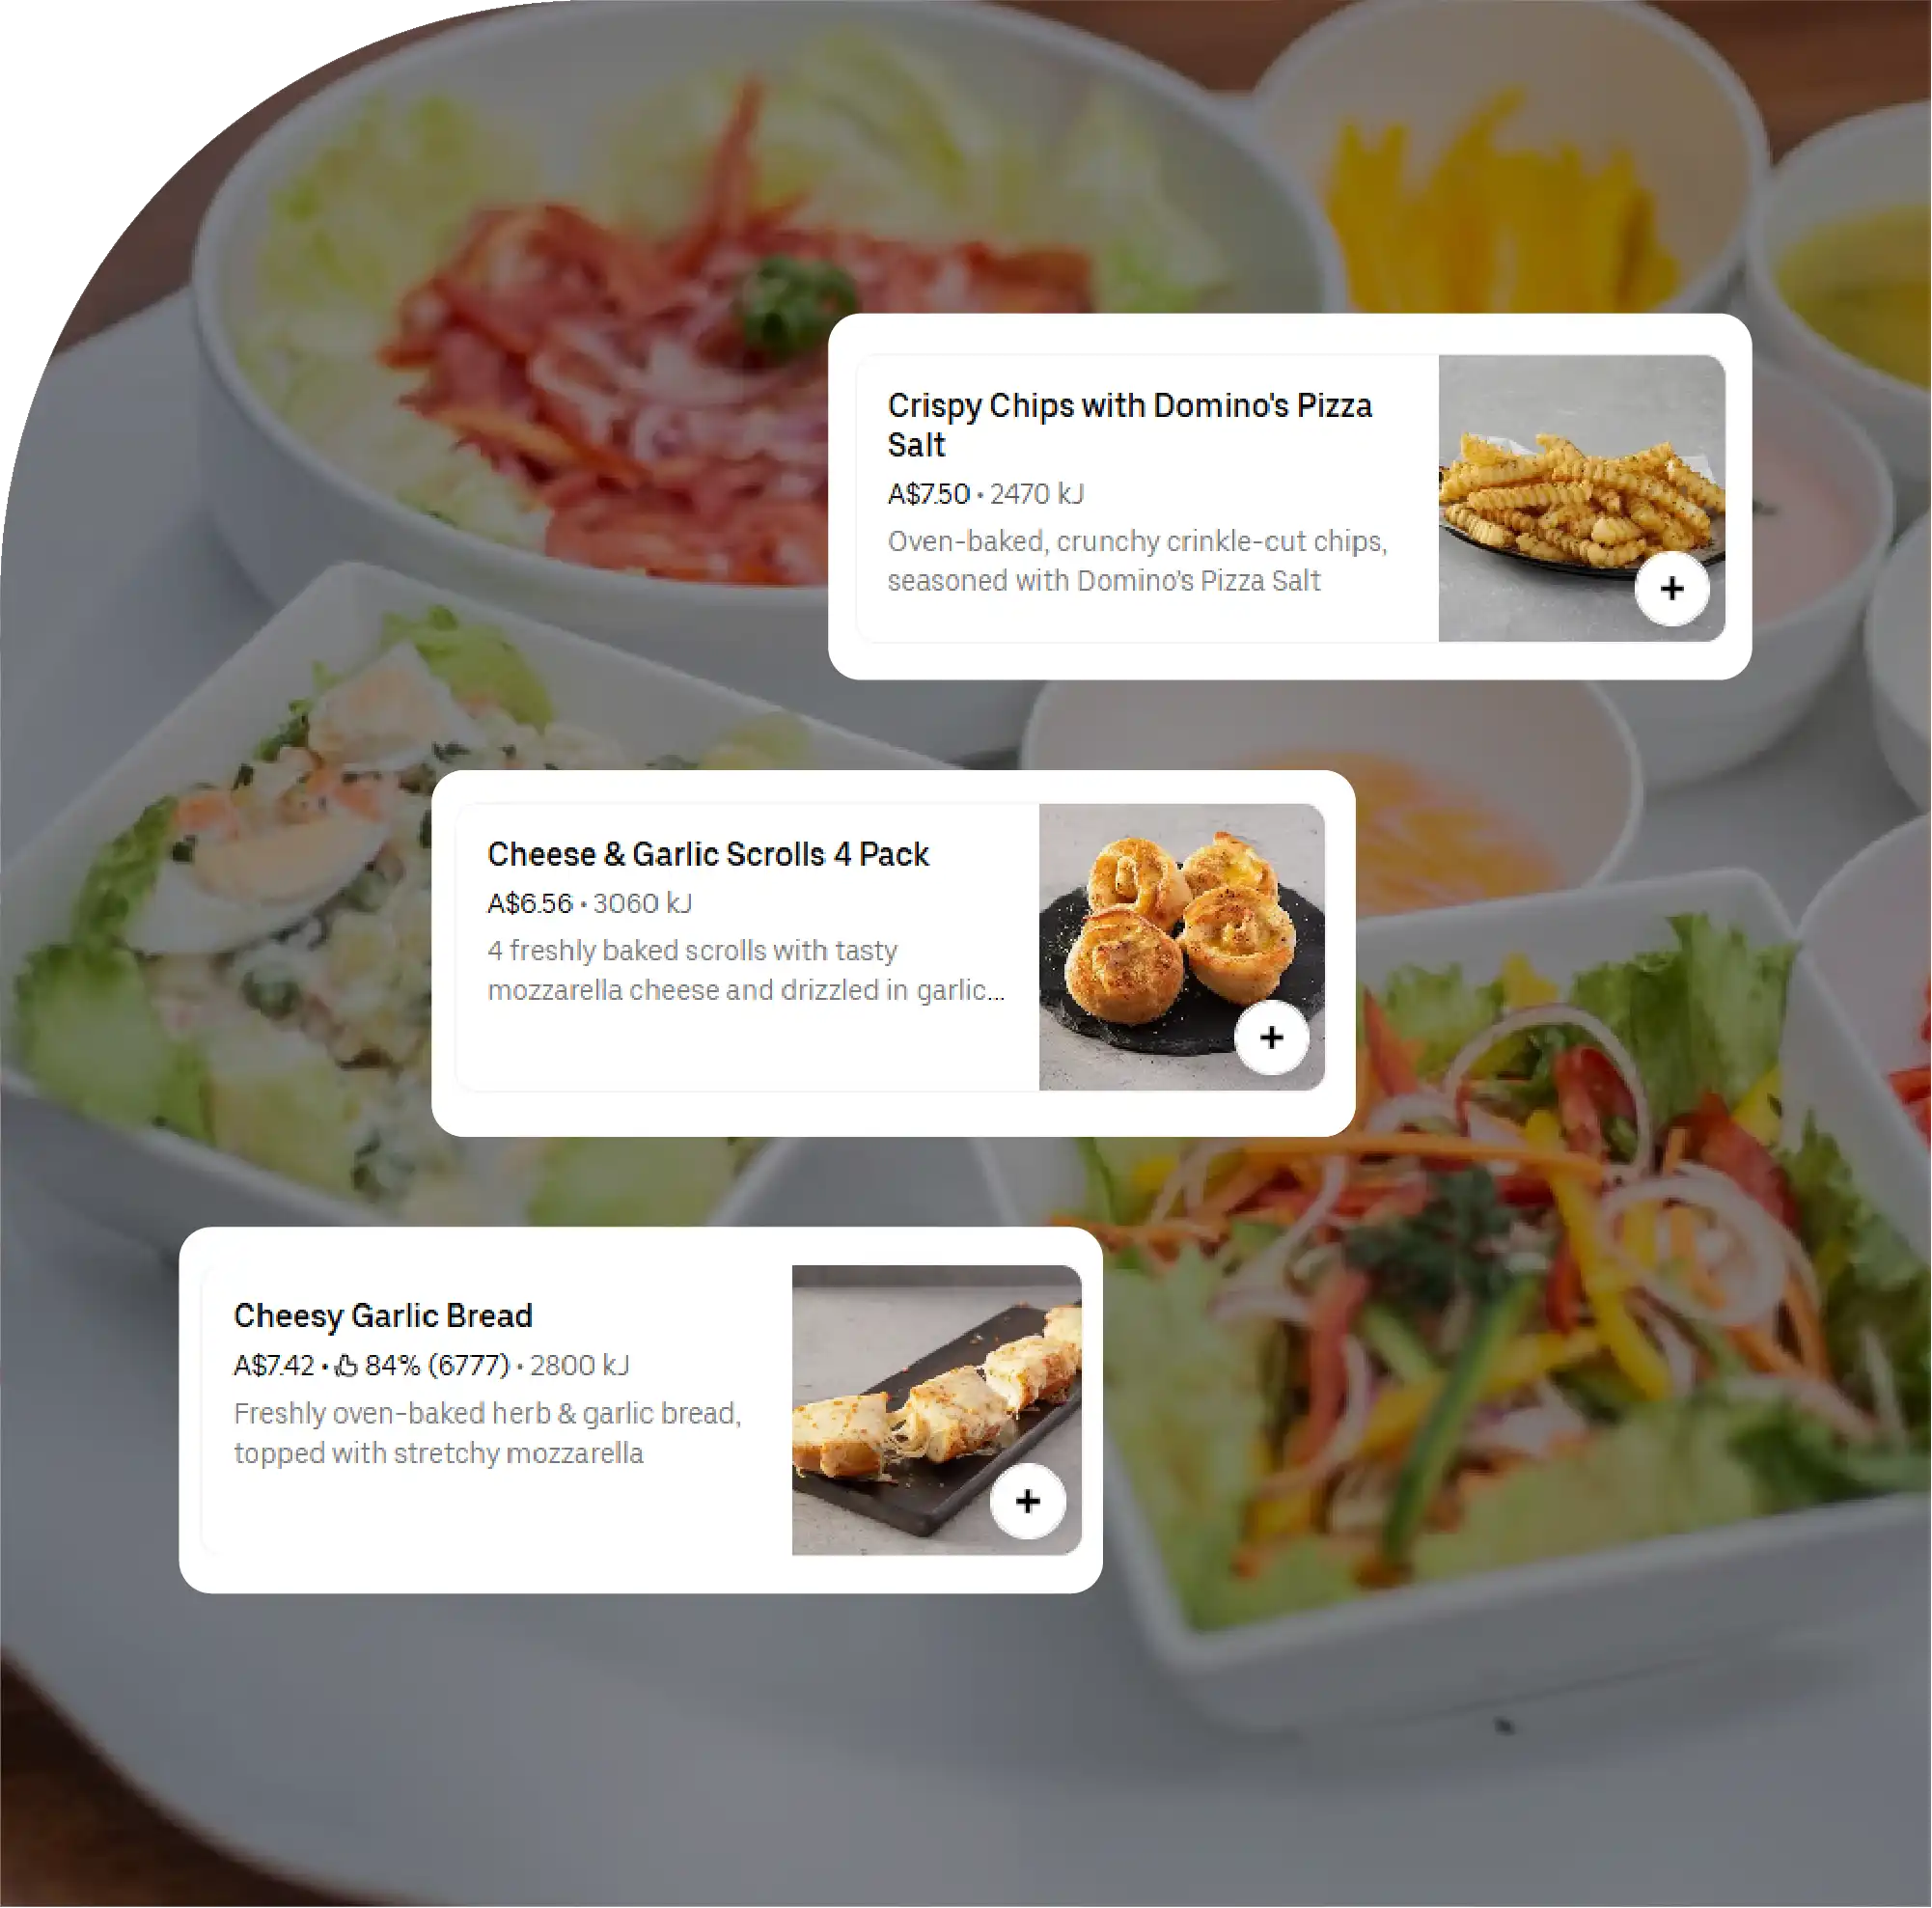
Menu-level information provides greater depth. Data can include item name, category, description, portion size, price, discounted price, customization options, add-ons, images, ingredients, dietary labels, and availability status.
This information allows companies to analyze menu structure rather than simply restaurant presence.
For example, two restaurants may both be classified as Indian restaurants, but one may offer 85 menu items while another may offer 210. One may specialize in premium family meals, while another focuses on low-cost individual combos.
Such differences become measurable when menu-level data is collected systematically.
Food delivery price data scrape projects focus on one of the most commercially valuable areas of marketplace intelligence: pricing.
Restaurant prices can differ according to platform, location, time, menu format, promotion, and customer segment. Monitoring these variations enables businesses to understand competitive pricing more accurately.
A comprehensive pricing dataset may capture:
Historical price tracking provides even greater value. A company can determine whether a competitor raised the price of a meal from ₹249 to ₹269, introduced a 15% discount, or removed the promotion after several weeks.
This creates a continuous view of competitive pricing behavior rather than isolated snapshots.
Cross-platform restaurant data scrape enables businesses to compare the same restaurants across different marketplaces.
Entity matching is an important component of this process. Restaurant names can vary between platforms, and branches may have slightly different addresses or naming conventions. A robust data pipeline can use restaurant names, addresses, phone information, geographic proximity, cuisine, and menu similarities to identify potential matches.
Once matched, businesses can compare:
| Intelligence Area | Platform Comparison | Example Measurement | Business Value |
|---|---|---|---|
| Restaurant Coverage | Grubhub vs Postmates | 82,500 vs 76,400 restaurants | Market reach |
| Menu Depth | Grubhub vs Postmates | 14 vs 18 items/restaurant | Assortment analysis |
| Average Price | Grubhub vs Postmates | ₹285 vs ₹298 | Price benchmarking |
| Discount Rate | Grubhub vs Postmates | 16.2% vs 12.8% | Promotion analysis |
| Delivery Fee | Grubhub vs Postmates | ₹34 vs ₹41 | Customer cost comparison |
| Delivery ETA | Grubhub vs Postmates | 31 vs 36 minutes | Service benchmarking |
| Availability | Grubhub vs Postmates | 95.1% vs 92.7% | Catalog health |
| Rating | Grubhub vs Postmates | 4.2 vs 4.1 | Reputation comparison |
| Active Promotions | Grubhub vs Postmates | 8,450 vs 6,720 | Campaign monitoring |
| Menu Changes | Grubhub vs Postmates | 4.8% vs 3.6% monthly | Assortment volatility |
| Restaurant Exclusivity | Grubhub vs Postmates | 9,800 outlets | Marketplace differentiation |
| Price Gap | Grubhub vs Postmates | 7.4% | Pricing disparity |
Figures are illustrative and demonstrate how cross-platform data can be structured for research and benchmarking.
The following table demonstrates how actual platform names can be incorporated into a multi-market food delivery intelligence framework.
| Platform | Example Market | Restaurants Tracked | Menu Items | Avg. Listed Price ₹ | Avg. Discount % | Avg. Delivery Fee ₹ | Avg. ETA Min | Active Offers | Availability % | Daily Collection Cycles |
|---|---|---|---|---|---|---|---|---|---|---|
| Grubhub | United States | 12,500 | 145,000 | 286 | 14.8 | 38 | 34 | 8,450 | 94.2 | 8 |
| Postmates | United States | 11,800 | 139,000 | 292 | 15.6 | 36 | 33 | 8,920 | 94.8 | 8 |
| SkipTheDishes | Canada | 10,800 | 121,000 | 301 | 12.6 | 42 | 37 | 6,920 | 92.8 | 6 |
| Caviar | United States | 13,200 | 158,000 | 309 | 13.7 | 44 | 36 | 9,850 | 93.5 | 8 |
| HungryPanda | Selected Markets | 9,650 | 109,000 | 279 | 16.4 | 35 | 32 | 7,610 | 95.1 | 8 |
| Bolt Food | Selected Markets | 8,900 | 97,500 | 274 | 14.2 | 37 | 35 | 6,780 | 93.7 | 6 |
| Wolt | Selected Markets | 7,900 | 87,000 | 294 | 11.9 | 45 | 39 | 4,850 | 91.7 | 4 |
| HungerStation | GCC Markets | 6,750 | 76,500 | 271 | 18.2 | 31 | 30 | 5,980 | 96.0 | 8 |
| Ele.me | China | 14,500 | 182,000 | 238 | 17.5 | 22 | 28 | 11,400 | 96.4 | 12 |
| LINE MAN | Southeast Asia | 8,400 | 91,000 | 256 | 15.1 | 29 | 31 | 6,350 | 95.2 | 8 |
| Combined | Multi-Market | 104,700 | 1,206,000 | 275 | 15.0 | 36 | 33 | 75,110 | 94.3 | 76 |
All figures are illustrative research-model values and do not represent official platform-wide statistics.
Food delivery market intelligence becomes significantly more powerful when data is segmented by geography.
Businesses can compare restaurant density, cuisine distribution, average prices, discount levels, delivery times, restaurant coverage, and platform penetration across cities and neighborhoods.
For example, a company evaluating expansion into a new city could measure the number of restaurants already operating in each locality, identify dominant cuisine categories, calculate average meal prices, and determine how heavily competitors rely on discounts.
Geographic analysis can also identify underserved areas.
A neighborhood with high consumer density but relatively low restaurant coverage may represent an expansion opportunity. Similarly, a location with numerous restaurants but long delivery estimates could reveal operational inefficiencies or potential demand for additional fulfillment capacity.
A professional Food Delivery App Data Scraping process workflow generally consists of multiple stages.
Source Identification: The first stage defines target marketplaces, geographic areas, restaurant categories, cuisines, and required data fields.
Automated Collection: Relevant publicly accessible marketplace information is collected according to predefined schedules.
Parsing and Normalization: Raw information is transformed into standardized fields. For example, different platforms may use different terminology for selling prices, discounts, fees, and availability.
Entity Matching: Restaurants, branches, menu items, and brands are matched across platforms to reduce duplication and enable accurate comparison.
Data Validation: Automated checks identify missing values, duplicate records, unusual prices, broken fields, and unexpected changes.
Historical Storage: Timestamped records are retained so businesses can compare current marketplace conditions with previous observations.
Data Delivery: Final datasets can be delivered through CSV, Excel, JSON, databases, APIs, cloud storage, or scheduled data feeds according to business requirements.
Restaurant groups can use collected data to monitor competitors operating within the same geographic market.
Scraping Food Delivery Data and competitive monitoring can reveal new restaurant openings, menu expansions, price increases, discount campaigns, new meal bundles, premium product launches, and changes in delivery coverage.
Marketing teams can also analyze promotional intensity. If competitors repeatedly use aggressive discounts during weekends, a restaurant can evaluate whether similar campaigns are necessary or whether differentiation through menu quality and service could provide a better strategy.
Menu managers can identify gaps by comparing their own assortment against nearby competitors.
For example, if competing restaurants consistently offer family meal bundles while a particular chain does not, that absence becomes a measurable assortment gap.
Availability is another critical dimension of food delivery intelligence.
A restaurant can remain visible on a marketplace while individual menu items become unavailable. Tracking item-level availability helps businesses identify potential operational problems.
Repeated unavailability of popular menu items may indicate supply constraints, kitchen capacity limitations, or inventory-management issues.
Delivery estimates provide another important signal.
Monitoring delivery times throughout the day can reveal patterns such as longer ETAs during lunch and dinner peaks. Comparing these patterns across marketplaces helps businesses understand competitive fulfillment performance.
Large-scale scraping projects require strong data-quality processes.
Duplicate detection is essential because the same restaurant may appear multiple times due to branches, naming differences, or changes in marketplace structure.
Timestamping is equally important because prices and availability are dynamic.
A high-quality dataset should ideally preserve:
Validation systems can identify unusual changes such as a menu item price increasing by several hundred percent within a short period or a restaurant suddenly disappearing from a geographic area.
For larger projects, cloud storage, databases, scheduled pipelines, distributed processing, monitoring systems, and incremental updates can improve reliability and scalability.
The real strategic value of food delivery scraping increases when businesses maintain historical records.
A single snapshot can show current marketplace conditions, but historical data can reveal trends.
Companies can determine which restaurants consistently raise prices, which menu categories experience frequent price changes, which competitors use the most aggressive promotions, and which areas are experiencing restaurant growth.
Historical data can also support forecasting models.
Price trends, menu launches, restaurant openings, promotional cycles, availability changes, and delivery-time patterns can become inputs for predictive analytics.
This enables businesses to move from reactive monitoring toward proactive decision-making.
| Metric | Measurement Method | Illustrative Value | Recommended Frequency | Strategic Importance |
|---|---|---|---|---|
| Average Menu Price | Total item prices ÷ total items | ₹275 | Daily | Pricing benchmark |
| Average Discount | Total discounts ÷ eligible items | 15.0% | Daily | Promotion intensity |
| Average Delivery Fee | Total fees ÷ orders observed | ₹36 | Hourly | Customer cost |
| Average ETA | Total ETAs ÷ observations | 33 min | Hourly | Delivery competitiveness |
| Availability Rate | Available items ÷ total items | 94.3% | Hourly | Catalog health |
| Menu Change Rate | Changed items ÷ total items | 4.8% | Daily | Menu volatility |
| Restaurant Growth | New outlets ÷ existing outlets | 1.9% | Weekly | Market expansion |
| Price Gap | Platform price difference | 7.4% | Daily | Price disparity |
| Promotion Frequency | Offers ÷ restaurants | 2.7 | Daily | Campaign activity |
| Rating Average | Total ratings ÷ restaurants | 4.2/5 | Daily | Customer perception |
| Out-of-Stock Rate | Unavailable items ÷ total items | 5.7% | Hourly | Availability pressure |
| Delivery Coverage | Deliverable restaurants ÷ total restaurants | 91.6% | Daily | Service reach |
Values are illustrative examples for research and analytics modeling.
Food delivery intelligence is moving toward increasingly automated and predictive systems.
Artificial intelligence can improve restaurant entity matching, menu categorization, duplicate detection, sentiment analysis, image classification, price anomaly detection, and promotional pattern recognition.
Real-time monitoring can also enable businesses to respond quickly to competitor changes. A sudden price reduction, new promotion, menu launch, or delivery improvement can be detected and evaluated without waiting for a periodic manual market study.
As food delivery marketplaces continue to expand, the organizations that can transform marketplace activity into structured intelligence will have a stronger foundation for pricing, assortment, marketing, operations, and market-entry decisions.
Food delivery marketplaces generate enormous quantities of changing information every day. Restaurants add products, modify prices, introduce promotions, adjust delivery areas, and change availability, while competing platforms continuously alter their assortment and customer-facing offers.
Delivery App Data Scraping allows businesses to systematically capture these changes and transform marketplace activity into structured competitive intelligence.
Companies can Scrape Data from Food Delivery Apps to create detailed datasets covering restaurants, menus, prices, discounts, delivery estimates, ratings, availability, promotions, and geographic coverage.
When combined with broader Food Data Scraping capabilities, this information can support restaurant benchmarking, menu optimization, price intelligence, market expansion, promotional analysis, delivery performance monitoring, and long-term food delivery market research.
The strongest food delivery intelligence strategy is not simply about collecting a large number of records. It requires accurate extraction, consistent normalization, reliable entity matching, timestamped historical storage, data validation, and analytical frameworks that convert raw observations into actionable business decisions.
If you are seeking for a reliable data scraping services, Food Data Scrape is at your service. We hold prominence in Food Data Aggregator and Mobile Restaurant App Scraping with impeccable data analysis for strategic decision-making.



