

The Food Delivery Intelligence in Los Angeles report provides a comprehensive analysis of the city's rapidly evolving online food delivery ecosystem. It examines restaurant performance, cuisine popularity, delivery efficiency, pricing strategies, customer ratings, promotional activities, and competitive positioning across major delivery platforms. The report highlights how structured delivery data enables restaurants, franchise operators, investors, and market researchers to identify emerging trends, benchmark competitors, and optimise business strategies. It also explores regional demand variations across Los Angeles neighbourhoods, revealing how consumer preferences differ by location and cuisine category. Using quantitative datasets, the report demonstrates how delivery intelligence supports pricing optimisation, menu planning, operational improvements, and customer engagement initiatives. Additionally, it discusses scalable data collection methodologies, automation, and analytics that transform raw delivery information into actionable business insights. As digital food ordering continues to expand, organisations leveraging reliable delivery intelligence can make faster, evidence-based decisions, improve market responsiveness, and strengthen their competitive advantage within one of the United States' largest and most dynamic food delivery markets.
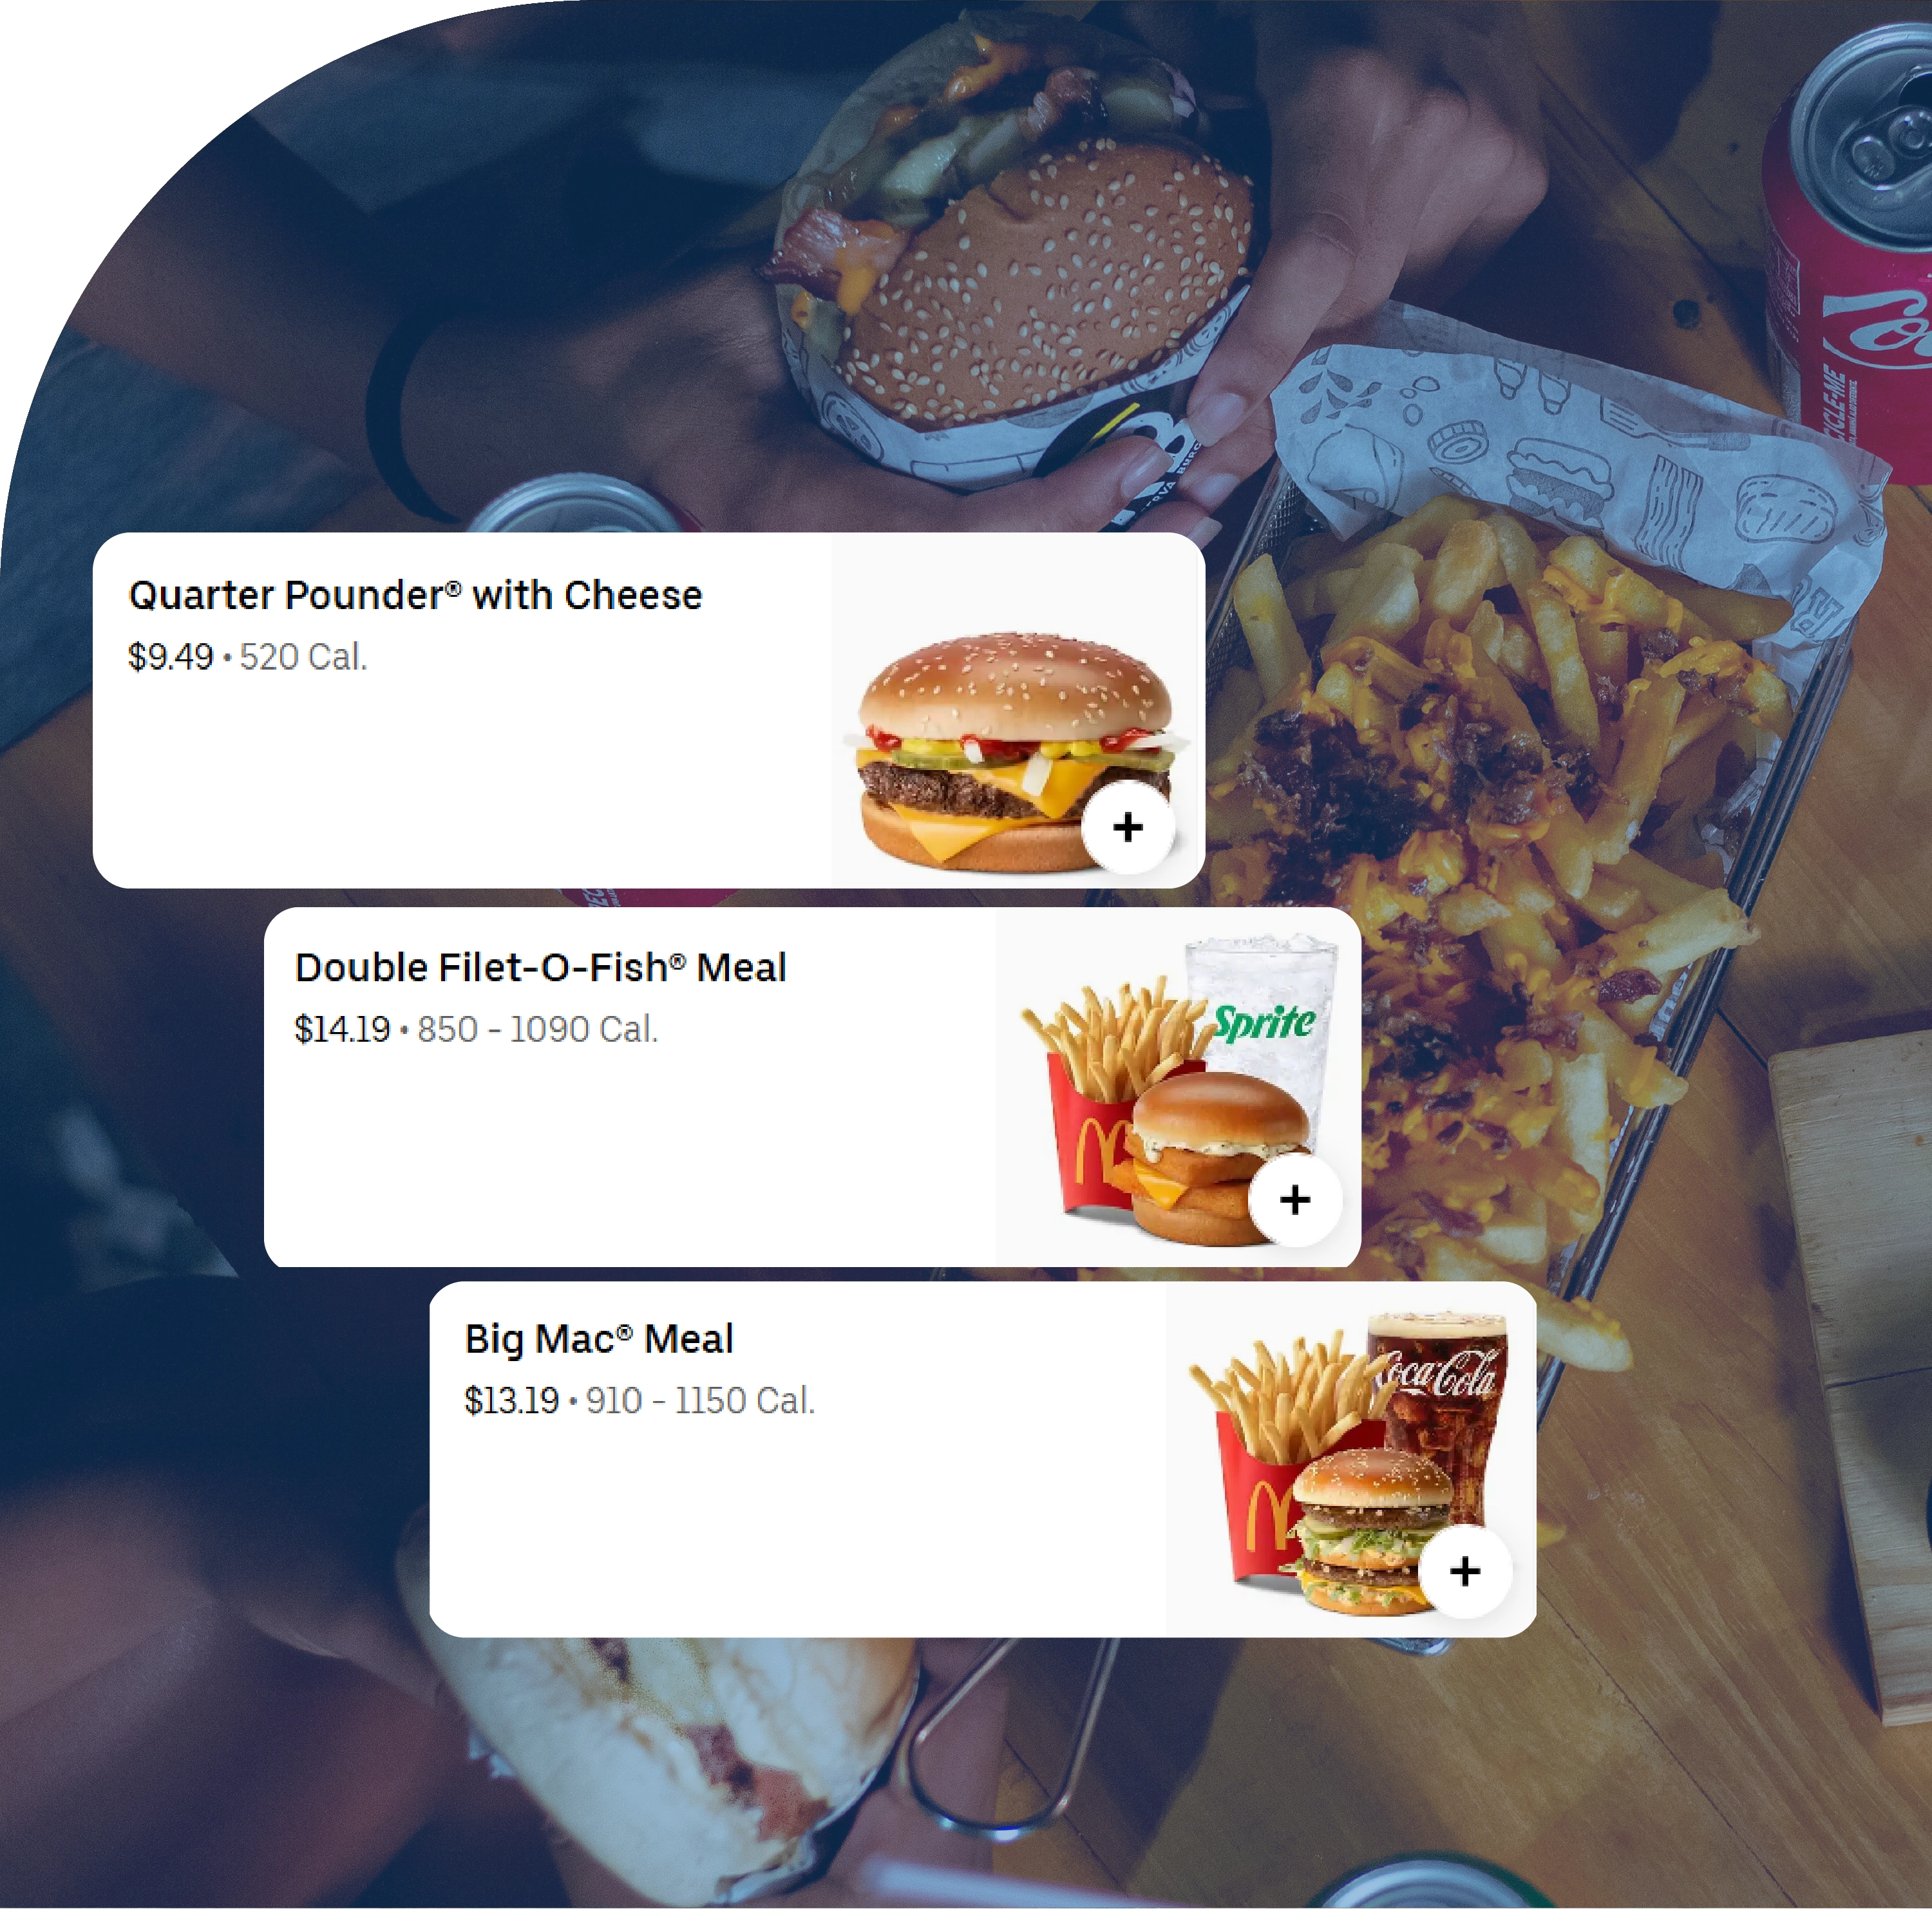
Cuisine Growth
Mexican cuisine records highest monthly orders, while Japanese achieves largest average basket values.
Platform Performance
Major delivery platforms demonstrate varying delivery speeds, promotions, pricing, and customer retention rates.
Pricing Intelligence
Delivery pricing analysis supports competitive benchmarking, revenue optimisation, and strategic promotional planning.
Consumer Insights
Customer ratings and ordering behaviour reveal evolving dining preferences across Los Angeles neighbourhoods.
Market Intelligence
Structured delivery datasets enable informed decisions through continuous restaurant performance monitoring and analysis.

The food delivery ecosystem in Los Angeles has become one of the most dynamic digital commerce markets in North America. With thousands of restaurants, multiple delivery platforms, changing customer preferences, and intense pricing competition, businesses increasingly rely on structured data to understand market behaviour. Restaurants, cloud kitchens, franchise operators, investors, and analytics firms monitor delivery performance to identify emerging opportunities and improve operational efficiency.
Food Delivery Intelligence In Los Angeles enables organisations to evaluate restaurant visibility, delivery pricing, promotional campaigns, menu expansion, customer ratings, cuisine popularity, and regional demand patterns. By analysing structured datasets collected from food delivery platforms, businesses gain measurable insights into changing consumer behaviour and competitive positioning.
Scrape Food Delivery Data from leading delivery platforms allows businesses to monitor menu updates, delivery fees, promotional discounts, restaurant availability, cuisine trends, and customer engagement in near real time.
Los Angeles Food Delivery Data Scraping supports market intelligence by collecting restaurant listings, menu information, pricing variations, ratings, preparation times, delivery coverage, and promotional campaigns across neighbourhoods throughout the city.
Los Angeles represents a highly fragmented delivery market where consumer preferences differ significantly across Downtown LA, Santa Monica, Hollywood, Beverly Hills, Pasadena, Glendale, Culver City, and surrounding metropolitan regions. These regional variations create substantial opportunities for businesses capable of transforming delivery data into actionable intelligence.
The modern food delivery ecosystem extends well beyond simply fulfilling online orders. Delivery platforms generate enormous volumes of commercial information every minute, including:
These data points provide valuable indicators of market health and competitive performance. Businesses that continuously analyse these datasets can identify growth opportunities before competitors react.
Delivery intelligence also enables operators to compare performance across multiple platforms while identifying inconsistencies in pricing, promotions, and customer satisfaction.
Los Angeles has one of America's largest restaurant ecosystems, supported by diverse demographics and strong digital adoption. The city contains thousands of independent restaurants alongside national and regional chains competing across multiple food delivery applications.
Consumer demand frequently shifts according to:
These variables create continuously changing delivery demand that requires ongoing monitoring rather than periodic market research.
The following dataset illustrates representative delivery performance metrics across major cuisine categories operating throughout Los Angeles.
| Cuisine Category | Active Restaurants | Avg Menu Items | Avg Delivery Time (Minutes) | Avg Delivery Fee (USD) | Avg Customer Rating | Monthly Orders | Avg Basket Value (USD) |
|---|---|---|---|---|---|---|---|
| American Burgers | 1,285 | 74 | 33 | 4.20 | 4.51 | 462,300 | 31.80 |
| Pizza | 1,012 | 58 | 31 | 3.95 | 4.49 | 428,900 | 29.40 |
| Mexican | 1,436 | 66 | 34 | 4.05 | 4.56 | 518,400 | 27.60 |
| Japanese | 912 | 83 | 37 | 4.75 | 4.63 | 302,500 | 42.30 |
| Chinese | 1,104 | 96 | 35 | 4.40 | 4.48 | 387,700 | 34.90 |
| Thai | 684 | 69 | 36 | 4.28 | 4.58 | 218,900 | 30.70 |
| Indian | 472 | 81 | 39 | 4.55 | 4.67 | 154,600 | 36.80 |
| Mediterranean | 591 | 63 | 32 | 4.18 | 4.60 | 206,300 | 29.90 |
| Korean | 503 | 77 | 35 | 4.36 | 4.59 | 167,900 | 38.20 |
| Vegan | 418 | 54 | 30 | 4.12 | 4.71 | 148,400 | 26.50 |
| Dessert | 736 | 41 | 29 | 3.85 | 4.65 | 251,700 | 18.90 |
| Healthy Bowls | 527 | 49 | 28 | 3.78 | 4.69 | 189,800 | 24.60 |
The data indicates that Mexican cuisine records the highest monthly order volume, while Japanese restaurants generate the highest average basket value. Vegan and healthy food providers achieve some of the strongest customer satisfaction ratings despite serving comparatively smaller customer segments.
Restaurant operators increasingly depend on continuous market monitoring to understand competitive movements. Delivery intelligence helps identify pricing adjustments, menu innovations, seasonal offerings, limited-time promotions, and changes in customer preferences.
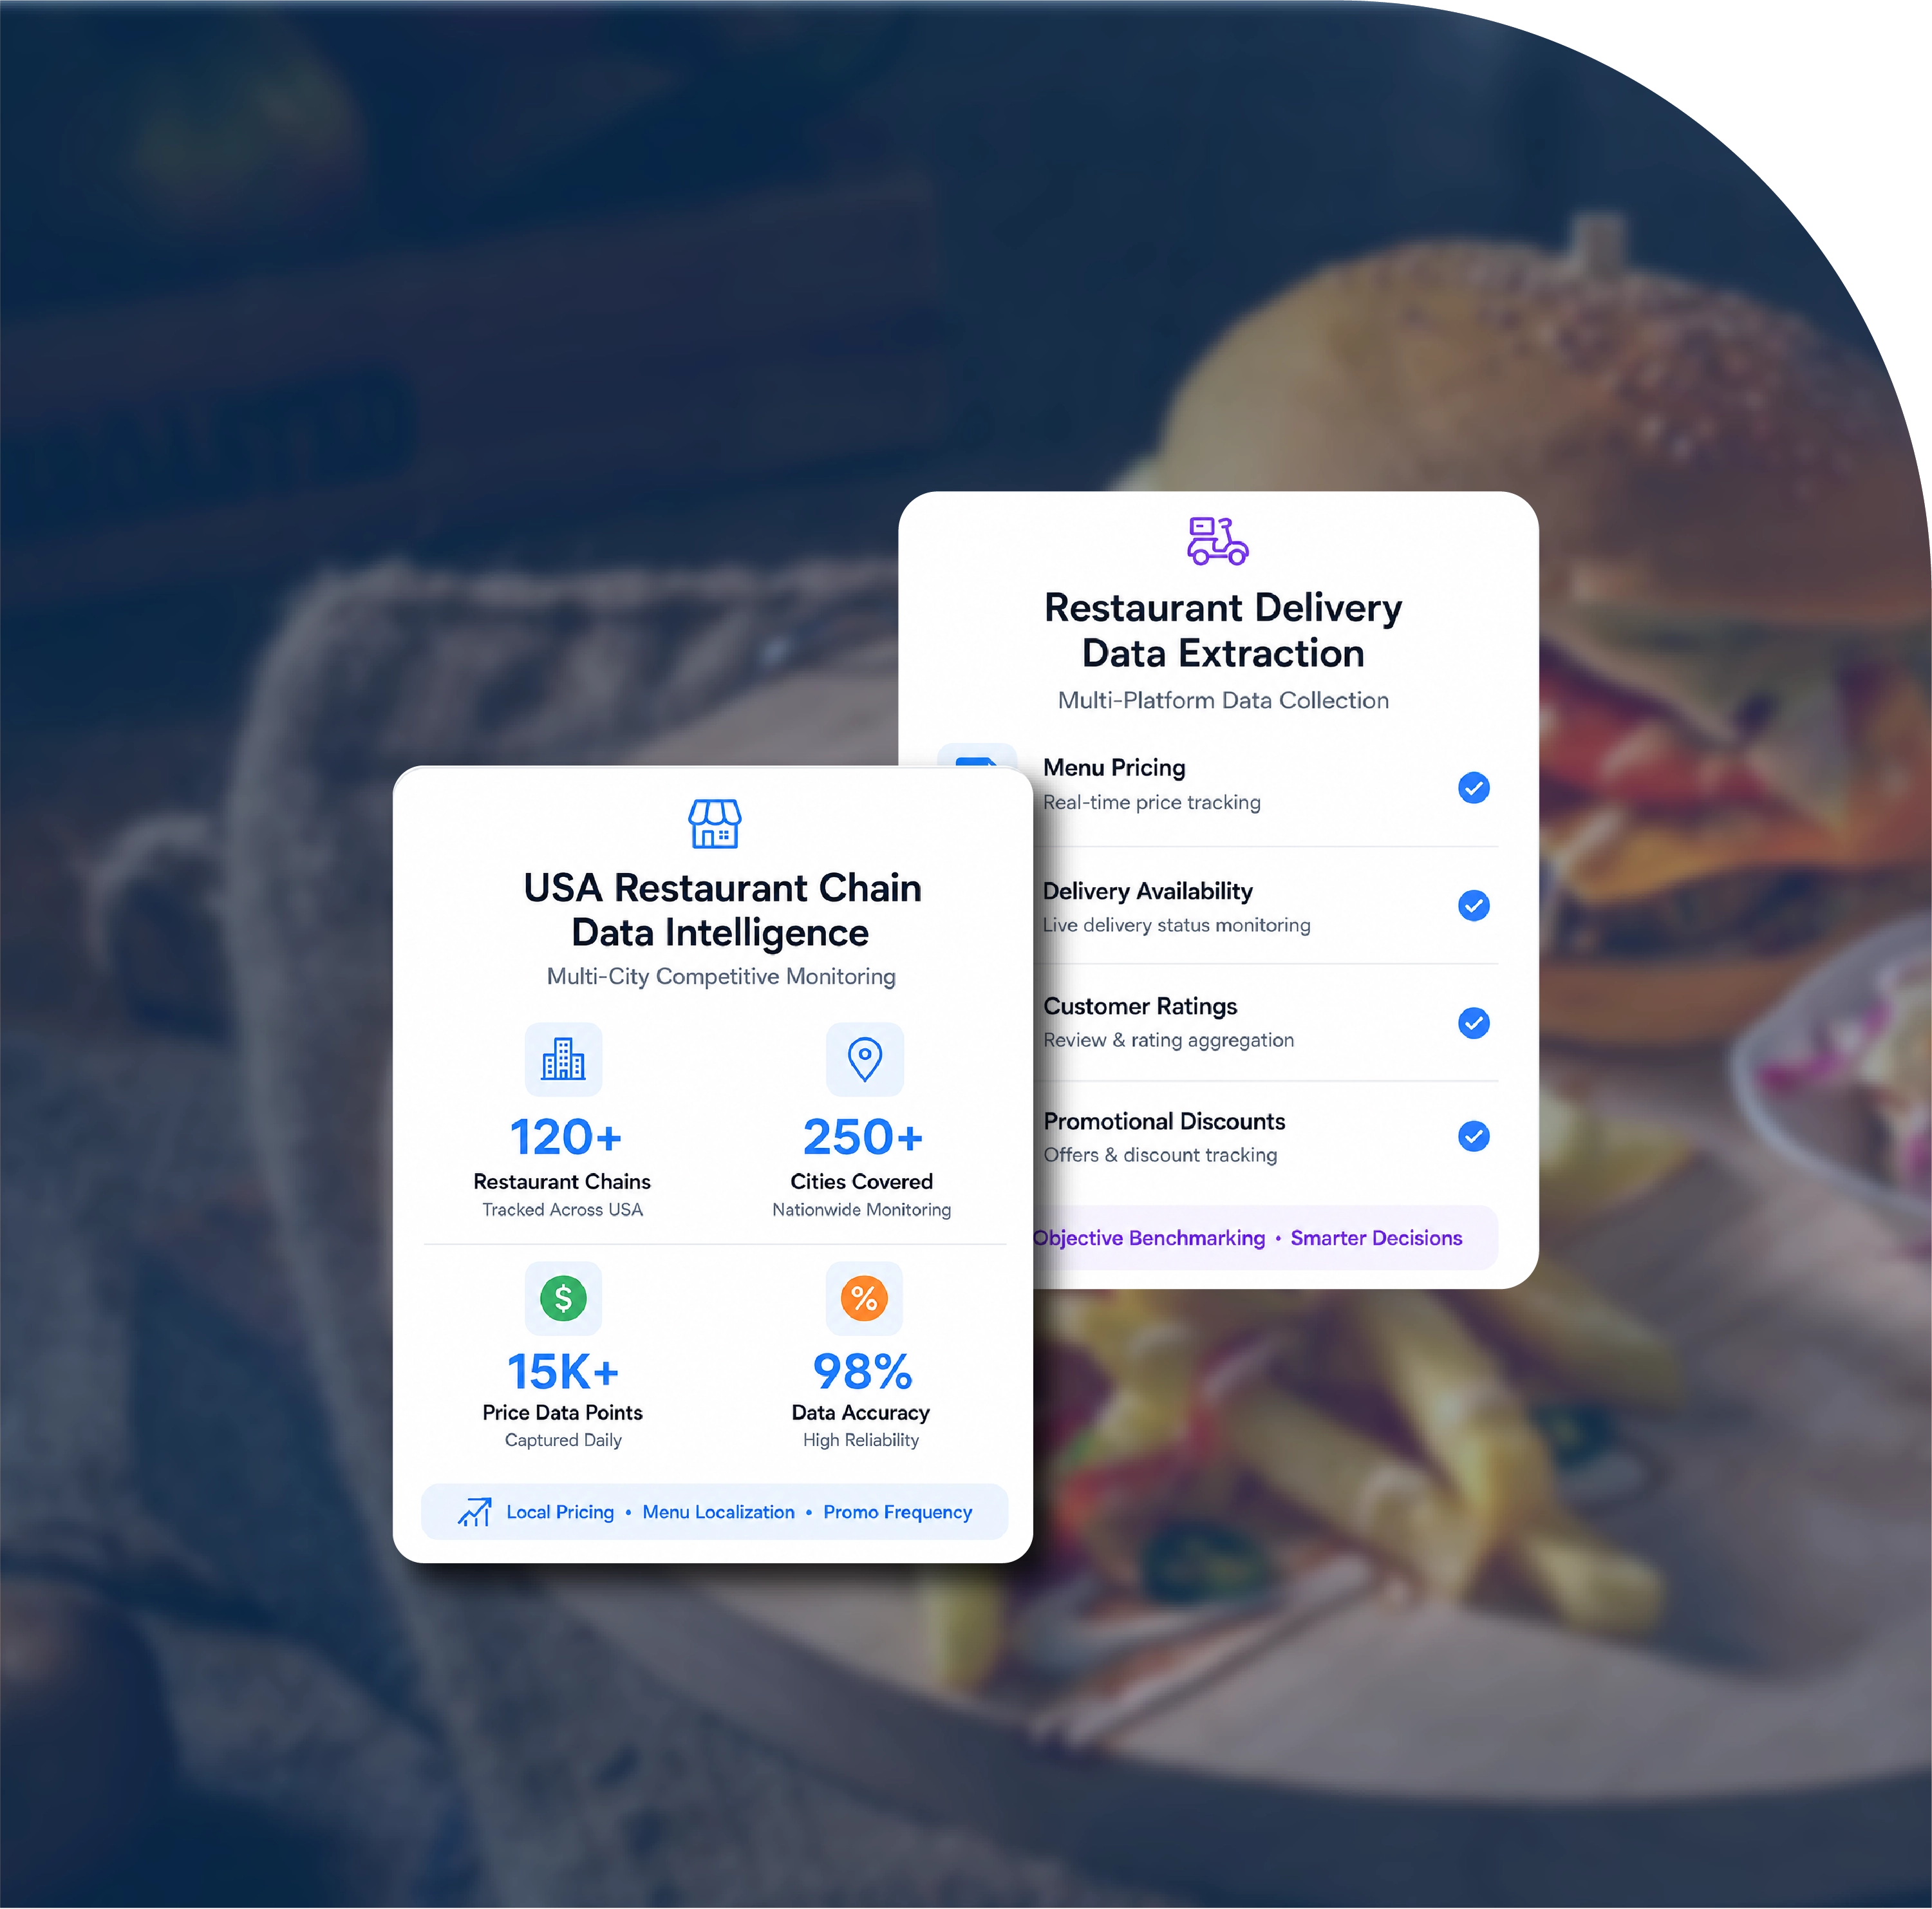
USA Restaurant Chain Data Scraping enables organisations to compare national brands operating across different cities while identifying local pricing differences, menu localisation strategies, and promotional frequency.
Businesses also benefit from Restaurant Delivery Data Extraction by collecting structured information about menu pricing, delivery availability, customer ratings, and promotional discounts from multiple delivery platforms simultaneously.
These datasets allow organisations to benchmark competitors using objective performance indicators rather than assumptions.
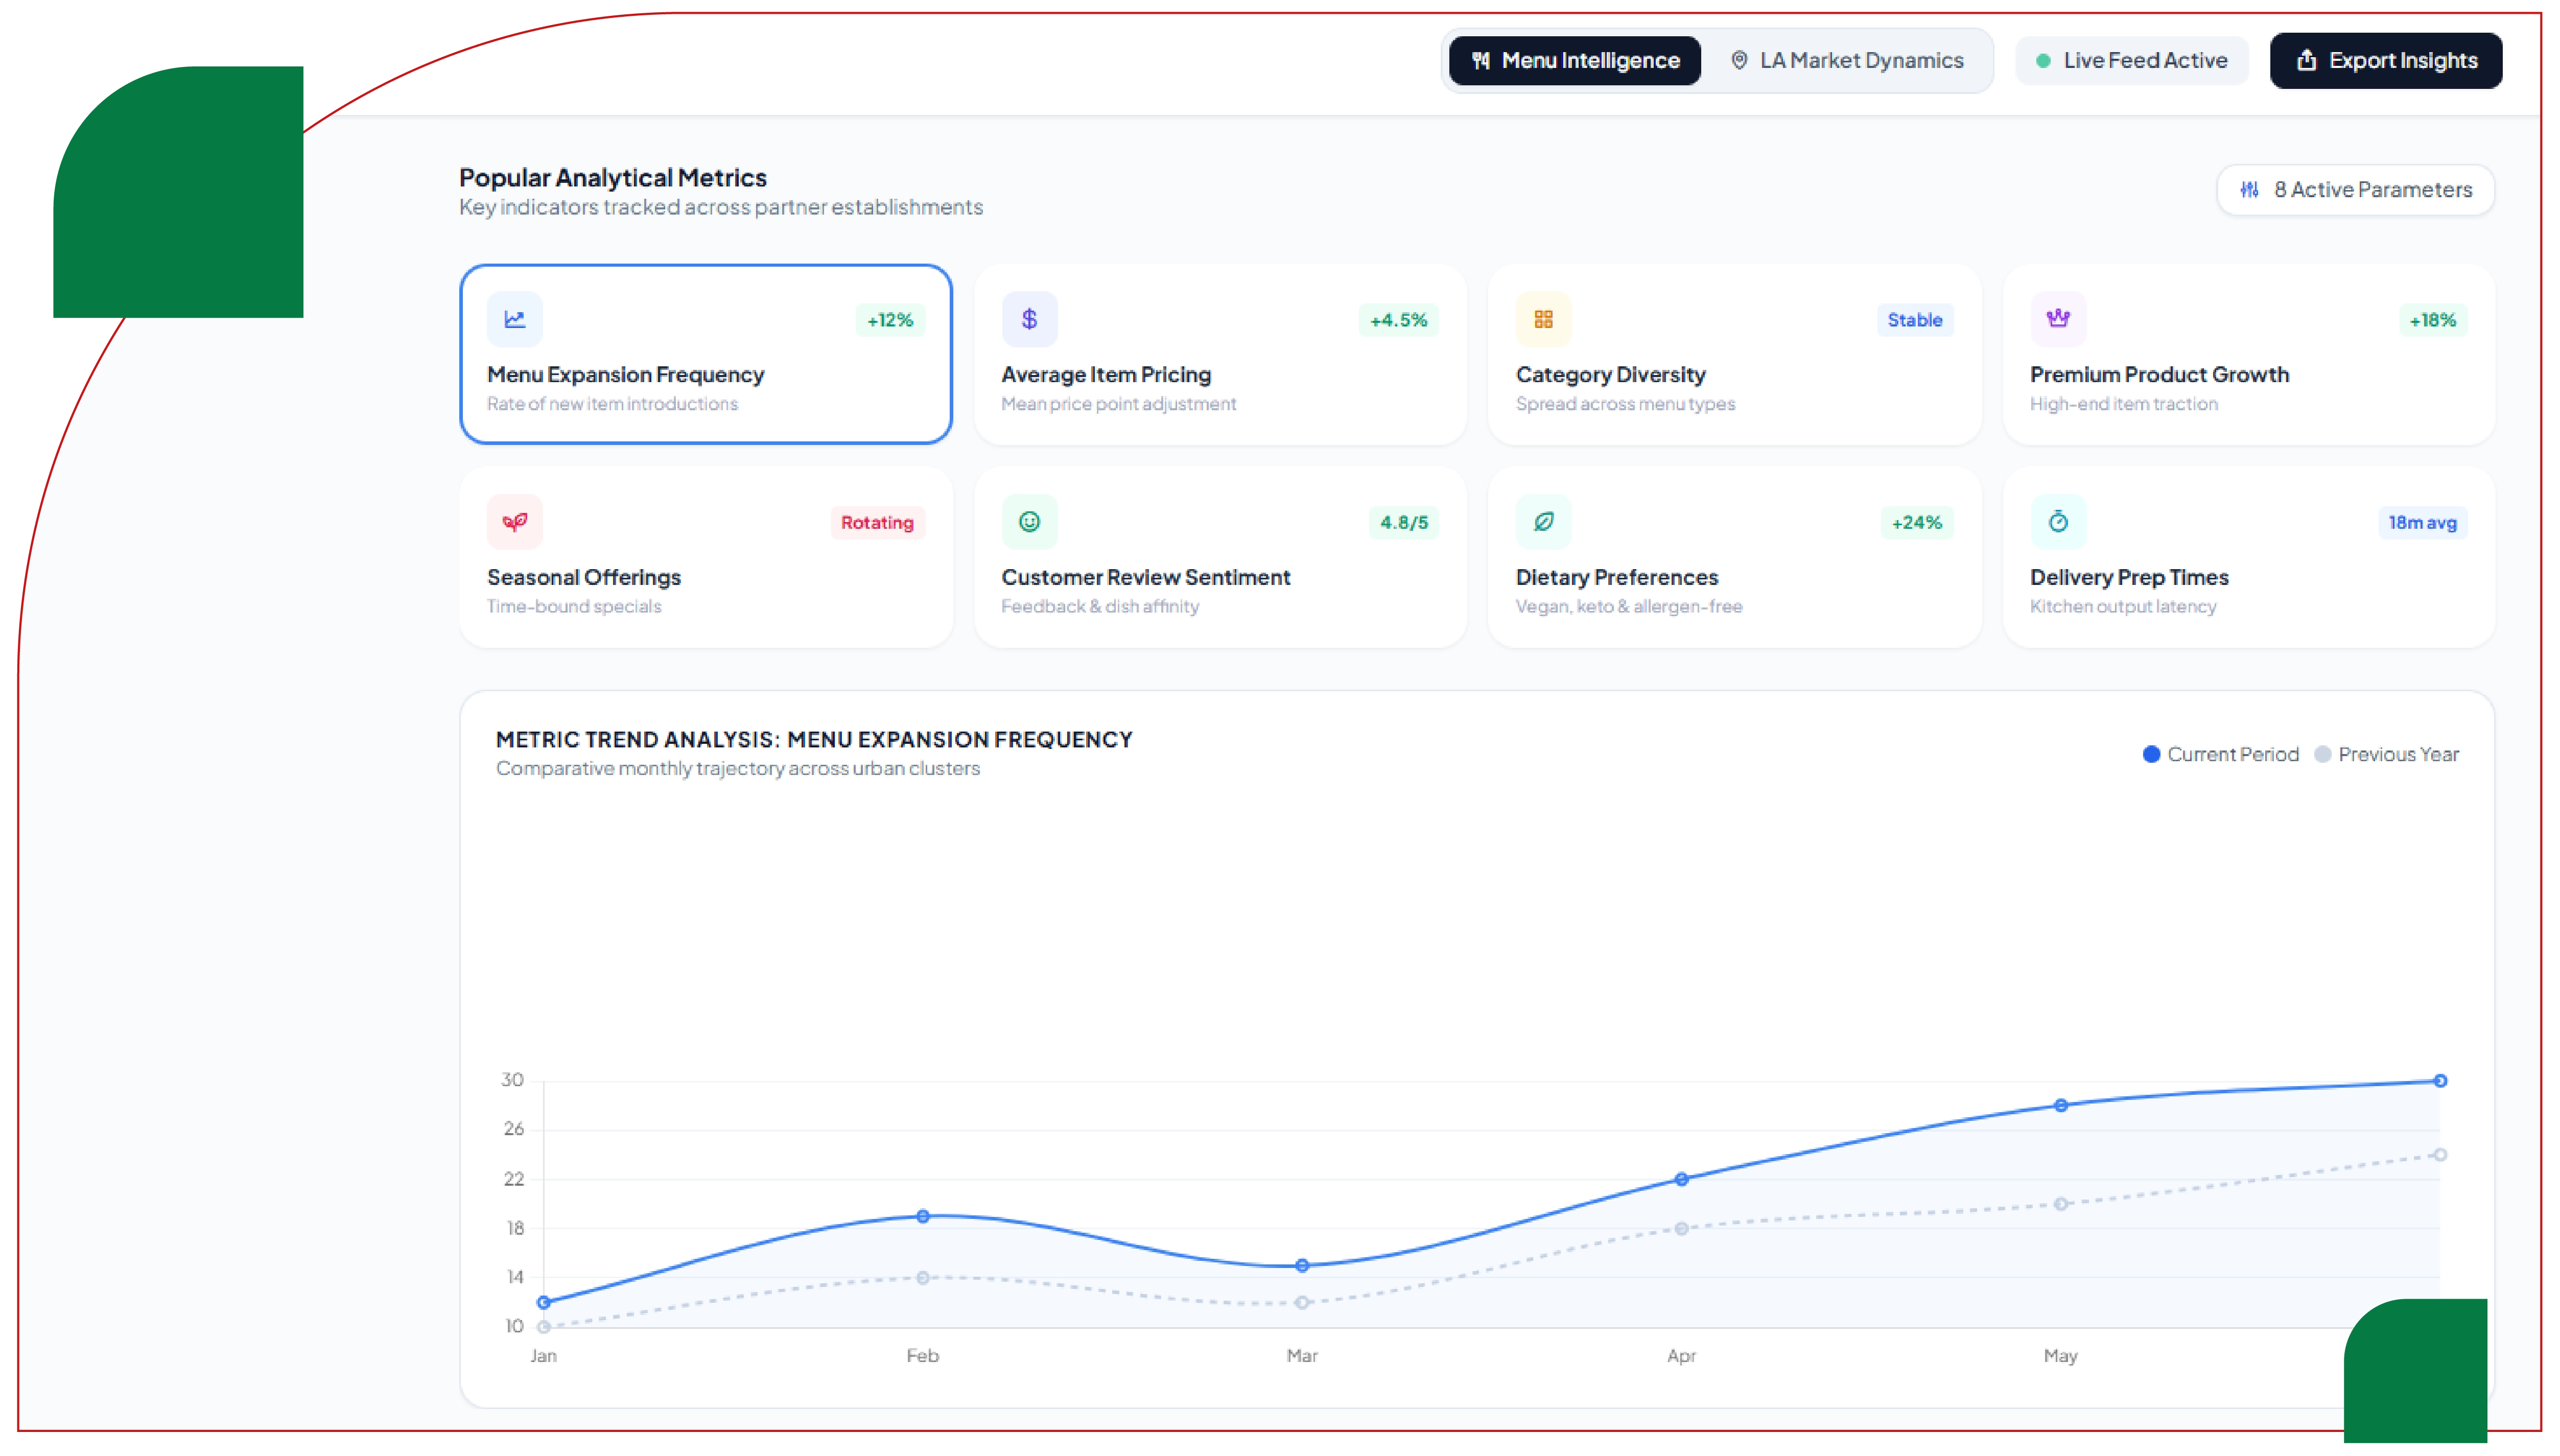
Menu analytics reveal changing consumer preferences at both neighbourhood and citywide levels. Businesses can identify high-performing categories, underperforming menu items, and emerging cuisine trends.
Popular analytical metrics include:
Restaurants frequently adjust menus according to customer demand, ingredient availability, and promotional campaigns. Monitoring these changes helps businesses understand evolving market expectations.
The following table demonstrates representative operational metrics collected from major delivery platforms serving Los Angeles.
| Performance Metric | Uber Eats | DoorDash | Grubhub | Postmates | City Average |
|---|---|---|---|---|---|
| Active Restaurants | 9,420 | 8,985 | 7,814 | 6,971 | 8,298 |
| Average Delivery Time (Minutes) | 32 | 34 | 36 | 35 | 34 |
| Average Delivery Fee (USD) | 4.12 | 4.38 | 4.57 | 4.09 | 4.29 |
| Average Menu Items | 69 | 72 | 65 | 67 | 68 |
| Customer Rating | 4.58 | 4.54 | 4.49 | 4.56 | 4.54 |
| Promotional Restaurants | 3,912 | 3,601 | 2,984 | 2,747 | 3,311 |
| Average Discount (%) | 18 | 21 | 16 | 19 | 19 |
| Orders per Restaurant | 412 | 396 | 372 | 384 | 391 |
| Average Basket Value (USD) | 31.80 | 30.90 | 29.40 | 31.10 | 30.80 |
| New Restaurants Added Monthly | 286 | 274 | 241 | 218 | 255 |
| Average Delivery Radius (Miles) | 6.8 | 6.4 | 7.2 | 6.6 | 6.8 |
| Customer Repeat Rate (%) | 63 | 61 | 58 | 62 | 61 |
The figures illustrate that operational efficiency differs across platforms despite serving similar restaurant inventories. Promotional activity, customer retention, and delivery speed remain important competitive differentiators.
Businesses use delivery intelligence across multiple operational functions.
Pricing analysts evaluate menu pricing consistency while identifying discounting strategies adopted by competitors.
Marketing teams analyse promotional campaigns to understand customer acquisition strategies.
Restaurant operators monitor customer ratings to improve service quality and operational efficiency.
Investors assess market saturation, cuisine growth, and regional demand before funding restaurant expansion.
Supply chain planners forecast ingredient demand using order volume trends collected from delivery platforms.
These applications demonstrate how delivery intelligence supports evidence-based business decisions rather than intuition.
Reliable delivery intelligence requires scalable collection processes capable of handling continuously changing restaurant information.
Businesses often Extract USA restaurant chain data from multiple delivery applications to monitor national brand performance across metropolitan markets.
Analysts also generate Food Delivery Market Intelligence by integrating menu data, delivery fees, customer ratings, promotional campaigns, restaurant availability, and operational performance into unified analytical dashboards.
Meanwhile, Food Data Scraping in the USA enables companies to compare thousands of restaurants across cities while maintaining consistent data quality and structured formats for reporting and predictive analysis.
Modern analytics platforms typically validate collected information before integrating datasets into business intelligence systems for ongoing monitoring.
Several industry trends continue influencing restaurant performance across Los Angeles.
Growing consumer demand for healthier meals has accelerated menu diversification. Restaurants increasingly introduce plant-based offerings, protein-focused meals, and low-calorie alternatives.
Dynamic pricing strategies continue expanding as restaurants optimise prices according to demand, operating hours, and regional competition.
Subscription-based delivery programmes encourage higher customer retention while reducing delivery costs for frequent users.
AI-powered recommendation engines personalise menu visibility based on previous purchasing behaviour.
Web Scraping Food Delivery Data enables continuous monitoring of these evolving market dynamics while supporting predictive analytics for future demand forecasting.
Similarly, businesses increasingly Extract Restaurant Menu Data to identify pricing adjustments, ingredient innovations, seasonal offerings, and competitive menu positioning across multiple restaurant categories.
Advanced automation supported by Food Delivery Scraping API solutions further improves collection speed, scalability, and data consistency for enterprise-level intelligence operations.
Los Angeles continues to represent one of the most competitive and rapidly evolving food delivery ecosystems in North America. Success increasingly depends upon timely access to structured market intelligence rather than isolated operational metrics. Organisations capable of analysing restaurant performance, menu evolution, customer behaviour, pricing trends, and promotional activity gain stronger competitive advantages across highly dynamic markets.
Future growth will increasingly rely upon integrated Restaurant Data Intelligence platforms capable of combining operational, commercial, and consumer datasets into actionable business insights. As delivery ecosystems become more sophisticated, comprehensive Food delivery Intelligence will remain central to strategic planning, competitive benchmarking, market forecasting, and digital transformation initiatives. High-quality Food Datasets will continue supporting restaurants, investors, technology providers, and researchers seeking measurable advantages within the evolving food delivery economy.
If you are seeking for a reliable data scraping services, Food Data Scrape is at your service. We hold prominence in Food Data Aggregator and Mobile Restaurant App Scraping with impeccable data analysis for strategic decision-making.



