

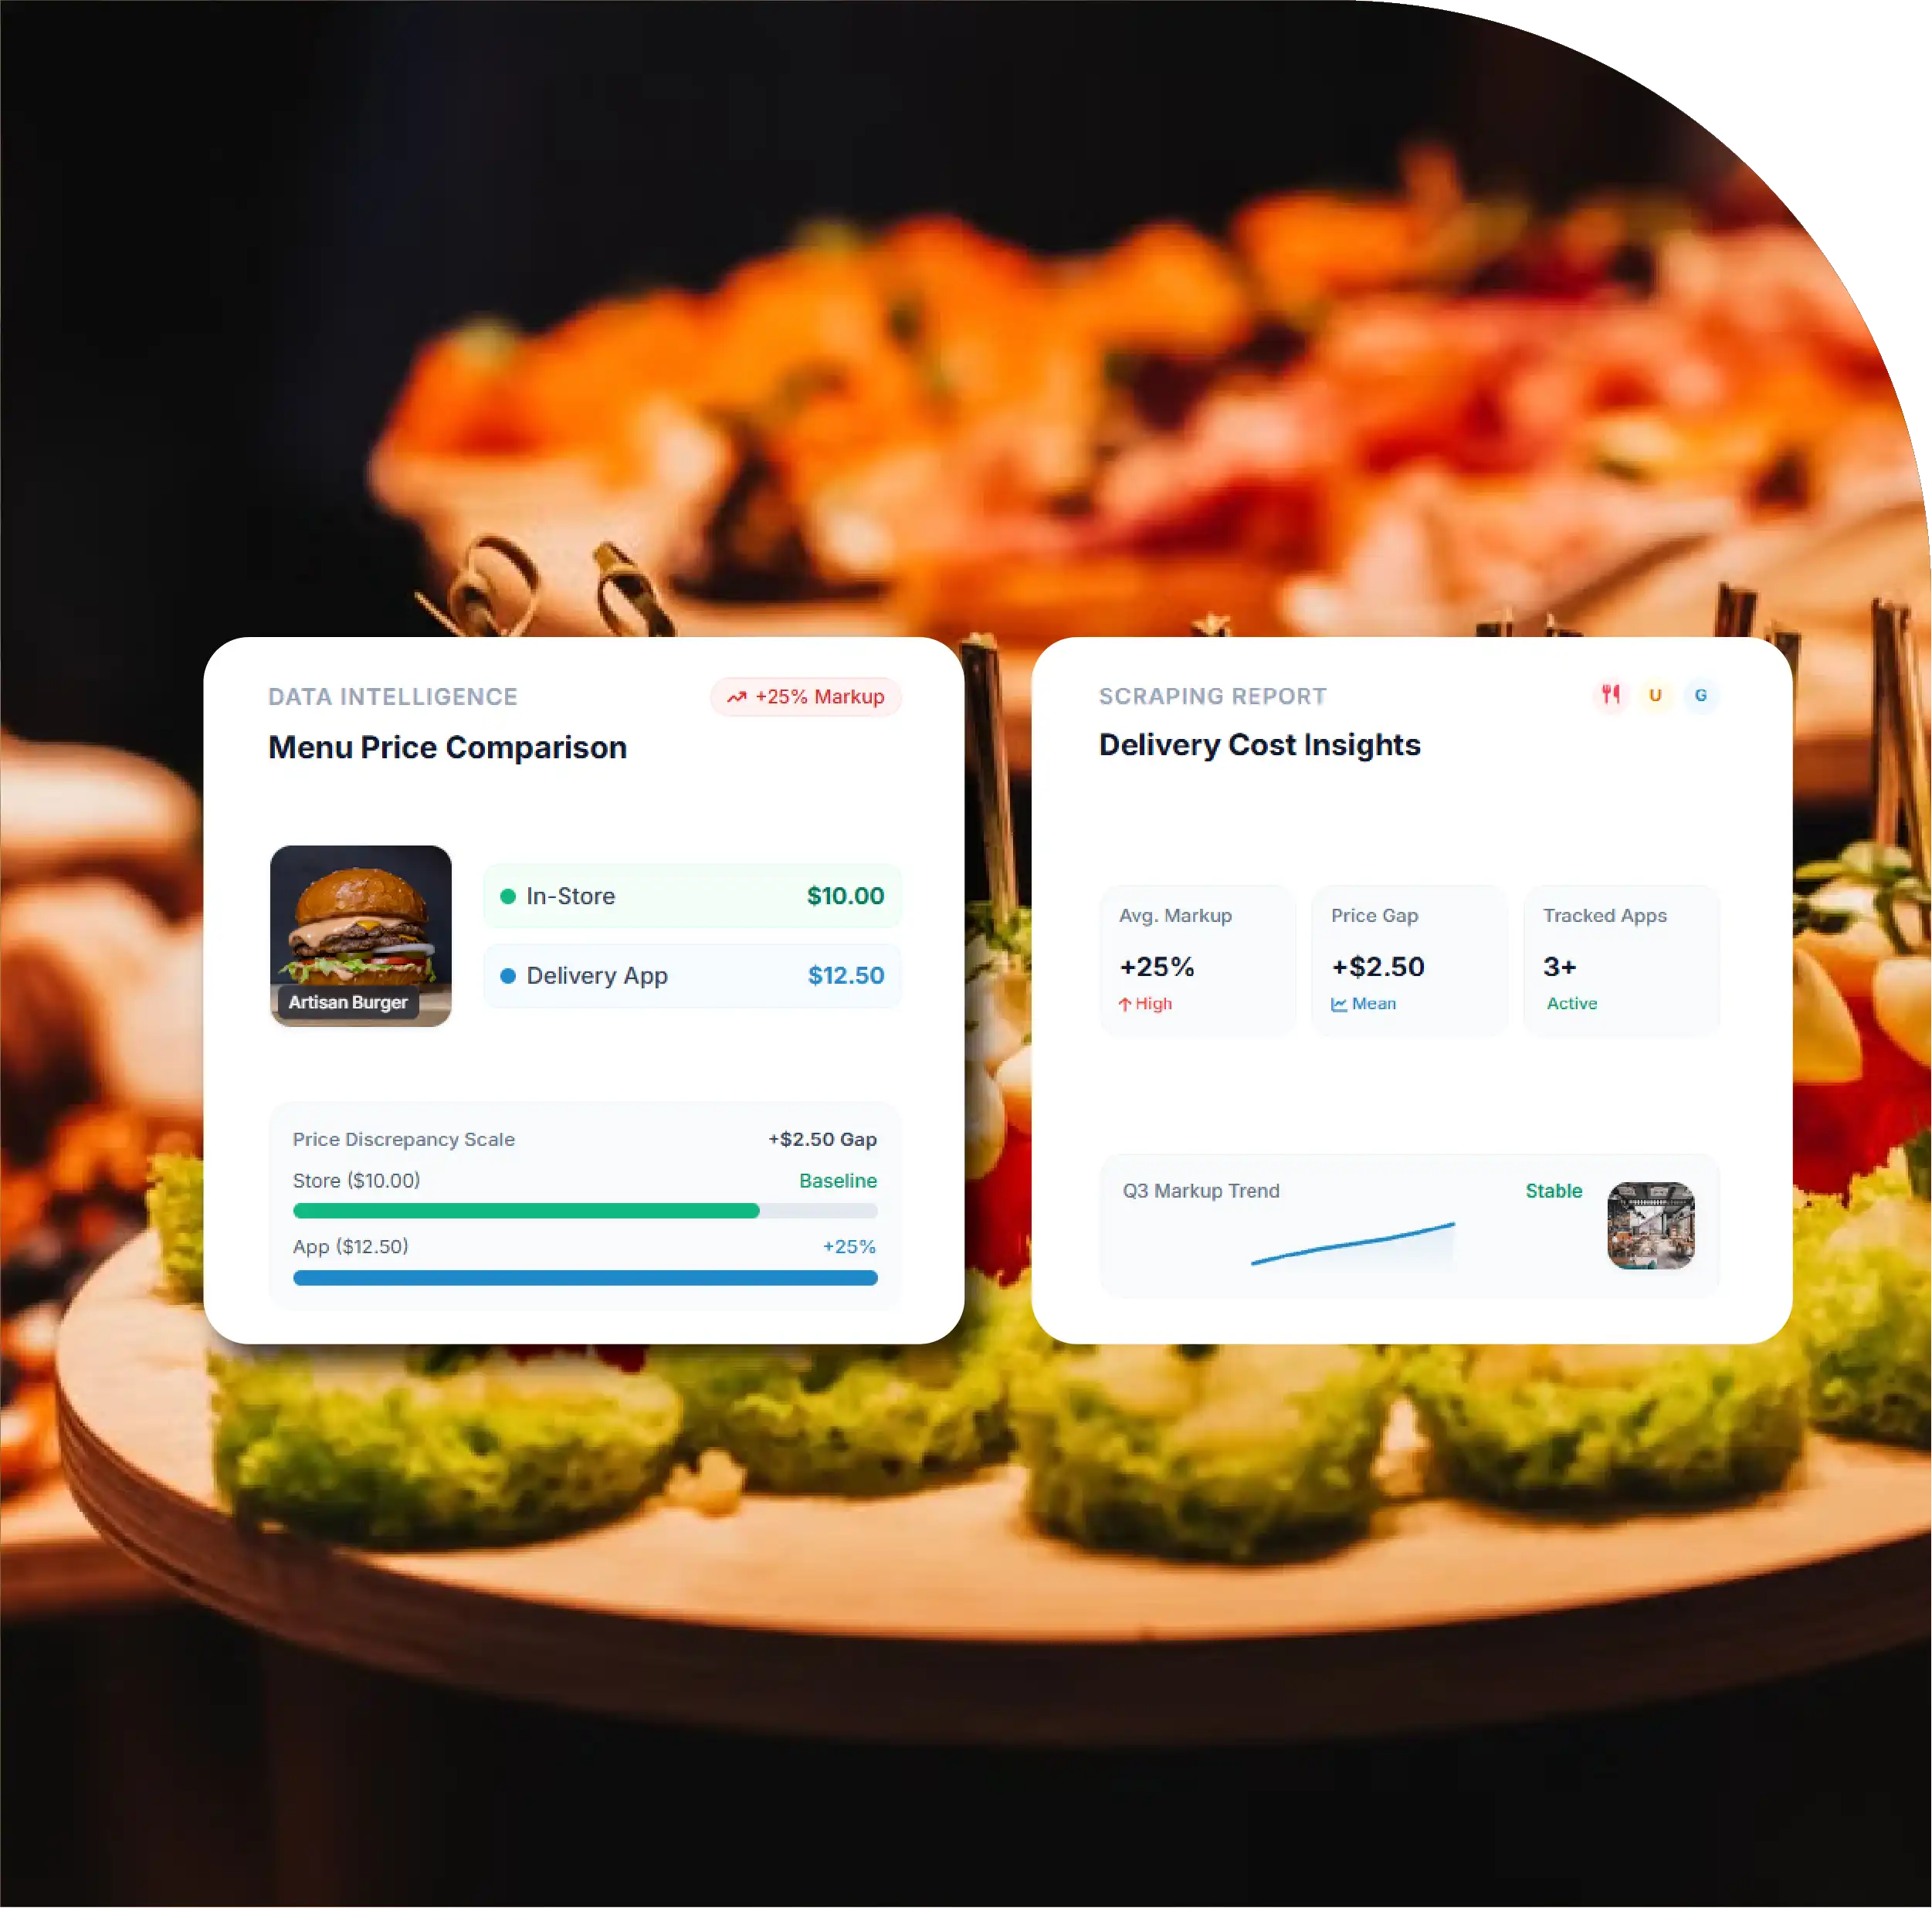

The median delivery-app markup is 18% over in-store prices for the same item.
Markups vary widely by restaurant type: 8% for some national chains, up to 30% for independent cafés and bakeries.
The same restaurant often prices differently on each app, with gaps of 3 to 6 percentage points between platforms.
Low-price items carry the highest percentage markups, because commissions apply to small baskets too.
About one in five restaurants shows no markup at all, often absorbing the commission or recovering it through fees.

For restaurant operators
Commission rates on the main US delivery platforms commonly range from about 15% to 30% of the order value, depending on the plan the restaurant chooses. If menu prices on the app are the same as in the store, that commission comes straight out of margin. If prices are set too high, conversion falls and customers switch to a competitor. Knowing what similar restaurants charge on each platform helps operators find the right balance.
For franchise groups
Franchisors want consistent pricing across outlets and platforms. Franchisees often set delivery prices individually, which creates inconsistent customer experiences and makes it hard to measure what delivery really costs the system.
For consultants and investors
Delivery markups reveal pricing power, channel strategy and margin pressure. A brand that keeps a low markup while growing delivery sales may be gaining share at a cost.
Markets
The illustrative sample covers six metro areas: New York City, Los Angeles, Chicago, Houston, Atlanta and Charlotte.
Restaurants
Restaurants were selected in four cuisine groups and two ownership types:
| Cuisine group | Example dishes in the matched basket |
|---|---|
| Burgers and American | Cheeseburger, fries, chicken sandwich, milkshake |
| Pizza and Italian | Large cheese pizza, pepperoni pizza, garlic knots, pasta |
| Mexican | Burrito, tacos (3), chips and salsa, quesadilla |
| Café and bakery | Latte, avocado toast, smoothie, breakfast sandwich |
| Ownership type | Description |
|---|---|
| National or regional chain | 25 or more locations |
| Independent | Single site or small local group |
Price sources
Item matching
Each delivery-app item was matched to the same item on the first-party menu by name, size and description. Only exact matches were kept. Combos and bundles were excluded unless the components were identical.
Markup calculation
For each matched item:
Markup % = (delivery-app item price − in-store item price) ÷ in-store item price × 100
Markups were calculated before delivery fees, service fees, taxes and tips, so they reflect the menu price difference alone.
Collection
Food delivery markup data scraping collected menus in two weekly waves (weekday lunch and weekend evening), because some restaurants adjust availability by daypart. Each observation recorded platform, restaurant, address, item, size, price and collection date.
| Measure | Value |
|---|---|
| Matched items analysed | 41,800 |
| Restaurants with at least 5 matched items | 2,140 |
| Median item markup | 18% |
| Middle 50% of markups | 10% to 25% |
| Restaurants with no markup on any platform | 21% |
Most restaurants charge more on delivery apps than in-store, but there is a meaningful group that does not. Those restaurants either absorb the commission, rely on customer fees charged by the platform, or are on a plan where the economics work without a markup.
| Cuisine group | Median markup | Share of restaurants with markup above 25% |
|---|---|---|
| Burgers and American | 15% | 14% |
| Pizza and Italian | 14% | 11% |
| Mexican | 19% | 22% |
| Café and bakery | 24% | 37% |
Cafés and bakeries show the highest markups. Their average order values are low, so a fixed or percentage commission takes a larger share of each order, and operators raise app prices to compensate.
| Ownership type | Median markup | Price consistency across platforms |
|---|---|---|
| National or regional chain | 12% | High: most items priced the same on all apps |
| Independent | 21% | Lower: prices often differ by platform |
Chains usually set delivery pricing centrally and can negotiate platform terms, which keeps markups lower and more consistent. Independents set prices individually, often once at onboarding, and rarely revisit them.
| Metro | Median markup | Highest-markup cuisine |
|---|---|---|
| New York City | 20% | Café and bakery |
| Los Angeles | 19% | Café and bakery |
| Chicago | 17% | Mexican |
| Houston | 16% | Café and bakery |
| Atlanta | 17% | Mexican |
| Charlotte | 18% | Café and bakery |
Coastal metros show slightly higher markups, likely reflecting higher operating costs and higher delivery demand.
| Comparison | Share of restaurants with different prices for the same item |
|---|---|
| DoorDash vs Uber Eats | 34% |
| DoorDash vs Grubhub | 41% |
| Uber Eats vs Grubhub | 38% |
Where prices differ between apps, the gap is usually 3 to 6 percentage points. Operators often set prices once per platform and then forget them, so differences reflect history more than strategy.
| In-store item price band | Median markup |
|---|---|
| Under $5 | 27% |
| $5 to $10 | 19% |
| $10 to $20 | 15% |
| Over $20 | 11% |
Low-price items such as coffee, sides and drinks carry the highest percentage markups. Main dishes over $20 show the lowest.
For a typical two-person delivery order of about $35 in-store value, an 18% menu markup adds roughly $6 before fees. Combined with delivery and service fees, the customer may pay 30% to 50% more than the in-store total. This is one reason first-party ordering and pickup promotions have grown.
Using the same method, a single café can estimate its own delivery cost and compare it with local peers:
| Step | Example value (illustrative) |
|---|---|
| Monthly delivery-app sales | $18,000 |
| Commission rate on current plan | 25% |
| Monthly commission paid | $4,500 |
| Café's current app markup | 10% |
| Revenue recovered by markup | about $1,640 |
| Net delivery cost after markup | about $2,860 |
| Local peer median markup (from data) | 24% |
| Recovered revenue at peer median markup | about $3,480 |
All values illustrative. The calculation helps an operator see whether its markup is in line with local competitors and what a change might recover, before testing the effect on order volume.
The record below shows the structure of one matched observation.
{
  "metro": "Charlotte",
  "restaurant_name": "Example Cafe South End",
  "ownership_type": "independent",
  "cuisine_group": "cafe_bakery",
  "item_name": "Avocado Toast",
  "item_size": "Regular",
  "instore_price_usd": 9.50,
  "instore_price_source": "first_party_online_menu",
  "platform_prices_usd": {
    "doordash": 11.99,
    "ubereats": 11.49,
    "grubhub": 11.99
  },
  "markup_pct": {
    "doordash": 26.2,
    "ubereats": 20.9,
    "grubhub": 26.2
  },
  "collection_date": "2026-10-04",
  "daypart": "weekday_lunch"
}
Based on the patterns in the data, operators can take five practical steps:
A single snapshot shows where markups stand today. Monthly food delivery markup data scraping shows how they move. In the illustrative tracking window, the median markup in the sample rose by about one percentage point over six months, with the largest increases among independent cafés. Chains held steady. Tracking these trends helps operators see whether competitors are raising app prices, which can create room to adjust their own prices without losing share.
| Month (illustrative) | Median markup, chains | Median markup, independents |
|---|---|---|
| April | 12% | 20% |
| June | 12% | 20% |
| August | 12% | 21% |
| October | 12% | 21% |
| Field | Description |
|---|---|
| Restaurant, address, metro | Restaurant identity and location |
| Ownership type and cuisine group | For segmentation |
| Item, size, description | As listed on each channel |
| In-store price and source | First-party menu or online ordering price |
| Platform prices | DoorDash, Uber Eats, Grubhub (and others on request) |
| Markup per platform | Calculated percentage |
| Promotions | Active platform or restaurant offers |
| Collection date and daypart | Time context |
Delivery apps are now a core sales channel for US restaurants, and menu markups are the main tool operators use to manage their cost. The data shows that markups are common but inconsistent: they vary by cuisine, ownership type, city, item price and even platform. Food delivery markup data scraping replaces guesswork with a clear view of what similar restaurants charge, so operators can price deliberately.
Food Data Scrape builds custom delivery markup benchmarks for restaurants, franchise groups and consultants across US metros. Share your location, cuisine and competitor set, and we will deliver a sample markup report for your area.
Questions
Yes. Provide a list of restaurants or a radius around your outlets, and the comparison is built for that set.
DoorDash, Uber Eats and Grubhub by default, with other regional platforms added on request.
Monthly is enough for most operators. Franchise groups monitoring compliance often track weekly.
We provide the market data and the method. Your own commission rate and sales figures complete the calculation.



