

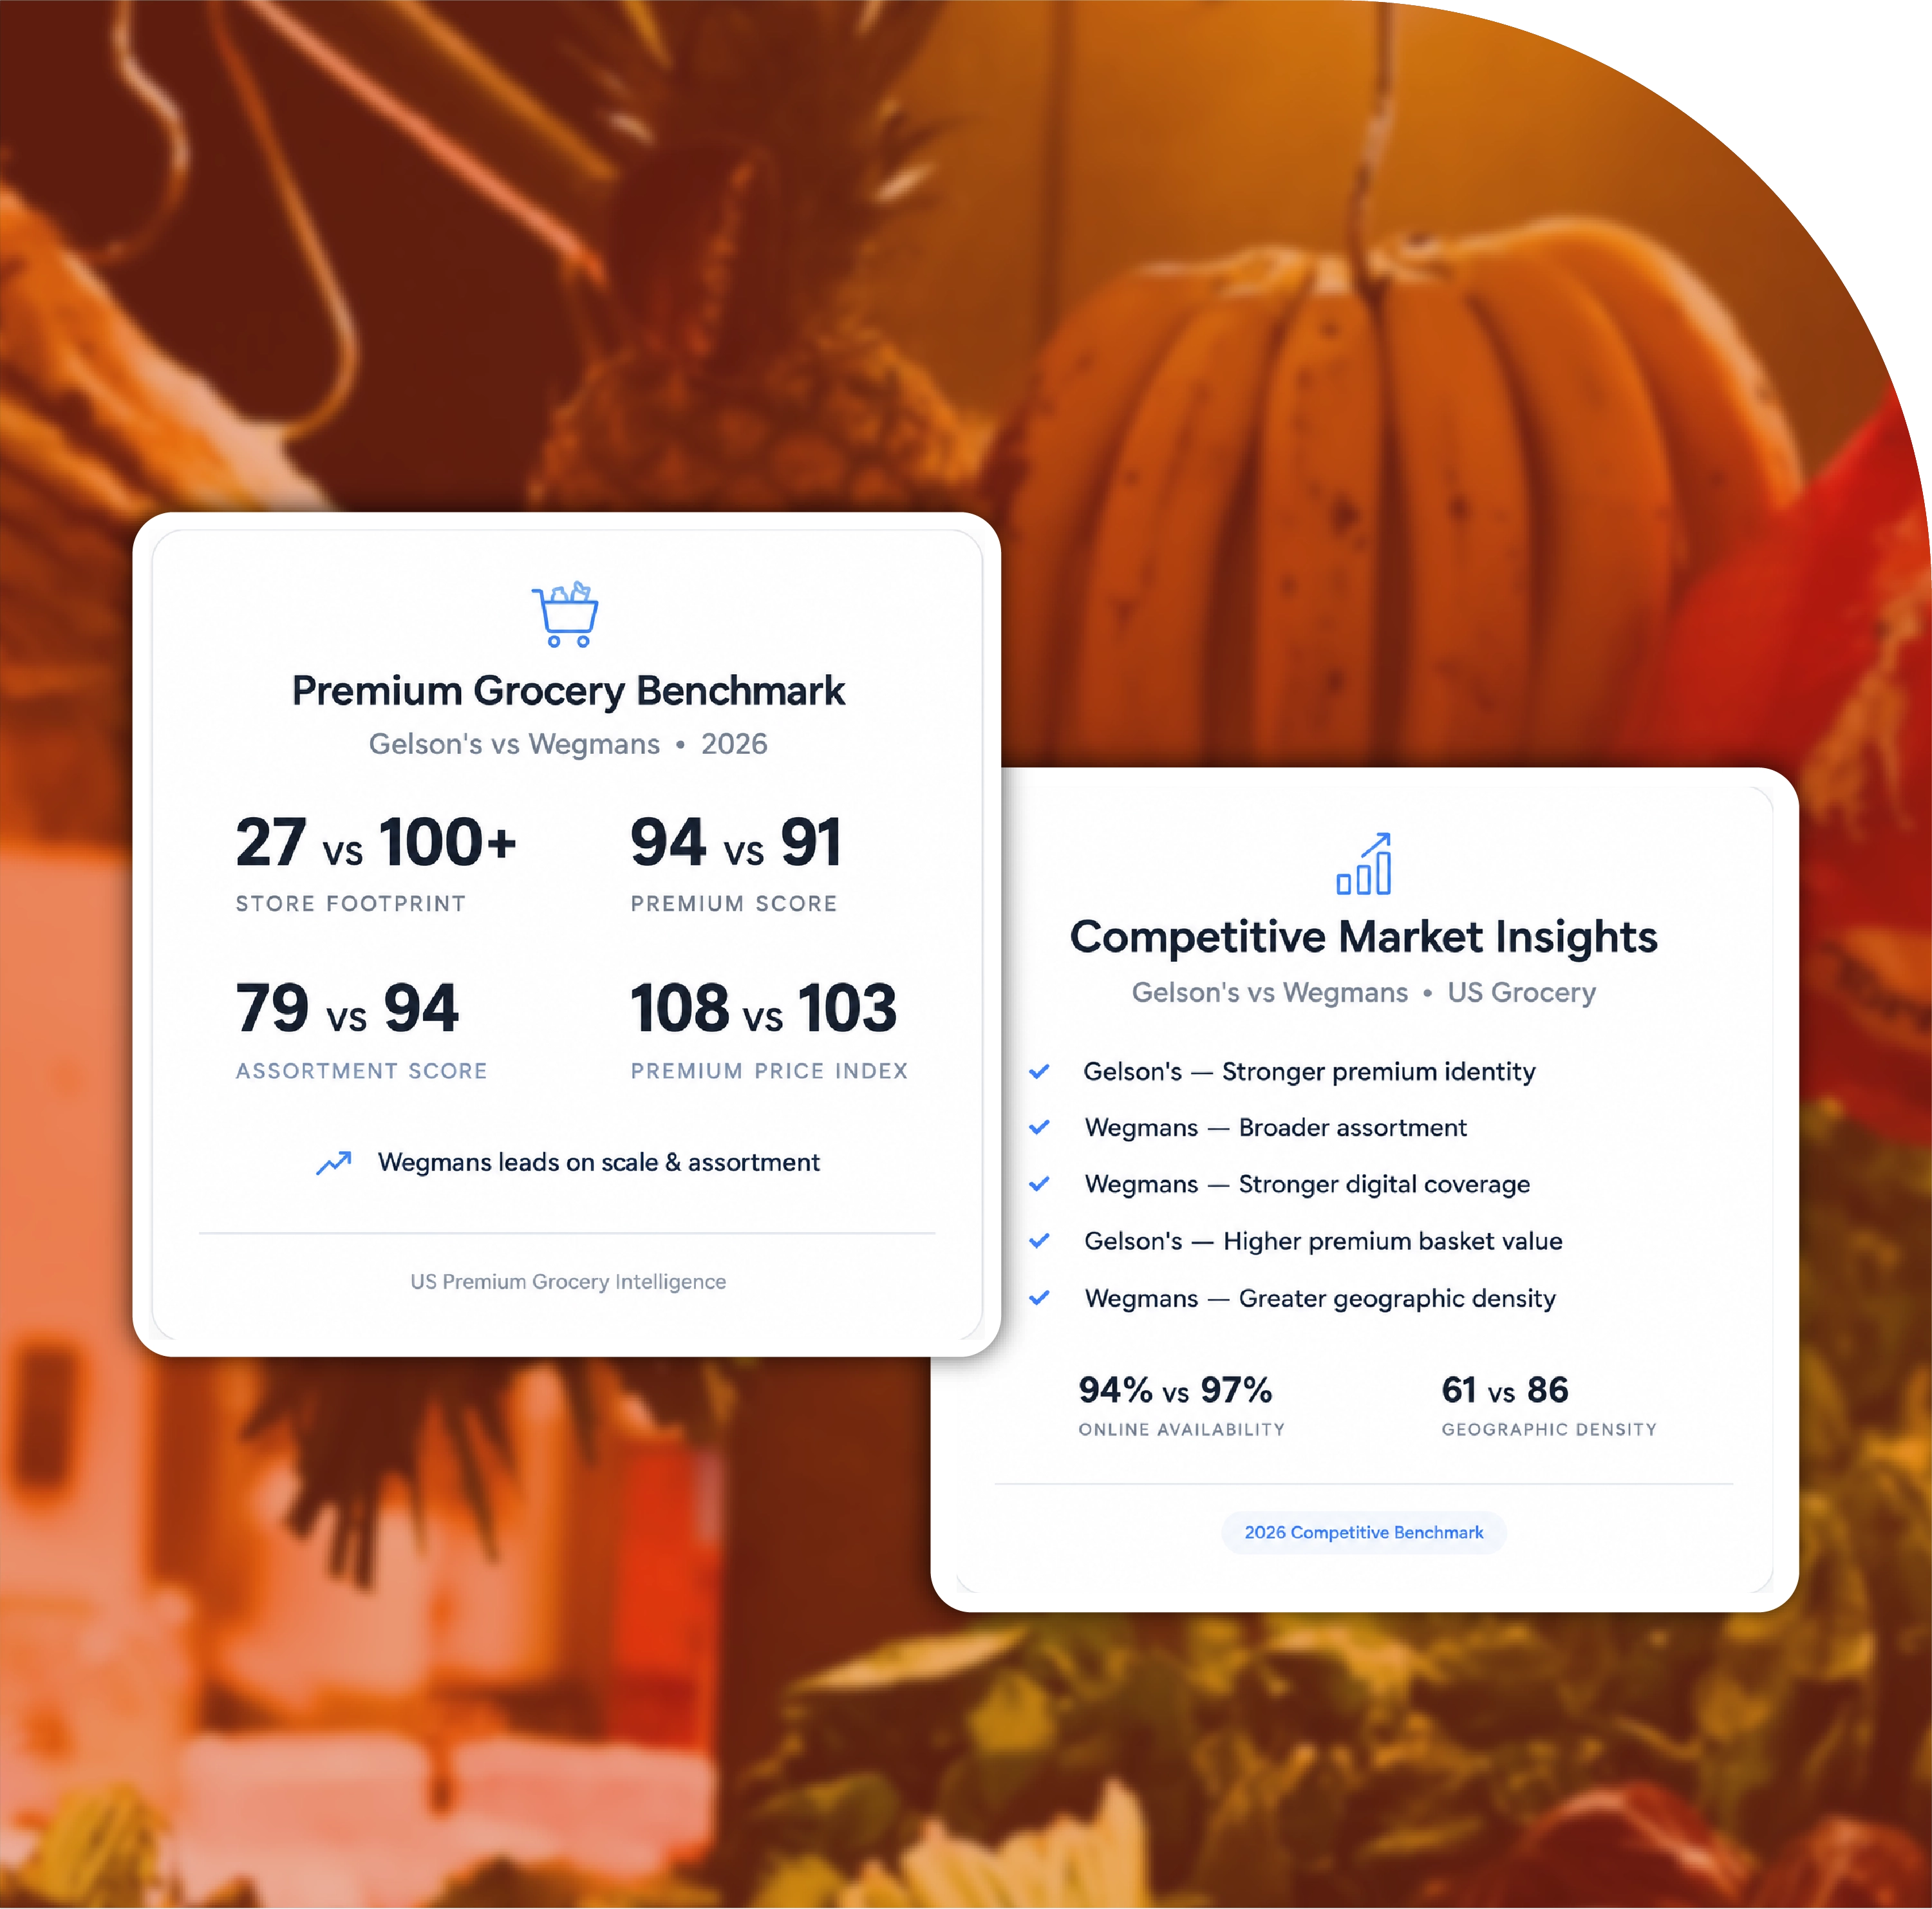
Premium Positioning:Gelson's demonstrates a stronger concentrated premium identity, while Wegmans combines premium positioning with greater operational and geographic scale.
Assortment Advantage:Wegmans leads in modeled assortment breadth, private-label coverage, online selection, and comparable SKU availability.
Price Intelligence:The modeled premium price index is higher for Gelson's, highlighting opportunities to evaluate premium pricing against basket value and promotions.
Digital Competition:Wegmans shows stronger modeled online availability and delivery coverage, emphasizing the growing importance of digital grocery convenience.
Market Opportunities:Historical pricing, assortment, density, and availability data can uncover underserved markets, recurring stockouts, category gaps, and expansion opportunities.

The U.S. premium grocery market is becoming increasingly data-driven as consumers balance food quality, convenience, specialty assortment, and price. Premium supermarkets are no longer competing simply through attractive stores and high-quality products. They are competing through pricing, promotions, private labels, online availability, delivery performance, assortment depth, geographic coverage, and customer experience. This makes Gelson's vs. Wegmans: Premium US Grocery Data Intelligence a valuable framework for understanding two distinctly positioned premium grocery businesses.
The growing importance of premium grocery data intelligence US reflects a wider shift toward continuous retail monitoring. A single price snapshot can show what a product costs today, but repeated observations can reveal inflation, promotional cycles, assortment changes, stockouts, and differences between physical and digital grocery channels.
A structured Gelson's vs Wegmans grocery prices dataset US can therefore combine product name, brand, category, package size, regular price, promotional price, unit price, availability, store location, online availability, delivery fee, delivery window, and timestamp. This enables researchers to compare retailers at SKU, category, store, ZIP-code, and market levels.
Gelson's has a concentrated premium presence in Southern California, while Wegmans has a much larger multi-state footprint. Gelson's emphasizes specialty foods, fresh departments, prepared foods, bakery, seafood, sushi, and premium shopping experiences. Wegmans combines premium positioning with extensive assortment, private-label products, prepared foods, digital ordering, pickup, and grocery delivery.
The comparison becomes significantly more useful when three dimensions are added: change over time, market gaps, and density. These dimensions reveal not only who has the higher price, but where competitive advantages are developing and how quickly they are changing.
The research model is designed around recurring collection of online and location-level grocery information. Products should be matched using normalized product names, brands, sizes, UPC or GTIN identifiers where available, and category classifications.
Prices should be converted into comparable unit prices because package sizes differ. A 16-ounce product priced at $7.99 cannot be directly compared with a 24-ounce competitor priced at $9.99 without normalization.
The dataset should also preserve historical timestamps. This makes it possible to calculate weekly, monthly, and quarterly price movements rather than relying on isolated observations.
The analysis can be organized around five intelligence layers:
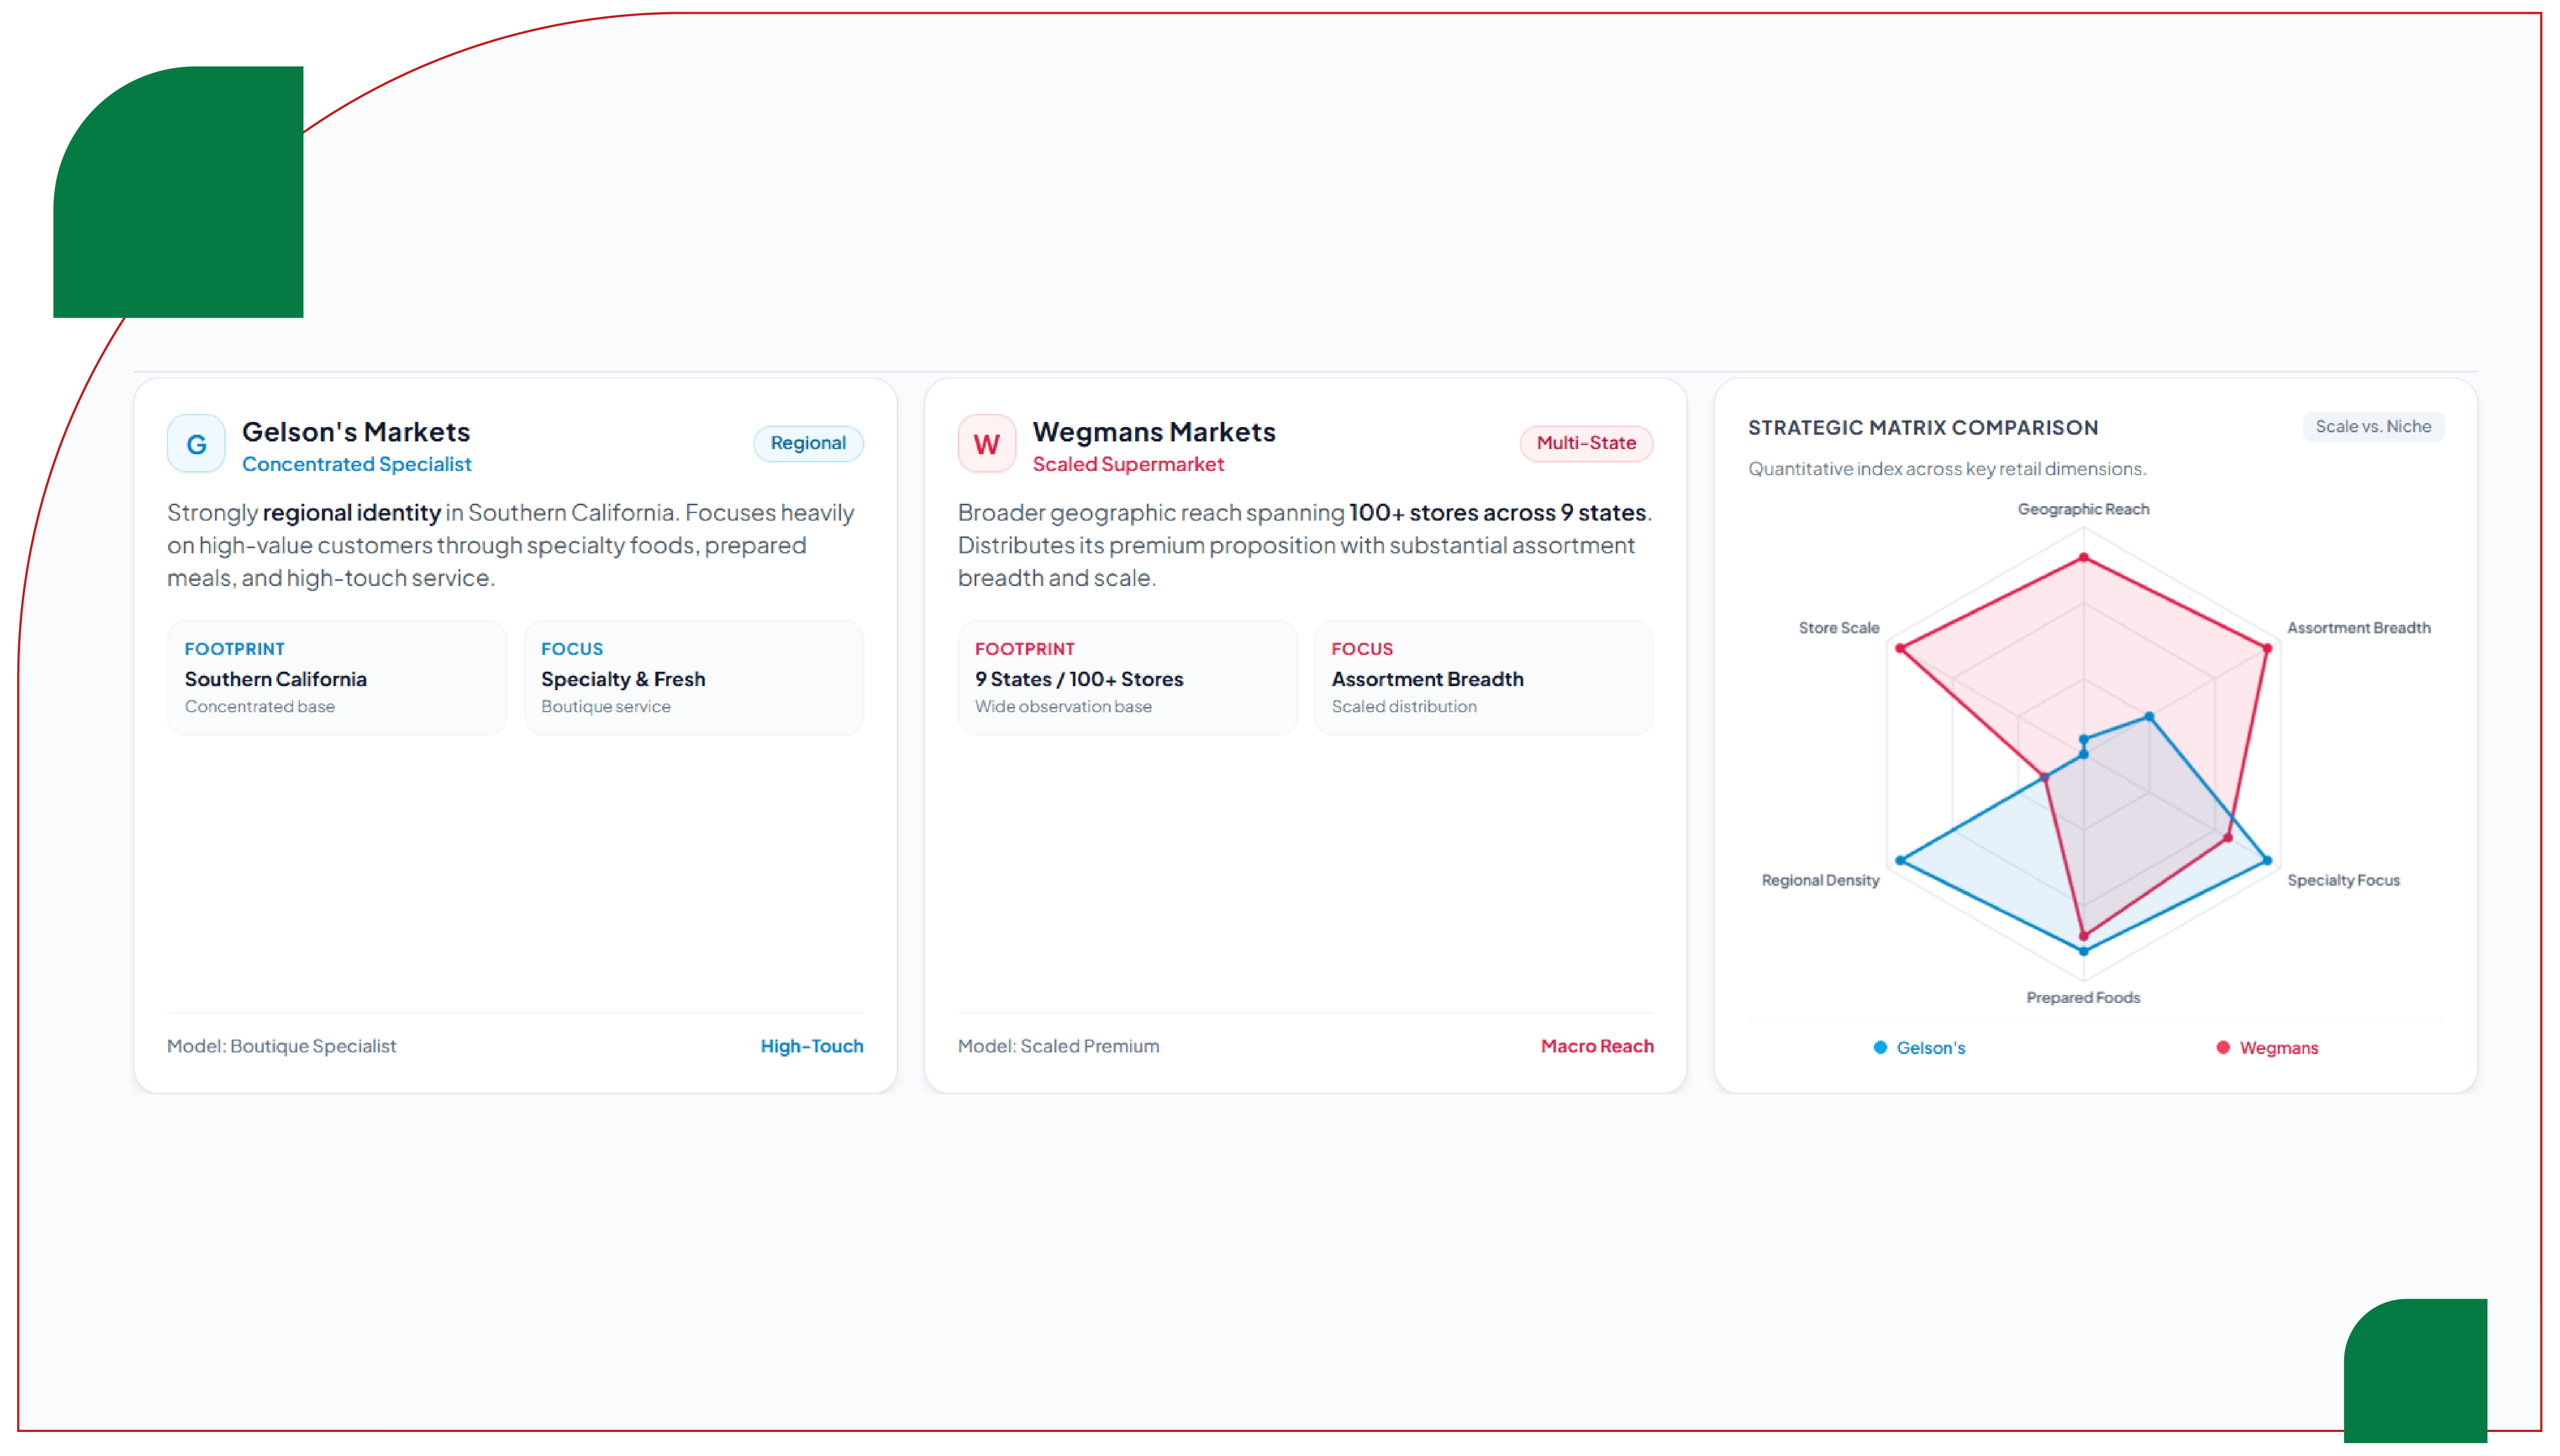
Gelson's vs Wegmans premium grocery analysis US highlights two different approaches to premium retail.
Gelson's competitive identity is strongly regional. Its concentration in Southern California allows the retailer to focus on premium consumers and high-value categories. Its differentiation is particularly visible in specialty foods, prepared meals, fresh departments, and service-oriented shopping experiences.
Wegmans has a broader geographic strategy. Its official store network spans more than 100 locations across nine states, creating a significantly larger geographical observation base. This scale enables the retailer to distribute its premium proposition across multiple markets while maintaining substantial assortment breadth.
The difference is important for competitive research. Gelson's can be analyzed as a concentrated premium specialist, while Wegmans can be evaluated as a scaled premium supermarket with extensive regional reach.
The following table is an illustrative 2026 analytical benchmark showing how a grocery intelligence dataset could compare the two retailers. It is not a direct representation of retailer sales or proprietary transaction data.
| Intelligence Metric | Gelson's | Wegmans | Gap | Competitive Signal |
|---|---|---|---|---|
| Store footprint benchmark | 27 | 100+ | 73+ | Wegmans leads on scale |
| Premium positioning score | 94/100 | 91/100 | +3 | Gelson's stronger premium identity |
| Assortment breadth score | 79/100 | 94/100 | -15 | Wegmans leads |
| Specialty-food depth | 92/100 | 89/100 | +3 | Gelson's advantage |
| Prepared-food depth | 95/100 | 94/100 | +1 | Near parity |
| Fresh-food score | 94/100 | 93/100 | +1 | Near parity |
| Private-label breadth | 76/100 | 92/100 | -16 | Wegmans advantage |
| Organic/natural assortment | 90/100 | 88/100 | +2 | Gelson's slight advantage |
| Online assortment | 81/100 | 91/100 | -10 | Wegmans advantage |
| Premium price index | 108 | 103 | +5 | Gelson's modeled premium |
| Promotion intensity | 32% | 39% | -7 pp | Wegmans more promotion-led |
| Premium basket benchmark | $119 | $105 | $14 | Gelson's higher basket value |
| Comparable SKU match rate | 82% | 88% | -6 pp | Wegmans broader comparable range |
| Online availability | 91% | 96% | -5 pp | Wegmans advantage |
| Delivery coverage index | 76/100 | 89/100 | -13 | Wegmans advantage |
| Customer experience score | 97/100 | 92/100 | +5 | Gelson's advantage |
| Geographic density score | 61/100 | 86/100 | -25 | Wegmans leads |
The benchmark suggests that premium competition cannot be reduced to price alone. Gelson's may command a higher premium-price index while simultaneously achieving stronger scores in specialty foods, prepared foods, and experiential retail.
Wegmans, meanwhile, gains advantages from assortment breadth, private labels, digital coverage, and geographic scale.
Gelson's vs Wegmans grocery market intelligence US becomes more valuable when the same products are monitored repeatedly.
Consider a premium coffee product priced at $12.99 in January and $13.99 in June. A static dataset identifies only the current price. A longitudinal dataset identifies a 7.7% increase and can determine whether the competitor experienced the same movement.
This approach can uncover retailer-specific pricing behavior, including synchronized price increases, delayed increases, promotional offsets, and category-specific inflation.
Change over time is one of the strongest differentiators between basic grocery scraping and genuine market intelligence. Historical observations can show whether a retailer is becoming more expensive, more promotional, more digitally available, or more assortment-heavy.
The following model demonstrates a six-quarter monitoring framework.
| Indicator | Q1 2025 | Q2 2025 | Q3 2025 | Q4 2025 | Q1 2026 | Q2 2026 | Total Change |
|---|---|---|---|---|---|---|---|
| Gelson's price index | 100.0 | 101.7 | 103.2 | 104.8 | 106.4 | 107.8 | +7.8% |
| Wegmans price index | 100.0 | 101.1 | 102.4 | 103.6 | 104.4 | 105.5 | +5.5% |
| Gelson's premium gap | 4.0% | 4.6% | 5.0% | 5.4% | 5.9% | 6.2% | +2.2 pp |
| Gelson's promotion rate | 27% | 28% | 29% | 30% | 32% | 33% | +6 pp |
| Wegmans promotion rate | 33% | 35% | 36% | 37% | 39% | 40% | +7 pp |
| Gelson's assortment index | 100 | 101 | 102 | 103 | 104 | 105 | +5% |
| Wegmans assortment index | 100 | 102 | 104 | 106 | 108 | 110 | +10% |
| Gelson's online availability | 87% | 89% | 90% | 92% | 93% | 94% | +7 pp |
| Wegmans online availability | 90% | 92% | 94% | 95% | 96% | 97% | +7 pp |
| Gelson's delivery index | 71 | 73 | 75 | 77 | 79 | 81 | +10 |
| Wegmans delivery index | 82 | 84 | 86 | 88 | 90 | 92 | +10 |
| Private-label penetration | 14% | 15% | 16% | 17% | 18% | 19% | +5 pp |
The modeled trend shows why historical data matters. Both retailers can increase prices while simultaneously improving promotions and availability. Therefore, a retailer's competitive position may improve even during an inflationary period.
Gelson's vs Wegmans grocery benchmarking US should identify areas where the competitive proposition is incomplete.
Gelson's potential market gap is geographic scalability. Its concentrated footprint provides strong regional identity but fewer direct market observations than a larger national or multi-state network.
Wegmans' potential gap is regional reach beyond its established markets. Its premium supermarket model is highly developed in its core geography, but other U.S. regions can have different consumer preferences, competitive structures, and premium grocery economics.
Category-level gaps can also be identified. If one retailer has 500 premium snack SKUs while another has 300, the difference becomes an assortment opportunity. Similarly, recurring stockouts in premium seafood, organic produce, or prepared meals can reveal operational gaps.
Density is another important competitive dimension. Store count should be normalized against population, geographic area, household income, competitor concentration, and delivery coverage.
A market with three premium supermarkets within a five-mile radius has a very different competitive environment from a market with one premium supermarket serving a much larger population.
A density model can calculate stores per million residents, stores per 1,000 square miles, premium SKUs per ZIP code, delivery availability by ZIP code, and competitor distance.
This approach can identify underserved premium markets and help businesses prioritize expansion opportunities.
Premium supermarket price comparison US should focus on comparable baskets instead of individual products.
A standardized 50-SKU basket can include premium dairy, organic produce, specialty cheese, seafood, coffee, bakery items, prepared meals, natural snacks, beverages, pantry products, and household essentials. The basket can then be tracked weekly.
Researchers can calculate price gaps, promotion-adjusted basket costs, private-label substitution opportunities, and category-level inflation.
This creates a more realistic measure of consumer value than simply comparing headline prices.
Online grocery adds another competitive layer. Digital data can capture online prices, product availability, substitutions, delivery fees, estimated delivery windows, pickup slots, and ZIP-code coverage.
A structured Wegman's Grocery Delivery Dataset can record delivery observations by store and ZIP code, allowing researchers to identify geographic differences and changes in digital service availability.
An automated Wegmans Grocery Delivery Scraping API-based pipeline can transform recurring online grocery observations into structured records suitable for dashboards, alerts, price histories, and competitive benchmarking.
The comparison between Gelson's and Wegmans demonstrates why modern grocery intelligence needs to move beyond basic price scraping. Premium retail performance depends on the interaction of pricing, assortment, promotions, digital availability, store density, and geographic positioning.
Scrape Online Wegmans Grocery Delivery App Data to provide recurring digital observations covering products, prices, availability, delivery conditions, and market-level differences.
Food Data Scraping in the USA can further extend the research model across premium supermarkets, regional grocery chains, specialty stores, and emerging retail formats.
Grocery Supermarket Data Scraping can ultimately create a longitudinal intelligence platform that identifies not only what retailers charge, but how their strategies evolve.
The strongest competitive insight comes from combining three dimensions: what changes over time, where market gaps exist, and how densely each retailer serves consumers. Gelson's demonstrates the power of concentrated premium specialization, while Wegmans demonstrates how premium positioning can be combined with assortment scale, digital convenience, and geographic reach. Together, they provide a valuable benchmark for understanding the evolving economics of premium grocery retail in the United States.
Need reliable and high-quality scraping services to transform complex grocery data into actionable business insights? Food Data Scrape provides advanced data collection and analysis solutions designed to help businesses make faster, smarter decisions. Our expertise combines accurate data collection with AI Grocery Intelligence and Hyperlocal Intelligence, enabling companies to understand market movements, customer preferences, pricing patterns, and local demand more effectively. Choose Food Data Scrape to unlock valuable insights from grocery data and turn information into measurable business opportunities. Contact us today to explore a solution tailored to your requirements.



