
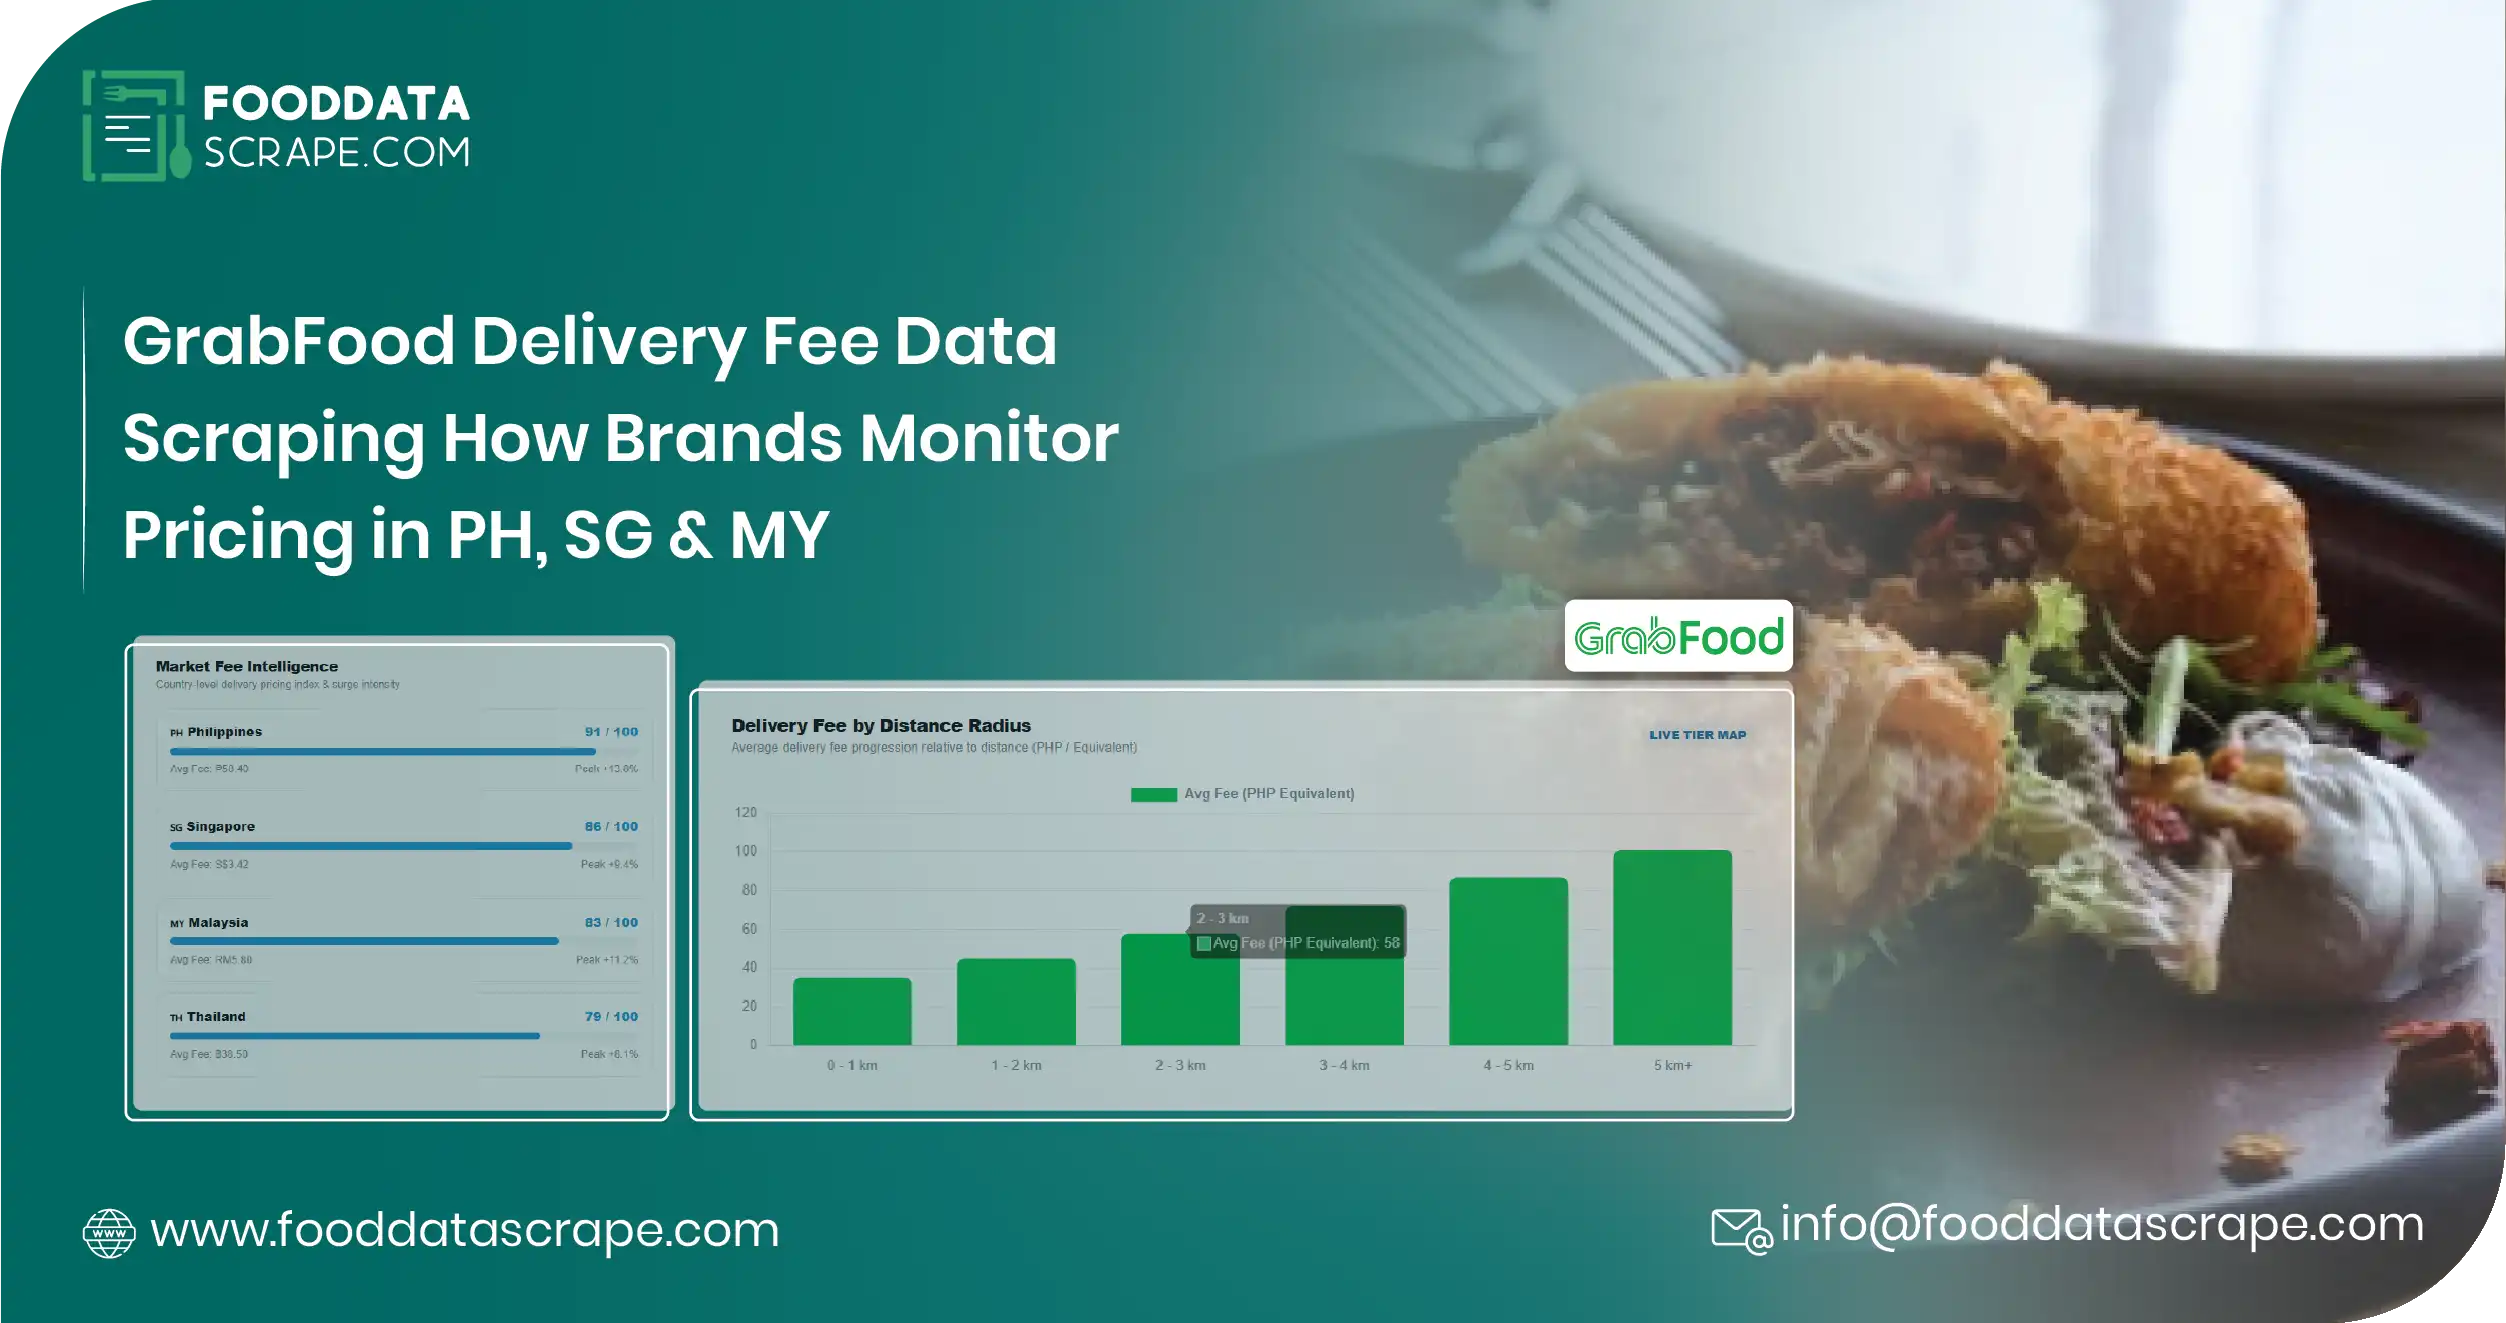
Introduction — Why GrabFood Delivery Fee Intelligence Matters Across APAC in 2026
Grab operates as the dominant food delivery aggregator across Southeast Asia — with GrabFood serving as the primary consumer-facing brand across Philippines, Singapore, Malaysia, Thailand, Indonesia, and Vietnam. For quick-service restaurant chains selling into GrabFood, for cloud kitchens optimizing their delivery economics, for FMCG brands tracking their category presence on delivery platforms, and for delivery aggregators benchmarking their own commission structure against Grab, continuous visibility into delivery fees, restaurant-facing commissions, promotional overlays, and consumer-facing pricing has moved from a competitive edge to an operational baseline.
This is exactly the problem that a modern GrabFood Delivery Fee Data Scraping capability solves. When APAC food delivery operators, QSR chains, and FMCG brands deploy purpose-built Southeast Asia food delivery data pipelines, they gain daily-refreshed visibility across GrabFood Philippines data scraping, Singapore price monitoring, and GrabFood Malaysia data services — turning delivery-economics decisions from quarterly guesswork into daily precision.
This guide breaks down how leading APAC food delivery operators, QSR chains, and FMCG brands build GrabFood pricing data extraction capability in 2026, with real sample data structures, use cases, and the specific pipeline architecture that powers APAC food delivery intelligence at scale. Examples reference Bangkok, Manila, Singapore, and Kuala Lumpur as representative advanced APAC metros.
The 2026 APAC Food Delivery Landscape — What Changed
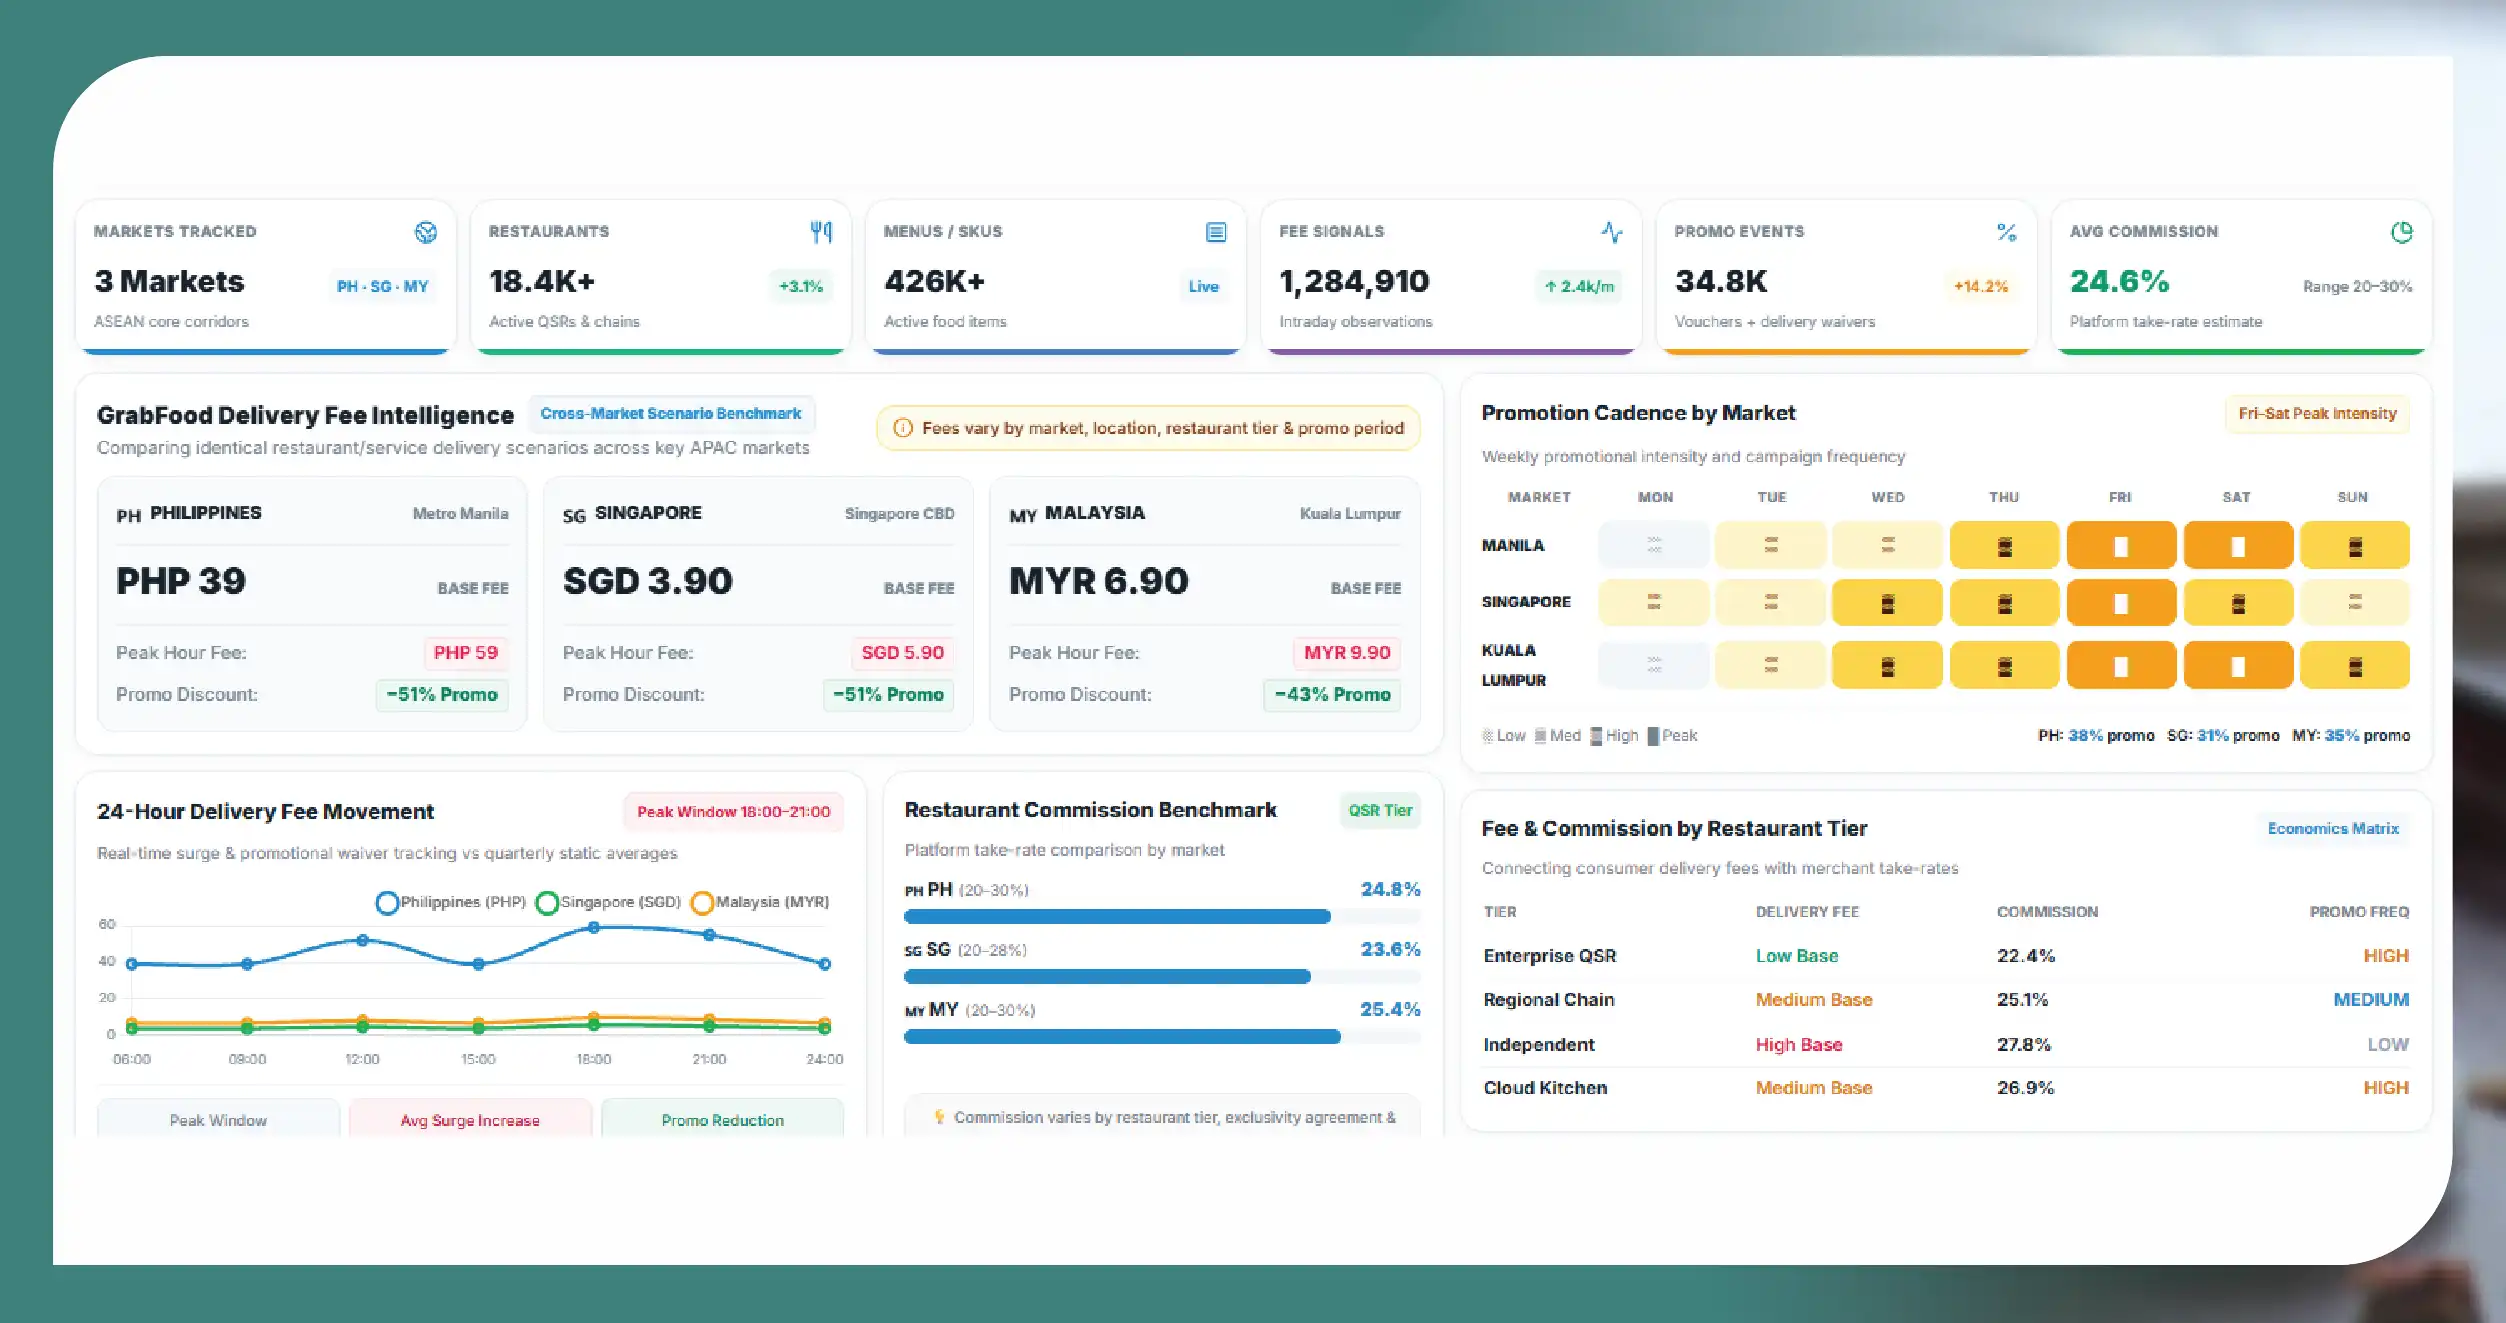
Three structural shifts have made continuous GrabFood delivery-fee intelligence essential in 2026, and each one increases the value of a properly designed GrabFood restaurant menu scraping pipeline.
1. Delivery fees have become a competitive lever. Consumer-facing delivery fees on GrabFood vary meaningfully by city, restaurant tier, promotional period, and membership status (GrabUnlimited). The same restaurant might charge PHP 39 delivery in Metro Manila and SGD 3.90 in Singapore CBD on the same day — with promotional overlays halving these fees during peak marketing windows. APAC food delivery competitor tracking must capture these fee dynamics continuously, not quarterly.
2. Restaurant-facing commission structures have professionalized. GrabFood restaurant commission rates in Philippines, Singapore, and Malaysia have converged toward 20-30% ranges but vary significantly by restaurant tier, exclusivity agreement, and category. GrabFood commission data intelligence is essential for QSR chains negotiating national contracts and cloud kitchens optimizing platform mix.
3. Cross-country pricing arbitrage has become measurable. Grab operates a unified backend across SEA markets, with Singapore food aggregator data pipeline requirements varying meaningfully by country, but consumer pricing and promotional strategies vary by country — the same branded meal from a regional QSR chain might sit at PHP 179 in Manila, SGD 9.80 in Singapore, and MYR 24.90 in Kuala Lumpur, with promotional cadences that are country-specific. SEA quick commerce data services capturing all three markets simultaneously reveals arbitrage patterns single-country tracking misses.
The APAC food delivery operators winning in 2026 are those with the fastest, cleanest cross-country visibility into how GrabFood pricing actually plays out across every Southeast Asian metro their business touches.
What GrabFood Delivery Fee Data Delivers
A modern GrabFood pricing data extraction pipeline is a data infrastructure that continuously scrapes restaurant listings, menu pricing, delivery fees, promotional overlays, and commission signals from GrabFood across all major SEA markets — delivering structured, decision-ready output to the operator's pricing, sales, or category team.
A well-designed Philippines food delivery API pipeline captures:
- Consumer-facing delivery fees per restaurant per neighborhood per city
- Per-item menu pricing across every listed restaurant
- Restaurant commission tier indicators (where publicly signaled)
- Promotional overlays (GrabUnlimited pricing, seasonal offers, brand deals)
- Restaurant availability, delivery time, and rating signals
- Category and cuisine tagging aligned to GrabFood merchandising
- Neighborhood-level, city-level, and country-level attribution
- Daily or 12-hour refresh cadence based on category volatility
- Historical time-series for cross-country pattern analysis
The output plugs directly into the operator's pricing dashboard, sales team's contract negotiation workflow, or category manager's competitive review — replacing manual competitor audits with continuous multi-country intelligence.
Sample Data — Real APAC GrabFood Snapshot
Below is a sample of the structured output a properly designed GrabFood Singapore price monitoring pipeline produces for a regional QSR chain monitoring 6 SKUs across three major GrabFood markets on the same day.
Sample 1 — Cross-Country GrabFood Pricing Snapshot
| Item | Manila (PHP) | Delivery Fee | Singapore (SGD) | Delivery Fee | KL (MYR) | Delivery Fee |
|---|---|---|---|---|---|---|
| Signature Burger Meal | 179 | 39 | 9.80 | 3.90 | 24.90 | 5.00 |
| Chicken Bucket (6pc) | 549 | 39 | 24.90 | 3.90 | 62.90 | 5.00 |
| Family Combo Set | 899 | 49 | 42.90 | 4.90 | 118.90 | 6.00 |
| Value Meal | 149 | 39 | 7.80 | 3.90 | 19.90 | 5.00 |
| Kids Meal | 129 | 39 | 6.50 | 3.90 | 16.90 | 5.00 |
| Beverage Regular | 65 | 39 | 3.20 | 3.90 | 7.90 | 5.00 |
The sample reveals immediate signals for the regional pricing team: the same Family Combo Set sits at effectively USD 15.90 in Manila (including delivery), USD 32.10 in Singapore, and USD 26.60 in KL — a 100% spread across three markets that reflects each country's competitive intensity, consumer purchasing power, and GrabFood's country-specific pricing strategy. Delivery fees are country-anchored (PHP 39/49, SGD 3.90/4.90, MYR 5.00/6.00) but scale with order value, revealing an escalator model consistent across markets.
Sample 2 — 4-Week GrabFood Promotional Cadence Panel
| Metric | Wk 1 | Wk 2 | Wk 3 | Wk 4 | Pattern |
|---|---|---|---|---|---|
| Manila avg delivery fee (PHP) | 39 | 29 (promo) | 39 | 29 (promo) | Bi-weekly discount |
| Manila brand deals active | 12 | 18 | 12 | 20 | Alternating waves |
| Singapore avg delivery fee (SGD) | 3.90 | 3.90 | 2.90 (GrabUnlimited push) | 3.90 | Monthly member push |
| Singapore brand deals active | 8 | 8 | 14 | 10 | Member-push aligned |
| KL avg delivery fee (MYR) | 5.00 | 3.00 (promo) | 5.00 | 3.00 (promo) | Bi-weekly discount |
| KL brand deals active | 10 | 15 | 10 | 18 | Alternating waves |
Four weeks of data reveals distinct country-specific patterns: Philippines and Malaysia run coordinated bi-weekly delivery-fee promotions (identical alternation rhythm); Singapore runs a monthly membership-push aligned with brand deal spikes. A regional QSR chain reading this snapshot can align their own brand-deal participation to each country's cadence rather than assuming APAC operates as one coordinated market.
The Bangkok/Manila/Singapore Case — Regional QSR Intelligence
The APAC regional QSR pattern — a Japan-headquartered or regional restaurant chain monitoring 10-30 SKUs across GrabFood Philippines, Singapore, Malaysia, plus Grab Thailand food data extraction — is one of the most common entry points into SEA food delivery intelligence deployment.
The APAC food delivery market combines the two-sided complexity of consumer-pricing dynamics driven by promotional cycles and platform strategy, plus restaurant-facing commission and marketing-cost dynamics driven by aggregator commercial pressure. A QSR chain tracking their category across this landscape needs both dimensions visible daily — consumer-price movement AND platform-cost movement — to protect margin and defend share.
The APAC GrabFood patterns visible across Manila, Singapore, and KL — country-specific delivery-fee cadences, membership-driven pricing, brand-deal alternation — appear in similar forms across Bangkok (Grab Thailand), Ho Chi Minh (Grab Vietnam), Jakarta (Grab Indonesia), and every SEA metro with local variations informing regional operators' decisions.
How the GrabFood Data Pipeline Architecture Works
FoodDataScrape builds APAC food delivery pipelines on a five-layer architecture designed for SEA's specific data challenges — pipelines built for grabfood delivery fee data philippines singapore malaysia requirements at production scale.
Layer 1: Country and City Scope Mapping. For each engagement, the team defines the exact set of countries (Philippines, Singapore, Malaysia, Thailand, Indonesia, Vietnam), cities, and neighborhoods to monitor. A typical regional QSR engagement covers 5-8 metros across 3-4 countries.
Layer 2: Restaurant and Menu Matching. The same regional QSR brand appears with country-localized menu naming and pricing conventions across markets. An AI matching layer pairs equivalent SKUs across GrabFood Philippines, Singapore, Malaysia, and Thailand for like-for-like cross-country comparison.
Layer 3: Continuous Daily Multi-Country Scraping. Per-country extractors pull menu pricing, delivery fees, promotional overlays, availability, and restaurant metadata daily across every mapped restaurant and SKU. Data is normalized into consistent schema and local-currency-standardized.
Layer 4: Cross-Country Analytics Layer. Raw pricing data is transformed into decision-ready outputs — cross-country price-spread calculations, country-specific promotional cadence detection, delivery-fee trend analysis, effective-price-including-delivery metrics. This is where raw Malaysia food delivery pricing data becomes true APAC category intelligence.
Layer 5: Delivery and Integration. The pipeline delivers via REST API, CSV export, S3 delivery, or direct BI stack integration. Regional operators typically integrate the feed into their APAC commercial dashboard.
The build timeline from kickoff to production delivery is typically 6-8 weeks for a mid-scope engagement covering 100-500 SKUs across 3-4 SEA countries.
Why APAC Food Delivery Operators Choose Continuous Data
QSR chains, FMCG brands, and delivery aggregators operating across SEA select continuous GrabFood Delivery Fee Data Scraping pipelines over quarterly manual audits for six specific reasons.
- Multi-country coverage in one feed. SEA operators need Philippines + Singapore + Malaysia + Thailand simultaneously; a purpose-built pipeline integrates all markets.
- Local-currency normalization. Cross-country comparison requires currency conversion and purchasing-power context; purpose-built layers deliver this automatically.
- Neighborhood-level delivery fee capture. Delivery fees vary by neighborhood within each city; store-level scraping captures this granularity.
- Promotional cadence detection. Country-specific promotional rhythms only become visible with continuous multi-week tracking.
- Restaurant commission signaling. Publicly-signaled commission tier indicators inform sales-team contract negotiation.
- Dedicated APAC-analytics expertise. Every engagement includes a dedicated analyst with SEA food delivery expertise.
Key Success Metrics for APAC Food Delivery Data Pipelines
Enterprise operators evaluating a APAC food delivery data intelligence pipeline benchmark deployment success against five specific metrics that separate production-grade programs from prototype-quality feeds. Understanding these metrics before scoping an engagement prevents the common trap of celebrating a working scraper while missing the underlying business signal.
Metric 1: SKU Match Accuracy at Scale. Match accuracy on a 50-SKU proof-of-concept sample is not predictive of match accuracy on a 5,000-SKU production catalog. Best-in-class Southeast Asia category-tuned pipelines achieve 95-97% match accuracy at production scale; generic pipelines typically drop to 70-80% once catalog complexity increases. Operators should require match-accuracy testing on a representative production-scale sample before committing to a full engagement.
Metric 2: End-to-End Latency. The gap between data event (a price change on the source platform) and data availability (in the operator's dashboard) determines whether the pipeline supports operational decisions or only retrospective analysis. Production-grade programs target sub-4-hour latency for high-priority SKUs and sub-24-hour latency for the broader catalog.
Metric 3: Missing-Data Rate. Every scraping pipeline occasionally misses SKUs due to platform anti-bot measures, network issues, or category-page restructures. Production programs monitor missing-data rate per platform per city per day and alert operators when rates exceed 3%. Operators should require missing-data rate reporting as a standard deliverable.
Metric 4: Historical Data Integrity. Pattern-detection and elasticity analytics depend on complete historical time-series. Programs that drop data on infrastructure incidents undermine downstream analytical use cases. Best-in-class pipelines preserve 24+ month historical depth with data-quality flags rather than gaps.
Metric 5: Change Adaptation Speed. Source platforms change their category page structures every few months. Production pipelines adapt within 24-48 hours; brittle pipelines break for weeks. Operators should ask potential vendors about their platform-change response cadence over the past year — the answer signals engineering maturity.
Programs monitoring these five metrics as core deliverables — rather than treating them as internal engineering concerns — consistently outperform programs treating scraping as a black-box service.
Sample Use Cases — How APAC Operators Actually Use the Data
Use Case 1: Regional QSR Chain Pricing Committee. A Japan-headquartered QSR chain's APAC pricing committee reviews cross-country GrabFood positioning weekly to inform country-specific pricing decisions and regional promotional-spend allocation.
Use Case 2: Cloud Kitchen Platform Mix Optimization. A Singapore cloud kitchen operator uses GrabFood commission and delivery-fee data to optimize platform-mix decisions (GrabFood vs Foodpanda vs Deliveroo) across their brands.
Use Case 3: FMCG Brand Category Presence Tracking. An FMCG brand selling into QSR chains across SEA tracks their category presence, pricing, and promotional support across GrabFood restaurants in Philippines, Singapore, and Malaysia.
Use Case 4: Delivery Aggregator Competitive Benchmarking. A challenger delivery aggregator (Foodpanda, ShopeeFood) benchmarks their own commission structure and consumer-pricing against GrabFood across every SEA market they operate in.
Use Case 5: Investment Analyst APAC Delivery Sector Coverage. An investment analyst covering SEA food delivery uses continuous cross-country pricing data to model competitive dynamics between Grab and its regional challengers.
Getting Started — The 6-Week Roadmap
Getting an APAC GrabFood intelligence engagement live with FoodDataScrape follows a structured process.
Week 1: Scoping and proof-of-concept. The client defines SKUs, countries, cities, refresh cadence. Free PoC delivered within 5 business days.
Weeks 2-5: Production build. Country-specific extractors, cross-country matching, analytics layer, and API integration configured.
Week 6: Live production delivery. Daily multi-country GrabFood intelligence flows into commercial workflows.
Ongoing: Refinement and expansion. Additional SEA countries, cities, and SKUs are added as needs evolve.
Conclusion — Continuous APAC GrabFood Intelligence Is the 2026 Standard
The APAC food delivery market in 2026 has become too country-specific, too promotionally intensive, and too commission-dynamic for quarterly manual audits to serve as reliable pricing intelligence. Operators without continuous multi-country data are structurally disadvantaged against those that have moved to purpose-built pipelines.
The Manila/Singapore/KL 6-SKU pattern is the entry point. Most regional QSR chains and delivery aggregators expand within 6-12 months to 500-2,000 SKUs across every major SEA country.
FoodDataScrape builds the pipelines that deliver this intelligence — covering GrabFood, Foodpanda, ShopeeFood, and Deliveroo across every SEA market with daily refresh, cross-country matching, and dedicated APAC-analytics support.
If you are a regional QSR chain, an FMCG brand selling into SEA delivery, a cloud kitchen operator, or a delivery aggregator — continuous cross-country data is the fastest path to closing the visibility gap.
Ready to See Sample Data for Your SEA SKUs? Tell us your target SKUs, countries, and metros. Get a free proof-of-concept sample within 5 business days — no commitment required.
Contact FoodDataScrape today for continuous APAC food delivery intelligence that turns cross-country complexity into a commercial advantage.
Related Case Studies
- 🇸🇬 SEA Virtual Brand Launch — Cloud kitchen — 4 virtual brands launched successfully.
- 🇦🇪 UAE Q-Commerce SKU — 22% assortment cut · +14% GMV growth.
- 🇺🇸 USA QSR Site Selection — QSR chain — 300 locations screened, 42 approved.
Questions
Frequently Asked Questions
A well-designed pipeline delivers per-restaurant, per-menu-item pricing; consumer-facing delivery fees; promotional overlays; availability signals; restaurant ratings; category tagging; and historical time-series across Philippines, Singapore, Malaysia, Thailand, Indonesia, and Vietnam.
Philippines, Singapore, Malaysia, Thailand (Grab Thailand food data extraction), Indonesia, Vietnam, and Cambodia as required by the client's scope.
Publicly-signaled commission tier indicators are captured. Exact per-restaurant commission negotiations remain confidential to Grab and the restaurant partner.
The analytics layer converts PHP, SGD, MYR, THB, IDR, and VND to a common comparison currency (USD or the client's preferred base) with purchasing-power context.
Yes — the pipeline architecture extends to Foodpanda, ShopeeFood, Deliveroo, and Uber Eats across SEA markets.
Yes — sourcing operates within each SEA market's applicable data compliance frameworks.
Get a Free Food Data Sample in 48 Hours.
Tell us your platforms, target markets and required fields — we'll map exactly what's possible with food data scraping, recommend the right approach, and send a working sample so you can verify quality before any commitment.
Request a strategy call
Thanks — our data team will reach out within 48 hours with your sample.



