Introduction
GrabFood vs GoFood vs ShopeeFood is the core comparison for anyone selling food online in Indonesia. Grab led 2025 food delivery GMV with an estimated 46% share, ahead of Gojek (31%) and ShopeeFood (23%). Comparing the three apps means tracking the same restaurants' menu prices, promotions, delivery fees, ratings and ETAs side by side.
Those share figures are estimates from Momentum Works' Food Delivery Platforms in Southeast Asia report, as reported by Bisnis.com (28 Jan 2026). The same report put Indonesia's 2025 food delivery GMV at about US$6.4 billion, the largest in Southeast Asia.
This guide explains how the three platforms differ, which data fields to collect, how to match the same outlet across apps, and how to plan city coverage. It is a general guide, not a client case study.
How big is Indonesia's food delivery market in 2026?
No single official figure covers the whole market, so it helps to read several sources together and treat third-party numbers as estimates.
| Metric | Value | Scope and date | Source |
|---|---|---|---|
| Indonesia food delivery GMV | About US$6.4 billion (est.) | Indonesia, 2025 | Momentum Works via Bisnis.com |
| GMV share: Grab / Gojek / ShopeeFood | 46% / 31% / 23% (est.) | Indonesia, 2025 | Momentum Works via Bisnis.com |
| Indonesia food delivery growth | 18% (est.) | Indonesia, 2024 vs 2023 | Momentum Works, Feb 2025 |
| Southeast Asia food delivery GMV | US$22.7 billion (est.) | Southeast Asia, 2025 | Momentum Works via e27 |
| Southeast Asia food delivery GMV | About US$23 billion (projection) | Southeast Asia, 2025 | e-Conomy SEA 2025, Bain press release, 11 Nov 2025 |
| Grab Deliveries GMV | US$4,249 million, +24% YoY (constant currency) | All Grab markets, Q2 2026 | Grab Q2 2026 results, 4 Aug 2026 |
| GoTo On-demand Services net revenue | Rp3.6 trillion; completed orders +3% YoY | Gojek (mobility and delivery), Q2 2026 | Bisnis.com, 29 Jul 2026 |
Two cautions. Grab's filing covers all its markets, not just Indonesia, and GoTo reports Gojek's mobility and delivery together, so neither gives a clean GoFood or GrabFood Indonesia number. Also, merger talks between Grab and GoTo have been widely reported, including a DealStreetAsia report (13 Nov 2025), but no completed deal was confirmed in the sources we checked. As of October 2026 the deal remained unresolved — not completed and not formally abandoned (Fortune, Nov 2025).
How do GrabFood, GoFood and ShopeeFood differ?
All three apps list restaurants, menus and promotions, but they sit inside different ecosystems. That shapes how they price delivery, fund discounts and reward loyal users.
| Factor | GrabFood | GoFood | ShopeeFood |
|---|---|---|---|
| Owner | Grab Holdings (Nasdaq-listed) | GoTo Gojek Tokopedia (IDX-listed) | Sea Limited's Shopee |
| 2025 Indonesia GMV share (est.) | 46% | 31% (Gojek) | 23% |
| Super-app context | Rides, deliveries, payments (OVO accepted in GrabFood promos) | Rides, deliveries, GoPay | Shopee e-commerce app and ShopeePay |
| Customer fee and promo model | Delivery fee by distance and time; city-level promo caps and minimum orders, e.g. a 2022 campaign set different minimums for Jakarta and Surabaya (Grab) | Delivery and service fees vary by order and city, shown at checkout subscription discounts | Service fee of Rp1,000–3,000 reported for the launch period (IDX Channel, Jun 2022); exact current fees not publicly disclosed; free-delivery vouchers |
| Loyalty / subscription | Grab subscription plan with free-delivery vouchers (2022 campaign page); GrabVIP priority-delivery upgrades rolling out in Indonesia (Grab, Feb 2025) | Gojek PLUS: 14, 30 or 90-day plans with discounts up to Rp12,000 per transaction (InvestorTrust, May 2024) | Shopee vouchers and coins; no separate ShopeeFood subscription plan confirmed |
| Merchant commission | About 20–30% per order (third-party: Jakarta Post, 2021; menuviel, 2024–25) | About 20–25% plus a flat per-order fee (third-party, same sources) | About 15–25% per transaction (third-party estimate, majoo, May 2026) |
| Cities | Nationwide, incl. tier-2/3 cities | Nationwide, incl. tier-2/3 cities | Mainly urban cities |
Consumer preference has shifted over time too. An older Snapcart survey from October 2021 found 54% of consumers preferred GrabFood, 34% GoFood and 12% ShopeeFood (Snapcart). Compare that with the 2025 GMV estimates above, and ShopeeFood's growth is clear. Live platform data shows these shifts at outlet level, which annual surveys cannot.
What Indonesia food delivery data fields should you track?
Use one schema for all three apps so every outlet, item and fee lines up. These ten fields cover most competitive questions:
- merchant_name and outlet_id – the restaurant and branch name as listed, plus the platform's public outlet ID.
- cuisine – the platform's cuisine tags, mapped to one shared category list.
- rating – the public star rating for the outlet.
- rating_count – the number of ratings, a public proxy for popularity.
- menu_item – item name, category and description as shown.
- price – listed item price in rupiah, plus any strike-through price.
- promo – discount type, percentage or cap, minimum order and validity text.
- delivery_fee – the fee shown for the test location, with any free-delivery label.
- eta – the estimated delivery time window shown to the test location.
- distance – distance from the outlet to the test location, as displayed or calculated from coordinates.
Add captured_at, city, test_location and platform to every row. These keep snapshots comparable over time and across cities. We do not collect customer names, reviews tied to identifiable people, phone numbers or order histories.
How do you match the same merchant across GrabFood, GoFood and ShopeeFood?
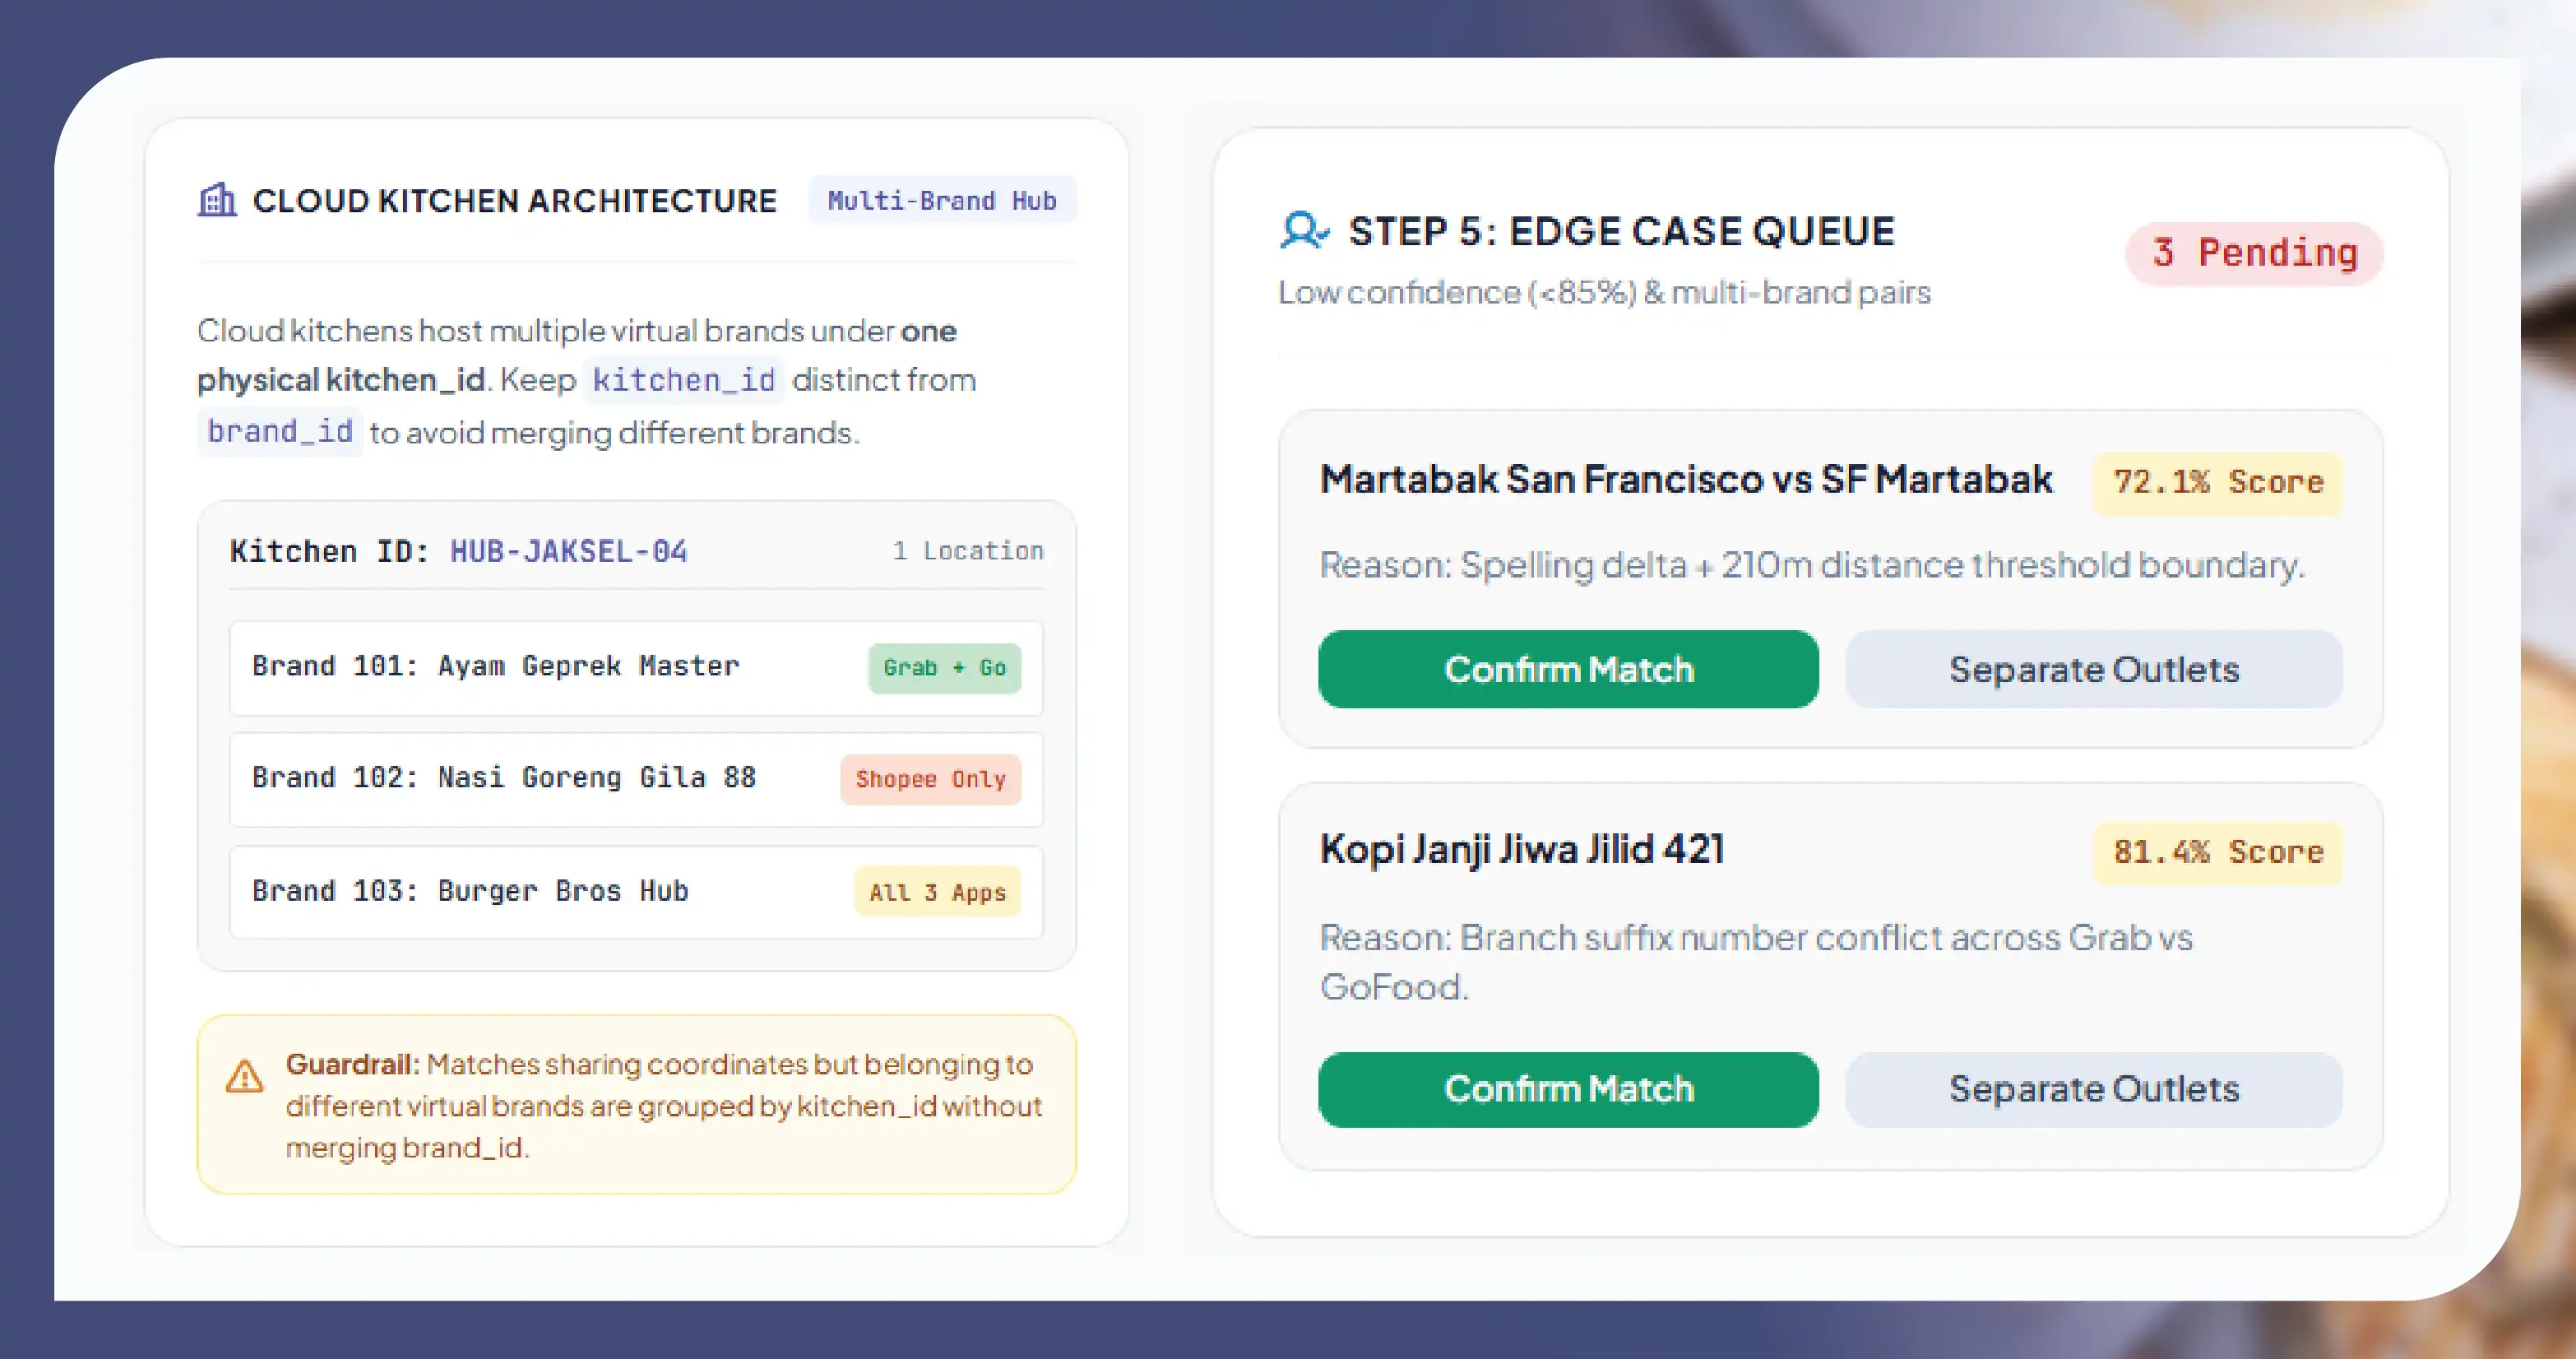
Matching is the hardest step in any GrabFood vs GoFood vs ShopeeFood comparison. The same warung or chain branch can appear with a different name, address format and menu wording on each app. A practical approach has five steps:
- Normalise names. Lower-case, remove branch suffixes and common words such as "Resto", "Kedai" or "Cabang", and standardise spelling.
- Block by location. Compare only outlets within a small radius of each other, using public coordinates or geocoded addresses.
- Score similarity. Combine name similarity, distance and cuisine match into one score.
- Check the menu. Compare overlapping item names and prices. Two outlets with many shared items are very likely the same kitchen.
- Review edge cases. Send low-confidence pairs and multi-brand cloud kitchens to a human reviewer, and keep a match_confidence field.
Cloud kitchens need extra care. One kitchen may run several virtual brands, and each brand may list on only one or two apps. Keep a kitchen_id separate from brand_id so you don't merge different brands by mistake.
Which Indonesian cities should you cover first?
Start where your outlets or competitors are, then widen. Promo rules can differ by city, as the 2022 Grab campaign above showed, so city-level snapshots matter. The table is a planning template. Values come from your own dataset once collected.
| City | What to track first | Why it matters | What the dataset provides |
|---|---|---|---|
| Jakarta | Chain price parity, promo depth, ETA by district | Largest and most competitive delivery market | Price parity, promo depth and district ETAs, on request |
| Surabaya | Local chains vs national brands, delivery fee by distance | Second-tier city benchmark for national pricing | National-brand vs local pricing and delivery fees, on request |
| Bandung | Café and snack categories, promo minimum orders | Large student and young-adult audience | Café and snack pricing and promo minimums, on request |
| Medan | Cuisine mix, rating counts, platform coverage gaps | Sumatra benchmark outside Java | Cuisine mix, rating counts and coverage gaps, on request |
| Bali (Denpasar, Badung) | Tourist-area pricing, ETAs, English-language menus | Seasonal demand and visitor-driven menus | Tourist-area pricing, ETAs and menu languages, on request |
Who uses this data?
- F&B brands and QSR chains: Check that menu prices and promos match across apps, and see which platform rivals are discounting on.
- Cloud kitchens: Find cuisine gaps by district, compare ratings and ETAs, and choose which apps to list each virtual brand on.
- FMCG and beverage companies: Track how often your brands appear on menus, at what price, and in which bundles.
- Investors and analysts: Follow platform coverage, promo intensity and pricing as a cross-check on reported GMV and market-share estimates.
- Sales and partnerships teams: Build public business-level restaurant lists by city and cuisine for outreach.
We see this demand directly. Recent inquiries asked for GrabFood, GoFood and ShopeeFood competitive intelligence in one feed, and for nationwide lists of Indonesian restaurants at listing level.
Is it legal to collect Indonesia food delivery data?
Restaurant names, menus, listed prices, promos, ratings and delivery fees shown publicly are business information. Collecting them responsibly is a common practice, but keep these rules in mind. This is general guidance, not legal advice.
- No personal data: Indonesia's Personal Data Protection Law (Law No. 27 of 2022, in full force from Oct 2024) governs personal data (overview). Leave out customer names, reviewer profiles, phone numbers and order histories.
- Public pages only: No logins, no account data, and no bypassing of CAPTCHAs or other access controls.
- Respect platform rules: Follow robots.txt and terms of service, and keep request rates low.
- Business-level lists: Restaurant lists stay at public listing level, never personal contacts of owners or staff.
- No sales volumes: Order counts are not public. Use labelled proxies such as rating counts and bestseller badges.
Build vs buy: how should you get the data?
An in-house team can test one app in one city. Three apps across five cities with daily refreshes is a different job: three app structures, location-based results, frequent layout changes and a matching layer on top. Buying a managed feed makes sense when you need ongoing, matched data rather than a one-off pull.
When comparing providers, ask for a sample from your own cities, the field dictionary, how they match outlets across apps, how they handle location-specific fees and ETAs, and how they keep personal data out.
Get a free sample dataset. Name your cities and competitors, and we'll send a matched GrabFood, GoFood and ShopeeFood sample with menus, prices, promos, fees and ETAs.
Questions
Frequently Asked Questions
Momentum Works estimated Grab at 46% of 2025 Indonesia food delivery GMV, Gojek at 31% and ShopeeFood at 23%. These are third-party estimates, not company-reported figures.
Not always. Restaurants can set different prices per app, and promos differ by platform and city. Matched, same-day snapshots are the reliable way to check.
No. Order volumes are not public. We offer labelled proxies instead, such as rating counts, bestseller tags and item availability.
Weekly suits menu and price tracking. Daily or intraday suits promos, delivery fees and ETAs, which change faster.
It should not. We collect public business data only and exclude customer, reviewer and staff details, in line with Indonesia's PDP Law.
Get a Free Food Data Sample in 48 Hours.
Tell us your platforms, target markets and required fields — we'll map exactly what's possible with food data scraping, recommend the right approach, and send a working sample so you can verify quality before any commitment.
Request a strategy call
Thanks — our data team will reach out within 48 hours with your sample.