
Introduction
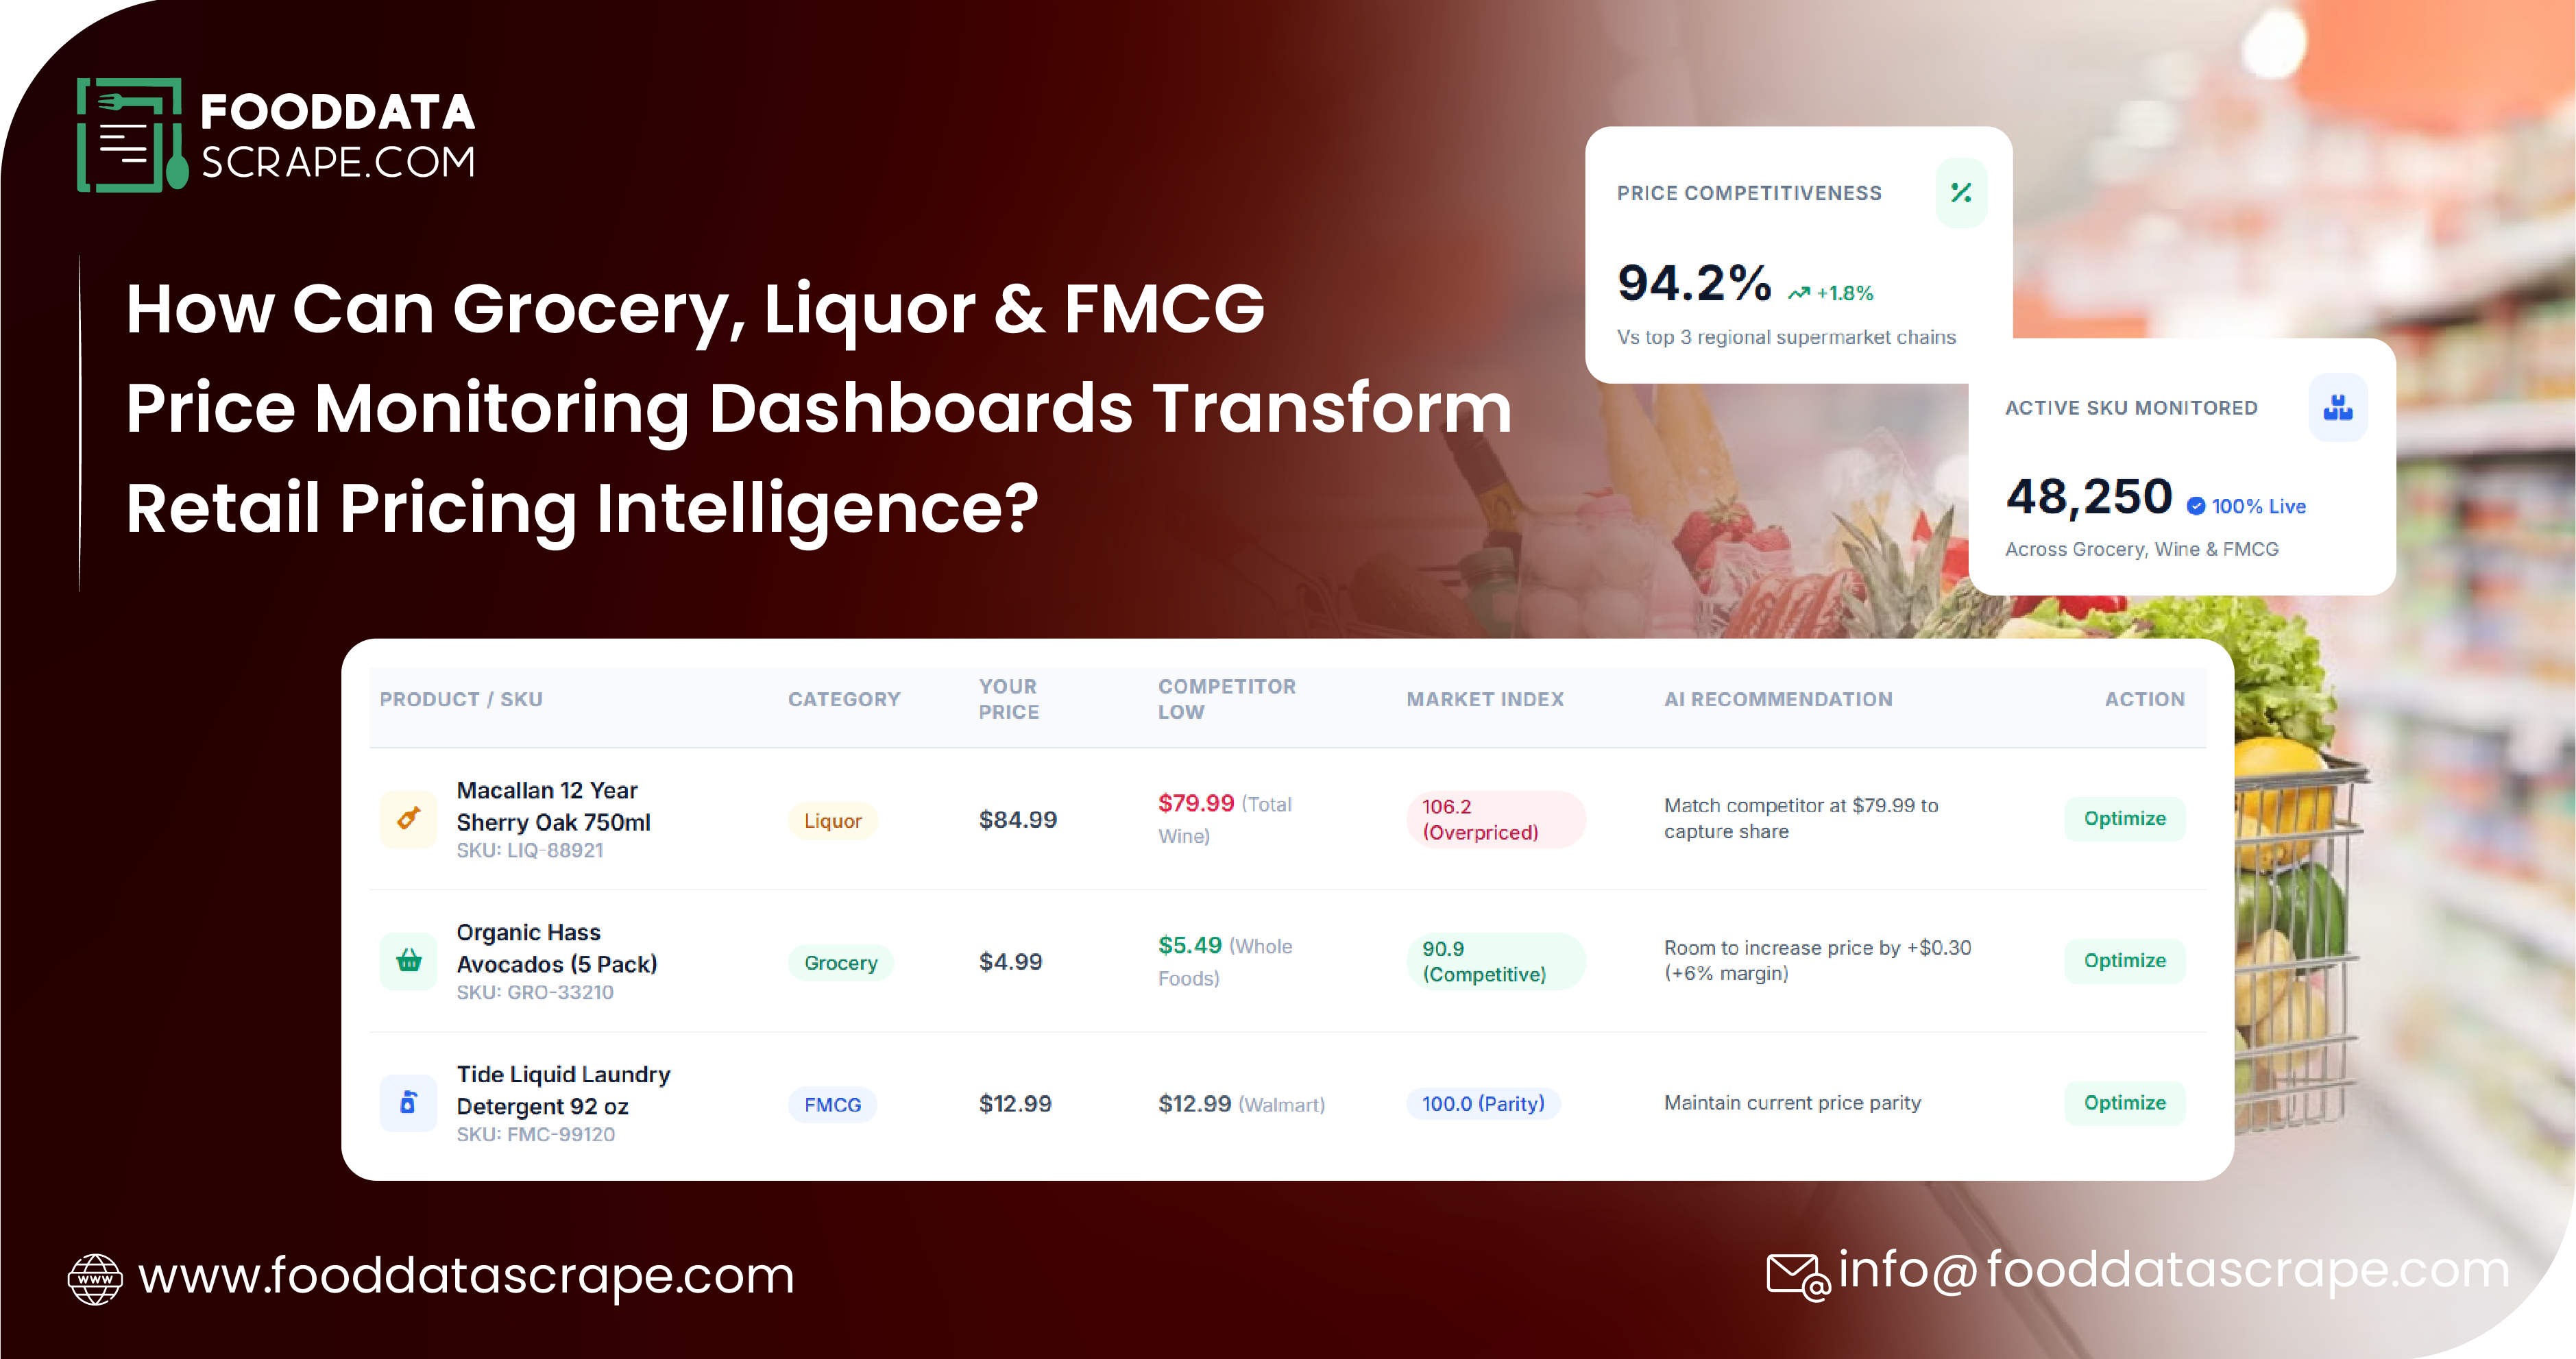
Retail pricing is changing faster than ever. Grocery products, liquor brands, and fast-moving consumer goods (FMCG) can experience frequent price adjustments driven by promotions, supply conditions, competitor actions, seasonal demand, and regional purchasing behavior. For retailers, brands, distributors, and market researchers, manually tracking these changes across multiple stores and digital marketplaces is increasingly difficult. Grocery, Liquor & FMCG Price Monitoring Dashboards provide a centralized way to capture, organize, compare, and visualize pricing movements across products, retailers, categories, and markets.
Modern dashboards transform large volumes of retail information into actionable intelligence. Instead of reviewing spreadsheets or visiting multiple websites, business teams can monitor price changes through interactive dashboards that reveal current prices, historical movements, discounts, availability, and competitive positioning. This enables faster decisions around pricing, promotions, assortment planning, and market expansion.
Why Retail Price Monitoring Has Become Essential?
Consumers have become highly price-sensitive, particularly in grocery and FMCG categories where similar products are available from multiple retailers. A small difference in the price of cooking oil, cereal, detergent, snacks, beverages, or personal-care products can influence purchasing decisions. Liquor markets experience similar dynamics, with prices varying by retailer, package size, location, promotions, and brand positioning.
Businesses therefore need continuous visibility rather than occasional price checks. Scrape Grocery Price Monitoring Data to help organizations collect product-level information at scale, allowing them to compare prices across retailers and identify meaningful market movements. When this information is connected to a dashboard, teams can quickly identify products that became more expensive, items receiving aggressive discounts, and categories experiencing unusual pricing activity.
Building a Unified Pricing Intelligence Layer
A major advantage of dashboard-driven monitoring is the ability to bring fragmented pricing information into one analytical environment. Retail data may originate from grocery chains, supermarkets, convenience stores, online marketplaces, delivery platforms, and brand websites. Each source may structure product information differently, making direct comparison challenging.
A structured monitoring system can standardize product names, brands, pack sizes, categories, prices, promotional prices, discounts, availability, and retailer information. FMCG Price Data Scraping In Egypt can be particularly valuable for organizations monitoring rapidly evolving consumer markets, where local retailers and digital commerce platforms can exhibit different pricing patterns.
The same framework can be expanded across multiple geographies. Businesses operating in Egypt and Gulf markets can compare regional pricing, identify market-specific promotions, and understand how product positioning differs between countries. This creates a broader view of competitive performance instead of limiting analysis to a single retailer or market.
What Modern Price Monitoring Dashboards Track?
An effective dashboard should go beyond simply displaying a product's current price. It should provide multiple dimensions of information that help analysts understand why prices are changing and what those changes mean.
Common dashboard metrics include:
- Current product price
- Previous recorded price
- Percentage price change
- Promotional price
- Discount percentage
- Product availability
- Brand and manufacturer
- Product category
- Pack size and unit price
- Retailer or marketplace
- Geographic market
- Historical price movement
- Promotion frequency
- Competitive price position
- Price index by category
This information enables companies to move from basic monitoring toward advanced competitive analysis.
From Raw Data to Actionable Market Intelligence
Raw pricing records have limited value if decision-makers cannot interpret them quickly. Extract Grocery FMCG Price Monitoring Data to create a structured foundation that can be transformed into visual indicators, comparative charts, alerts, and trend reports.
For example, a dashboard could identify that a particular detergent brand is consistently priced 8% above competing products across several retailers. Another view might show that a beverage brand has reduced its price for three consecutive weeks. A category-level analysis could reveal that private-label products are becoming increasingly competitive against established brands.
These insights help commercial teams determine whether pricing changes are isolated events or broader market trends.
Supporting Egypt and Gulf Market Expansion
Regional pricing intelligence becomes particularly important for businesses operating across diverse consumer markets. Egypt & Gulf Market Intelligence can help brands understand how products behave across different retail environments and identify meaningful variations in pricing, promotions, and assortment.
For example, a product that maintains premium positioning in one market may require a different promotional strategy in another. Currency conditions, purchasing power, distribution structures, retailer strategies, and consumer preferences can all influence pricing.
A dashboard can place markets side by side, making it easier to compare average prices, discount intensity, product availability, and retailer positioning. Instead of analyzing each market independently, decision-makers gain a regional perspective that supports expansion and localization strategies.
Competitive Benchmarking Across Retailers
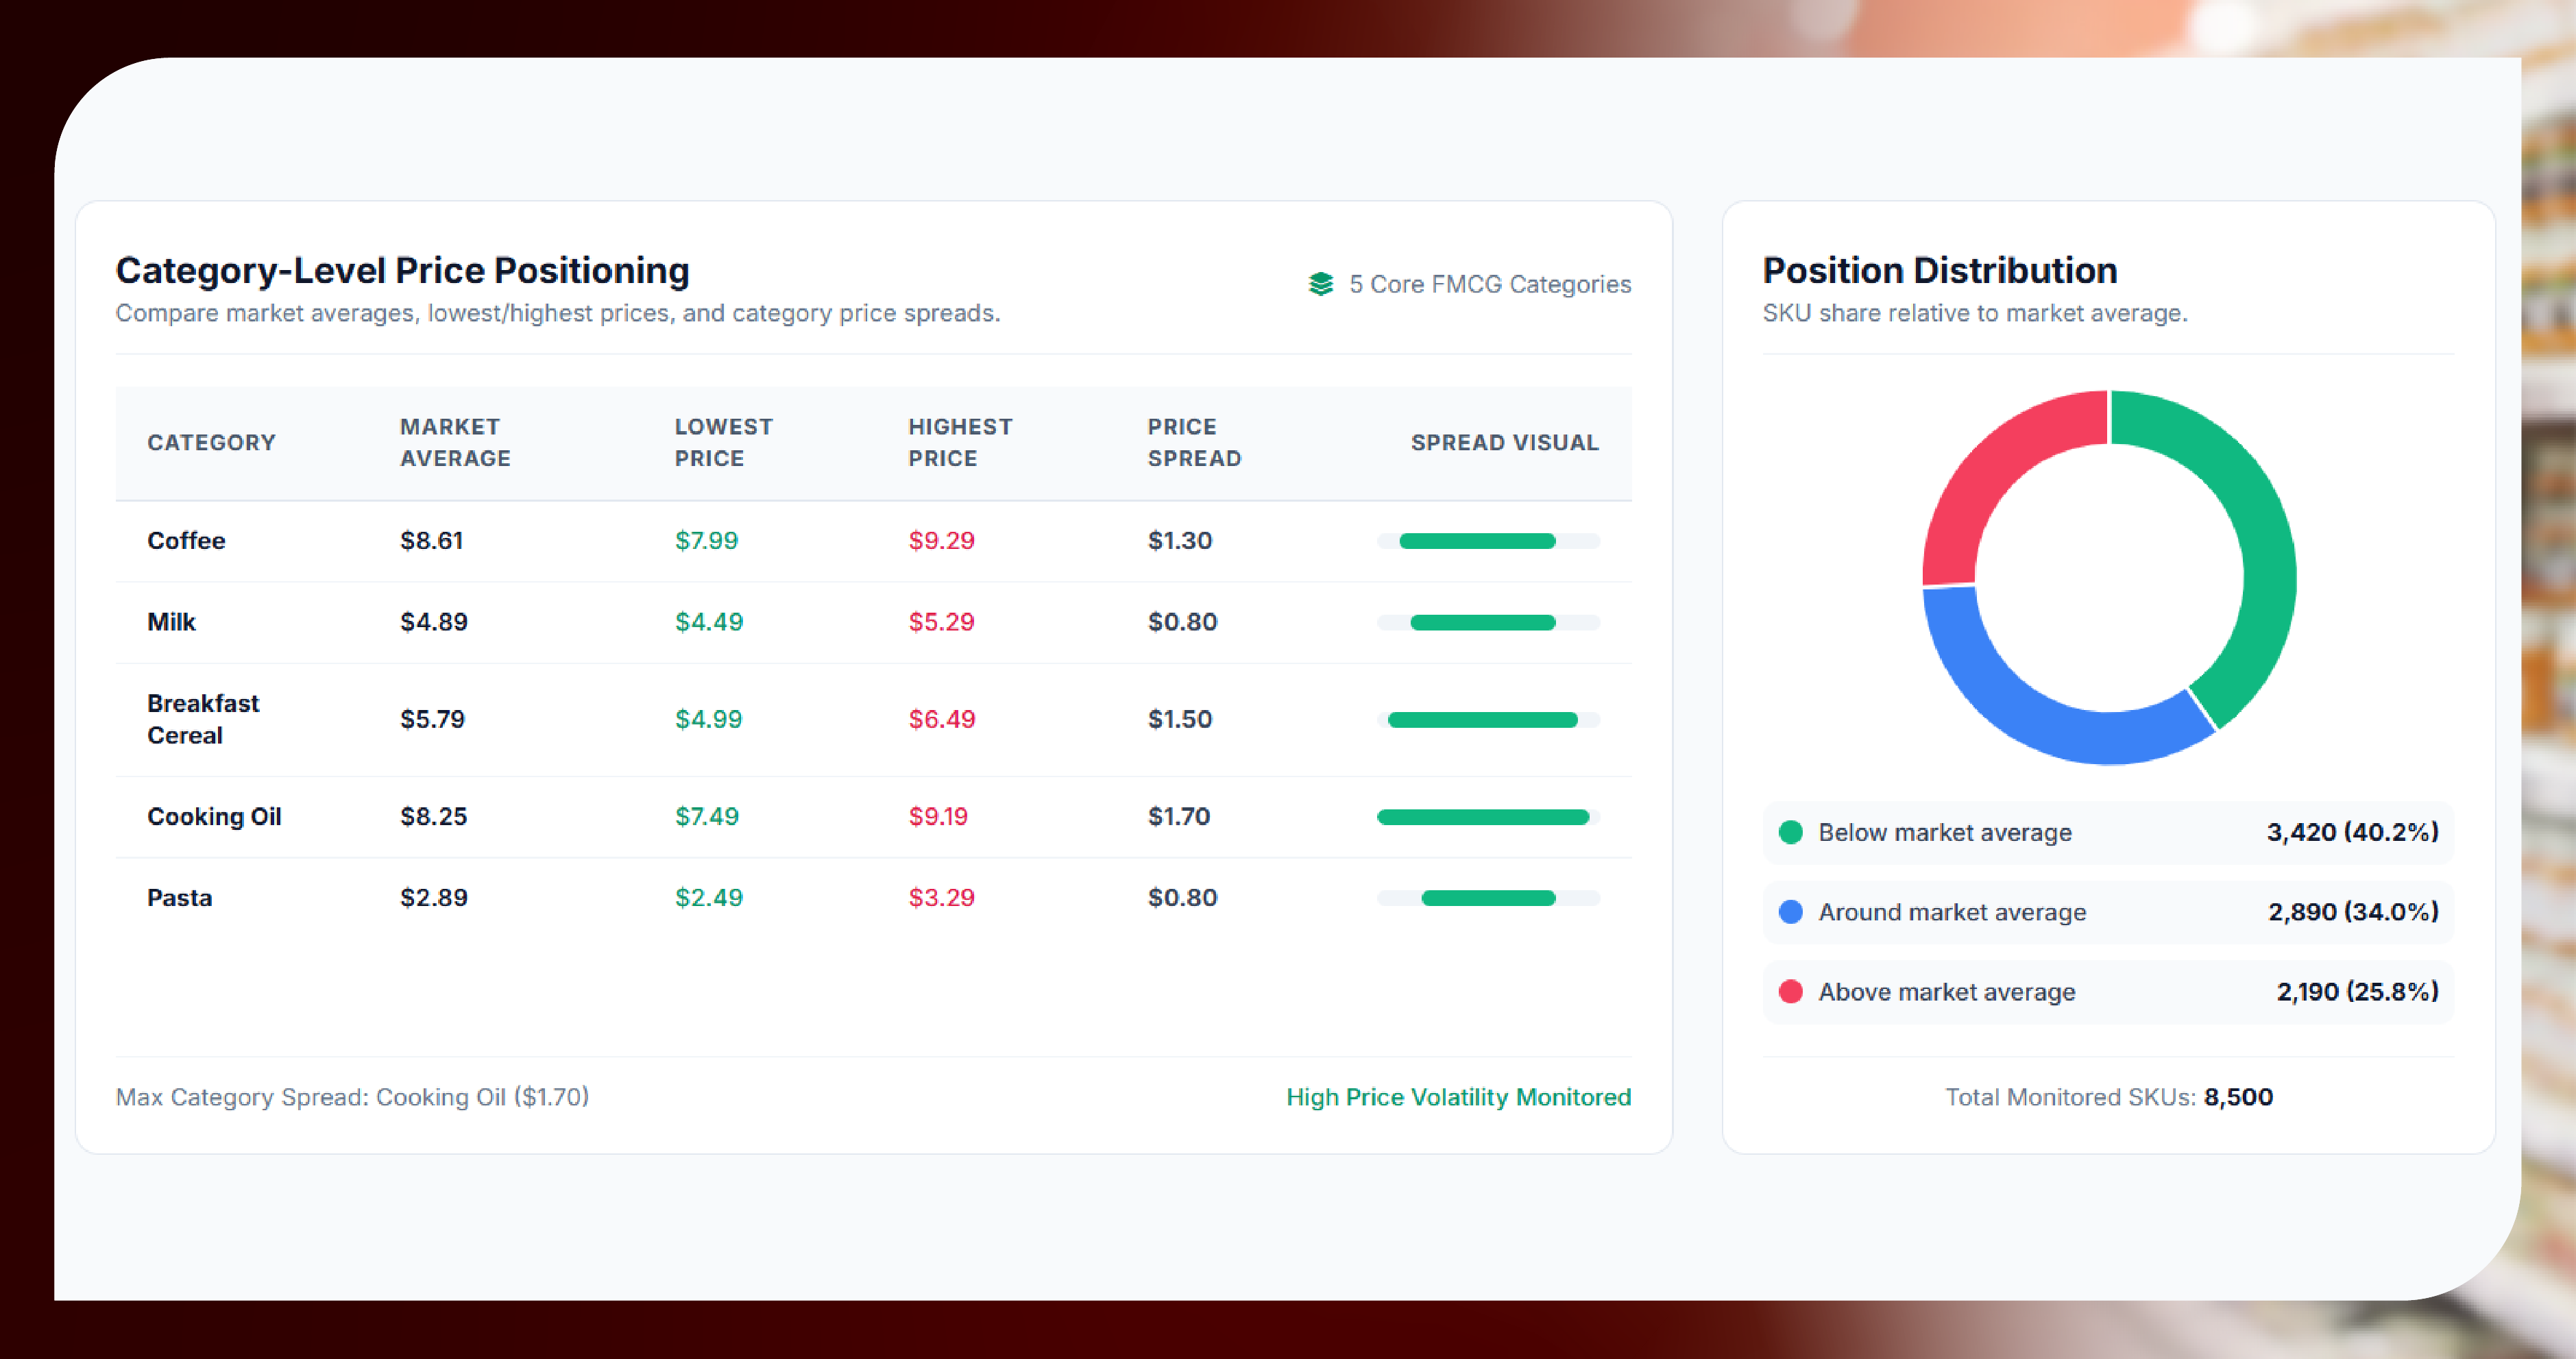
Retailers compete not only on product selection but also on price perception. Customers increasingly compare prices before completing a purchase, particularly through digital channels. This creates a need for businesses to understand where they stand relative to competitors.
Grocery Retail Pricing Intelligence enables companies to benchmark comparable products across multiple retailers. A pricing dashboard can highlight the lowest-priced retailer, median market price, highest-priced retailer, and average discount for a particular SKU.
Consider a packaged coffee product listed at different prices across five retailers. A dashboard could immediately show whether a retailer is positioned below, around, or above the market average. When this information is monitored repeatedly, businesses can also determine whether the difference is temporary or part of a longer-term pricing strategy.
The Value of Real-Time Monitoring
Retail pricing is dynamic. Promotions can begin and end within hours, while competitors may change prices in response to market conditions. Static reports can therefore become outdated quickly.
Real-Time Grocery Price Monitoring Data gives businesses a more current view of market conditions. Depending on monitoring frequency, organizations can receive updated information at regular intervals and identify significant price movements without waiting for monthly research cycles.
Real-time monitoring can support:
- Competitor price alerts
- Promotion tracking
- Discount monitoring
- Stock and availability analysis
- Price anomaly detection
- Category-level trend analysis
- Dynamic pricing decisions
- Campaign performance evaluation
This creates a more responsive approach to retail intelligence.
Monitoring Liquor Pricing with Greater Precision
Liquor is another category where pricing intelligence can provide significant commercial value. Product prices may differ according to bottle size, brand, retailer, region, promotions, and seasonal demand. Premium spirits, wine, beer, and other beverage categories can each demonstrate different pricing behaviors.
A dashboard can organize liquor SKUs by brand, product type, bottle size, retailer, and market. Analysts can then identify price gaps between competitors, track promotional periods, and observe how premium and mainstream products are positioned.
For distributors and brands, this information can support decisions about promotions, channel strategy, assortment planning, and market positioning.
FMCG Price Intelligence at Scale
FMCG portfolios often contain thousands of SKUs spanning food, beverages, household products, personal care, packaged goods, and other categories. Monitoring these products manually can quickly become inefficient.
Professional Grocery Data Scraping Services can support large-scale data collection and standardization, enabling businesses to build consistent datasets for dashboard analysis. Product records can be organized according to SKU, brand, category, retailer, price, pack size, promotional status, and location.
Once standardized, these records can feed dashboards that allow users to filter information by market, retailer, category, brand, or time period. This turns a large product database into an accessible intelligence resource for business teams.
Alerts, Trends, and Decision-Making
The strongest dashboards do not simply display historical information. They help teams identify what deserves attention.
Automated alerts can flag substantial price increases, sudden discounts, newly introduced products, discontinued SKUs, or major competitor pricing movements. Trend views can reveal whether prices are gradually increasing or decreasing over time.
For category managers, these signals can support assortment decisions. For pricing teams, they can inform competitive responses. For brand managers, they can reveal whether products are maintaining their intended market position.
The result is a shift from reactive decision-making toward proactive retail management.
Ready to turn retail pricing data into actionable insights? Partner with Food Data Scrape to build accurate, scalable price monitoring dashboards and gain smarter grocery, liquor, and FMCG market intelligence.
Turning Pricing Data into a Strategic Asset
The long-term value of price monitoring comes from historical accumulation. A single price observation tells a business what a product costs today. Thousands of observations reveal how the market behaves.
Historical datasets can expose recurring promotional cycles, seasonal pricing patterns, competitor strategies, and category-level inflation. Businesses can use these insights to establish benchmarks and evaluate whether their own pricing decisions are producing the desired market position.
This also makes pricing information useful beyond the pricing department. Procurement teams can use market signals for supplier negotiations, marketing teams can evaluate promotional environments, and executives can monitor broader market conditions.
The Future of Retail Price Monitoring
The future of retail intelligence will increasingly combine automated data collection, centralized dashboards, machine learning, and predictive analytics. Instead of simply reporting that a competitor changed a price, intelligent systems can help identify unusual movements and highlight potentially important patterns.
AI-powered analysis can compare thousands of products simultaneously, detect anomalies, classify promotions, and identify relationships between price changes and availability. As retailers expand their digital presence, the volume and frequency of pricing information will continue to increase.
For organizations competing across grocery, liquor, and FMCG markets, the ability to transform this information into fast, understandable intelligence will become increasingly important.
How Food Data Scrape Can Help You?
1. Comprehensive Price Monitoring
Food Data Scrape helps businesses collect grocery, liquor, and FMCG pricing information across retailers, enabling continuous comparisons, price tracking, promotional monitoring, and faster responses to competitive market changes.
2. Competitive Market Intelligence
Businesses can analyze competitor prices, discounts, product availability, pack sizes, and promotions to understand market positioning and identify opportunities for stronger pricing, assortment, and promotional strategies.
3. Real-Time Data Insights
Food Data Scrape delivers frequently updated retail information, helping businesses detect price changes, new promotions, availability shifts, and emerging trends before they significantly impact competitive performance.
4. Customized Dashboard Solutions
Collected data can be structured into customized dashboards featuring filters, historical comparisons, retailer benchmarking, category analysis, and visual reports, making complex pricing information easier for decision-makers to understand.
5. Scalable Retail Datasets
Food Data Scrape supports scalable datasets covering extensive product catalogs, retailers, categories, and locations, providing reliable data foundations for market research, pricing intelligence, forecasting, and strategic planning.
Conclusion
Pricing intelligence has evolved from periodic competitor checks into a continuous strategic capability. AI Grocery Intelligence can help businesses interpret large volumes of product, pricing, promotional, and availability information while making important patterns easier to identify.
A well-designed Grocery Dashboard brings these insights together through interactive visualizations, competitive comparisons, alerts, and historical trends. It can give retailers, brands, distributors, and researchers a centralized view of changing market conditions.
At the foundation, reliable Grocery Store Datasets provide the structured information required to power meaningful analysis. When accurate data, automated monitoring, and intelligent dashboards work together, businesses gain a stronger understanding of retail pricing and can respond to market changes with greater speed, precision, and confidence.
Are you in need of high-class scraping services? Food Data Scrape should be your first point of call. We are undoubtedly the best in Food Data Aggregator and Mobile Grocery App Scraping service and we render impeccable data insights and analytics for strategic decision-making. With a legacy of excellence as our backbone, we help companies become data-driven, fueling their development. Please take advantage of our tailored solutions that will add value to your business. Contact us today to unlock the value of your data.
Get a Free Food Data Sample in 48 Hours.
Tell us your platforms, target markets and required fields — we'll map exactly what's possible with food data scraping, recommend the right approach, and send a working sample so you can verify quality before any commitment.
Request a strategy call
Thanks — our data team will reach out within 48 hours with your sample.



