
Introduction
Grocery markdown tracking means collecting, on a schedule, the reduced, clearance and short-dated prices that grocers show on their public web pages, then comparing them with the regular price. Done well, it shows which categories, stores and brands are under markdown pressure, how deep discounts go and how fast stock clears.
Planned promotions such as BOGO offers are printed in weekly ads. Markdowns are different. They are often unplanned, local and short-lived, which makes them a useful early signal of overstock, slow sellers and food that is close to its date.
The scale of the problem behind these deals is large. The UNEP Food Waste Index Report 2024 estimates that 1.05 billion tonnes of food were wasted in 2022, including 131 million tonnes at retail (UN News). This guide explains which public sources show markdowns, which fields to collect, the metrics to watch, and the compliance rules to follow.
Why does grocery markdown tracking matter?
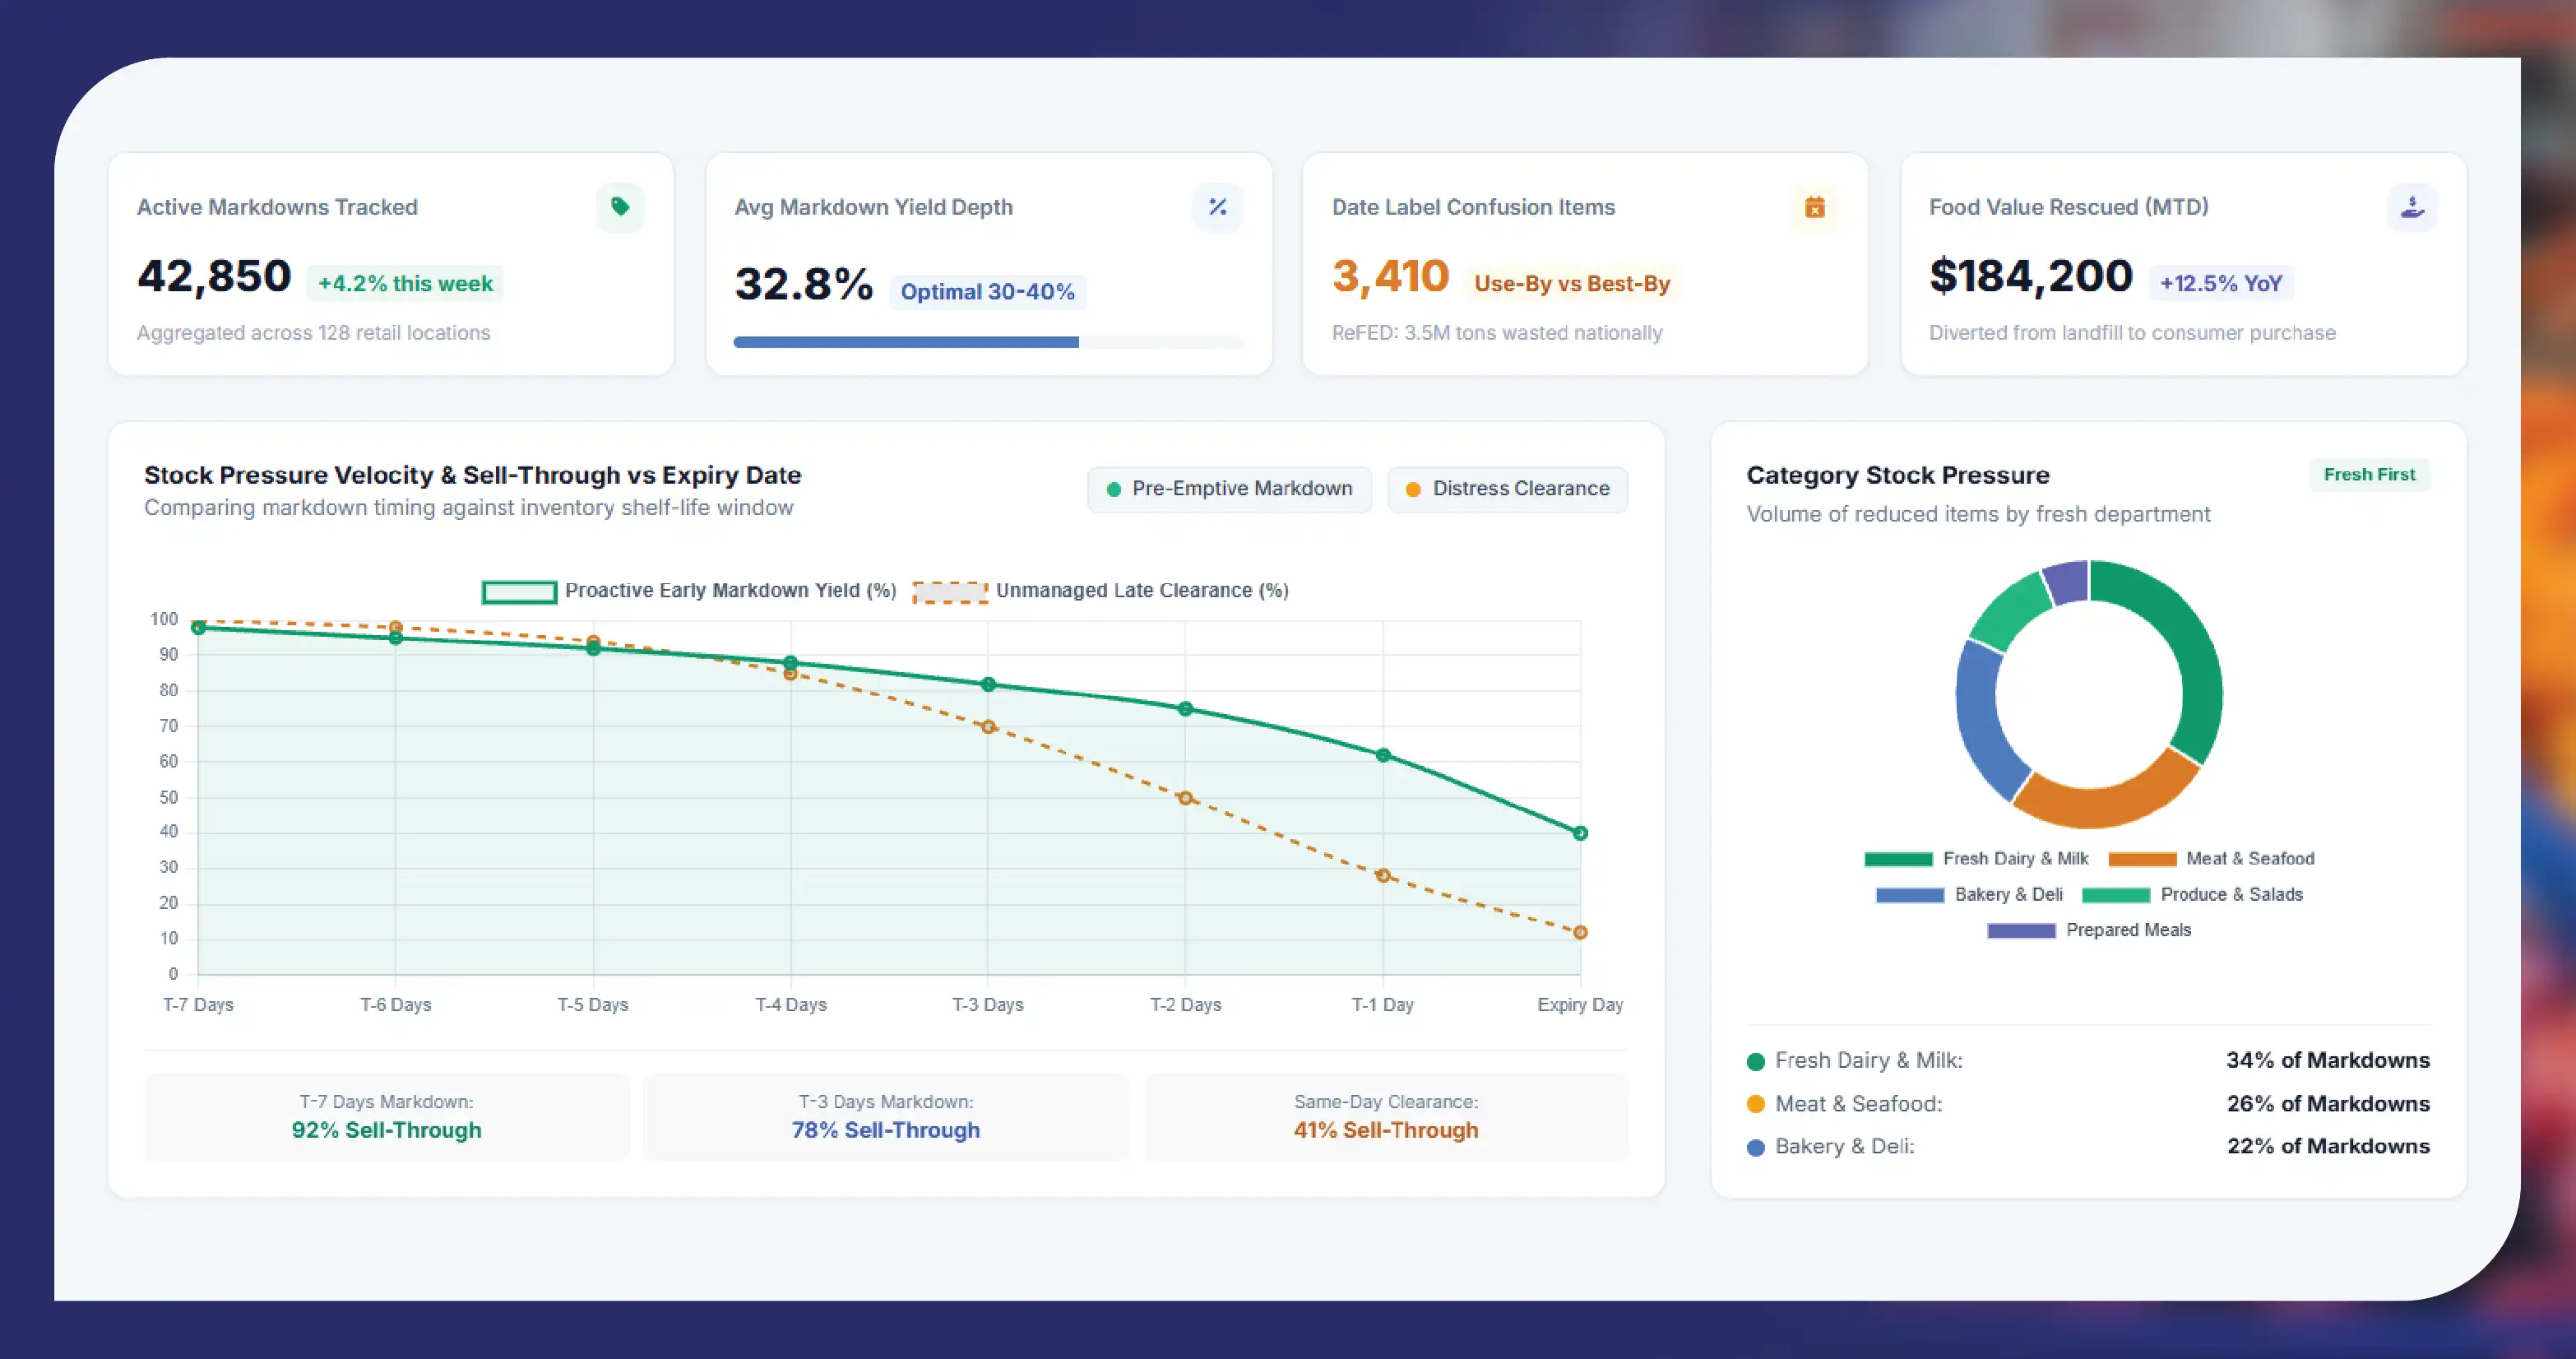
Markdowns sit where pricing, inventory and sustainability meet. A single "reduced" sticker tells you little. Thousands of them, tracked by store, category and day, tell you a lot.
- Food waste is costly. ReFED estimates that the U.S. had 70 million tons of surplus food in 2024, about 29% of the food supply, worth about $380 billion (ReFED).
- Date labels drive waste. ReFED also reports that more than 3.5 million tons of food are discarded each year because of confusion over date labels (ReFED).
- The long-run picture is consistent. USDA estimates U.S. food waste at 30–40% of the food supply, about 133 billion pounds and $161 billion of food in 2010 (USDA).
- Global retail waste is measurable. UNEP puts global waste at 79 kg per person per year, and 19% of food available to consumers is wasted across retail, food service and households (UN News).
Markdown data does not measure waste directly. It shows the pricing actions retailers take to avoid it. That makes it a practical, public proxy for stock pressure.
Who uses near-expiry food deals data?
Four groups ask for this data most often.
- CPG brands: spot where their products are being cleared, at what depth and in which regions, before it shows up in sell-out reports.
- Retailers and category managers: benchmark their own clearance strategy against competitors – timing, discount steps and how many lines are reduced.
- Sustainability and ESG analysts: follow surplus-food signals by category and region to support food-waste research and reporting.
- Deal and savings apps: show shoppers current reduced and clearance items from public pages, with clear store and date context.
Which public sources show grocery markdowns?
Markdown data comes from several kinds of public pages. Each shows different signals, and some popular sources are app-only, which limits what can be collected.
| Source type | Examples of what is shown | Typical signals | Collection notes |
|---|---|---|---|
| Online grocery "reduced" or "clearance" sections | Reduced-to-clear, clearance or "last chance" category pages on grocer websites | Regular price, sale price, % off, category | Varies by retailer and store; many need a store or postcode selected |
| Price-drop and rollback labels | "Rollback", "price drop", "was / now" badges on product pages | Was price, now price, label type, start date if shown | Good for spotting long markdowns vs short promos |
| Short-dated or "use soon" sections | Short-dated or near-date ranges some grocers list online | Best-before or use-by date only where publicly shown | Many sites do not show dates; never infer them |
| Weekly ads and digital circulars | Planned promotions, BOGO, multi-buy | Promo mechanic, validity dates | Separates planned promos from true markdowns |
| Surplus-food apps | Too Good To Go, Flashfood, Karma, Olio | Store participation, typical discount claims on public pages | Offers are mainly reserved and paid in the app; app-only or logged-in data is not collected |
A note on surplus-food apps. We checked their public websites on 14 October 2026. None of the four showed live offers or prices on the web:
- Too Good To Go: shoppers discover, reserve and pay for Surprise Bags in the app (Too Good To Go).
- Flashfood: deals are found and paid for in the app; the site links to a store locator (Flashfood).
- Karma: now presents itself mainly as a restaurant POS platform; surplus offers in Sweden are shown in the app (Karma app page).
- Olio: listings are in the app and include items given away by neighbours, which is personal, peer-to-peer content (Olio).
We do not collect app-only, logged-in or individual listings. Public store-locator pages can show which stores take part. Check each country's site again before scoping.
The 10 data fields that make markdown data useful
A clean record per product, store and date is what turns scattered deals into analysis. These are the fields we recommend.
- Product identity: product name, brand, pack size and retailer product ID, plus GTIN or UPC where it is shown publicly.
- Regular price: the "was" or standard shelf price shown on the page.
- Markdown price: the reduced, clearance or rollback price shown on the same page.
- Discount depth: the percentage off, calculated from the two prices and checked against any "% off" badge.
- Markdown label: the exact wording, such as reduced, clearance, rollback or price drop.
- Best-before or use-by date: captured only where the retailer publicly shows it; otherwise left blank.
- Category path: department, aisle and sub-category, so results can be grouped.
- Store and location: store ID, ZIP code or postcode and city, because markdowns are often store-level.
- Availability: in stock, low stock or out of stock where shown.
- Timestamps: first seen, last seen and collection time, so you can measure how long a markdown lasts.
| Field | Example value | Why it matters |
|---|---|---|
| product_name | Greek-style yogurt 500g | Matches the item across stores |
| regular_price | 3.50 | Baseline for discount depth |
| markdown_price | 1.75 | The clearance or reduced price |
| discount_pct | 50 | Core measure of markdown pressure |
| markdown_label | Reduced to clear | Separates clearance from planned promos |
| best_before_date | 2026-10-16 (only if shown) | Links price cuts to date proximity |
| category_path | Dairy > Yogurt | Category-level analysis |
| store_id / postcode | Store 0412 / 60614 | Store and regional patterns |
| availability | Low stock | Signals how fast stock clears |
| first_seen / last_seen | 2026-10-12 / 2026-10-14 | Markdown duration |
Example values are illustrative, not real data.
Which markdown metrics should you watch?
Raw prices become useful once you turn them into a few repeatable metrics. These work for grocery markdown tracking across retailers and countries.
| Metric | How it is calculated | What it tells you |
|---|---|---|
| Markdown share | Marked-down SKUs ÷ all tracked SKUs in a category or store | How widespread markdown pressure is |
| Average discount depth | Mean % off across marked-down SKUs | How aggressive clearance is |
| Discount ladder | Sequence of price steps on the same item over time (for example 25%, then 50%, then 75%) | A retailer's clearance policy |
| Markdown duration | last_seen minus first_seen for a markdown | How fast stock clears |
| Days-to-date at markdown | best_before_date minus first_seen, only where dates are shown | How early near-expiry items are reduced |
| Repeat markdown rate | Share of SKUs marked down again within a set period | Chronic overstock or slow sellers |
| Brand markdown index | A brand's markdown share vs its category average | Whether one brand is under extra pressure |
Read these metrics together. A high markdown share with shallow discounts suggests routine price management. A rising share with deeper discounts and short durations in fresh categories often points to near-expiry clearance.
How do you collect, clean and match markdown data?
Markdowns change by store and by hour, so collection design matters more than for regular prices.
- Pick stores and locations first. Many grocers show different reduced items per store, so set a fixed panel of stores, ZIP codes or postcodes.
- Set the right cadence. Fresh categories may need several checks a day; ambient lines usually need one daily check. Cadence must stay within each site's rate limits.
- Capture both prices. Store the regular and markdown price from the same page view, with the label text.
- Separate markdowns from promotions. Tag weekly-ad offers and multi-buys so they are not counted as clearance.
- Match products across retailers. Use GTIN or UPC where shown, then brand, name and pack size. This also helps link markdowns to pack-size changes tracked for shrinkflation.
- Quality-check outliers. Flag discounts above 90% or below 1%, missing regular prices and duplicate records for review.
Deliver the result as a scheduled CSV or JSON feed, an API, or a dashboard. Formats, cadence, stores and categories are agreed when we scope your project.
How do markdown patterns differ by category and country?
Markdown behaviour varies by category shelf life and by how each market's grocers show prices online.
| Category or market | Typical markdown pattern | What to track |
|---|---|---|
| Bakery and ready meals | Same-day reductions, often late in the day | Intraday price steps, store-level timing |
| Dairy and chilled | Reductions close to the date where shown | Days-to-date, discount ladder |
| Fresh produce | Price drops linked to quality and seasonality | Discount depth by item and week |
| Ambient and frozen | Longer clearance and rollback periods | Markdown duration, repeat rate |
| USA | Rollback and clearance labels on large grocer sites; store-specific pricing | ZIP-level panels, label type |
| UK | "Reduced" and short-dated ranges at some grocers; postcode-based pricing | Postcode panels, label wording |
| UAE / GCC and India | Online promotions and flash deals on grocery and quick-commerce platforms | Promo vs clearance tagging, city panels |
These are typical patterns observed in public listings, not fixed rules. Each retailer's pages should be reviewed before a project starts.
Use cases for grocery markdown tracking
- Markdown pressure alerts for CPG brands: a brand sees when its chilled range is being cleared at 50% or more across several regions and checks supply or forecast issues early.
- Clearance benchmarking for retailers: a pricing team compares its discount ladder and timing with competitors in the same postcodes.
- Waste-signal research for ESG analysts: analysts track markdown share in fresh categories over time as one input alongside sources such as ReFED and UNEP.
- Deal feeds for savings apps: apps show current reduced items from public grocer pages, with store and timestamp so users know the deal may change.
- Promo and shrinkflation context: combining markdowns with planned promos and pack-size tracking gives a fuller view of real shelf prices.
In each case, the value comes from seeing the regular price, the markdown price and the time of capture side by side, store by store.
Legal and compliance basics
Markdown data is collected only from publicly available business pages. We follow these rules on every project.
- Public pages only: no login bypass, no CAPTCHA bypass, no paywalled or account-only content.
- Respect terms and robots.txt: each site's terms of service and robots.txt are reviewed before collection, and rate limits are respected.
- No personal data: we do not collect shopper data, reviews tied to people, or peer-to-peer listings from individuals.
- Dates only where shown: best-before or use-by dates are captured only if the retailer publicly shows them. We never estimate or infer dates.
- Label estimates clearly: any modelled metric is labelled as an estimate in the feed.
Build vs buy: choosing a markdown data provider
You can build an in-house collector, but grocery markdown tracking adds work that regular price scraping does not. Store panels, intraday checks, label parsing and promo tagging all need upkeep when sites change.
When you compare providers, ask about:
- Coverage: which retailers, countries and store panels are realistic.
- Cadence: how often reduced sections can be checked within site limits.
- Matching: how products are matched across retailers and pack sizes.
- Quality checks: how outliers, missing prices and duplicates are handled.
- Delivery: feed, API or dashboard, and how history is stored.
Get a free sample dataset: reduced and clearance prices from a panel of public grocery pages, with discount depth and timestamps.
Questions
Frequently Asked Questions
It is the regular collection of reduced, clearance and price-drop offers from public grocery pages, compared with regular prices. It shows discount depth, duration and which stores and categories are under markdown pressure.
Only where a retailer shows the date publicly on its web page. Many sites do not, and in those cases the field is left blank rather than estimated.
On the public websites we reviewed, these offers are reserved and paid in the app. We do not collect app-only or logged-in data, so we only review public web pages these services publish.
A promotion is usually planned and printed in a weekly ad, such as a BOGO offer. A markdown is often unplanned and store-level, used to clear stock or items near their date.
It depends on category. Fresh and bakery items may need several checks a day, while ambient lines usually need one daily check, always within site rate limits.
It is a useful proxy for surplus pressure, not a direct measure of waste. Pair it with sources such as the UNEP Food Waste Index and ReFED data.
Get a Free Food Data Sample in 48 Hours.
Tell us your platforms, target markets and required fields — we'll map exactly what's possible with food data scraping, recommend the right approach, and send a working sample so you can verify quality before any commitment.
Request a strategy call
Thanks — our data team will reach out within 48 hours with your sample.



