
The Client
The client was a growing grocery retail business managing a broad portfolio of essential food, beverage, household, and personal-care products. With operations across multiple stores and product categories, the company needed a reliable way to understand how prices changed over time and how market inflation affected its pricing decisions.
Before the project, pricing teams relied on fragmented records, making it difficult to compare historical prices, identify recurring increases, and distinguish seasonal changes from sustained inflation. The business therefore required a centralized historical grocery pricing database to consolidate product-level price information and support consistent analysis.
The client adopted a Historical Grocery Pricing Dataset containing product prices, categories, brands, discounts, and monthly observations. This enabled teams to analyze pricing behavior across different periods and product segments.
Through monthly grocery price tracking, the client gained clearer visibility into inflation patterns, competitive movements, and category-level price changes, creating a stronger foundation for pricing strategy, forecasting, and business planning.
Key Challenges
-
Fragmented Historical Pricing Data
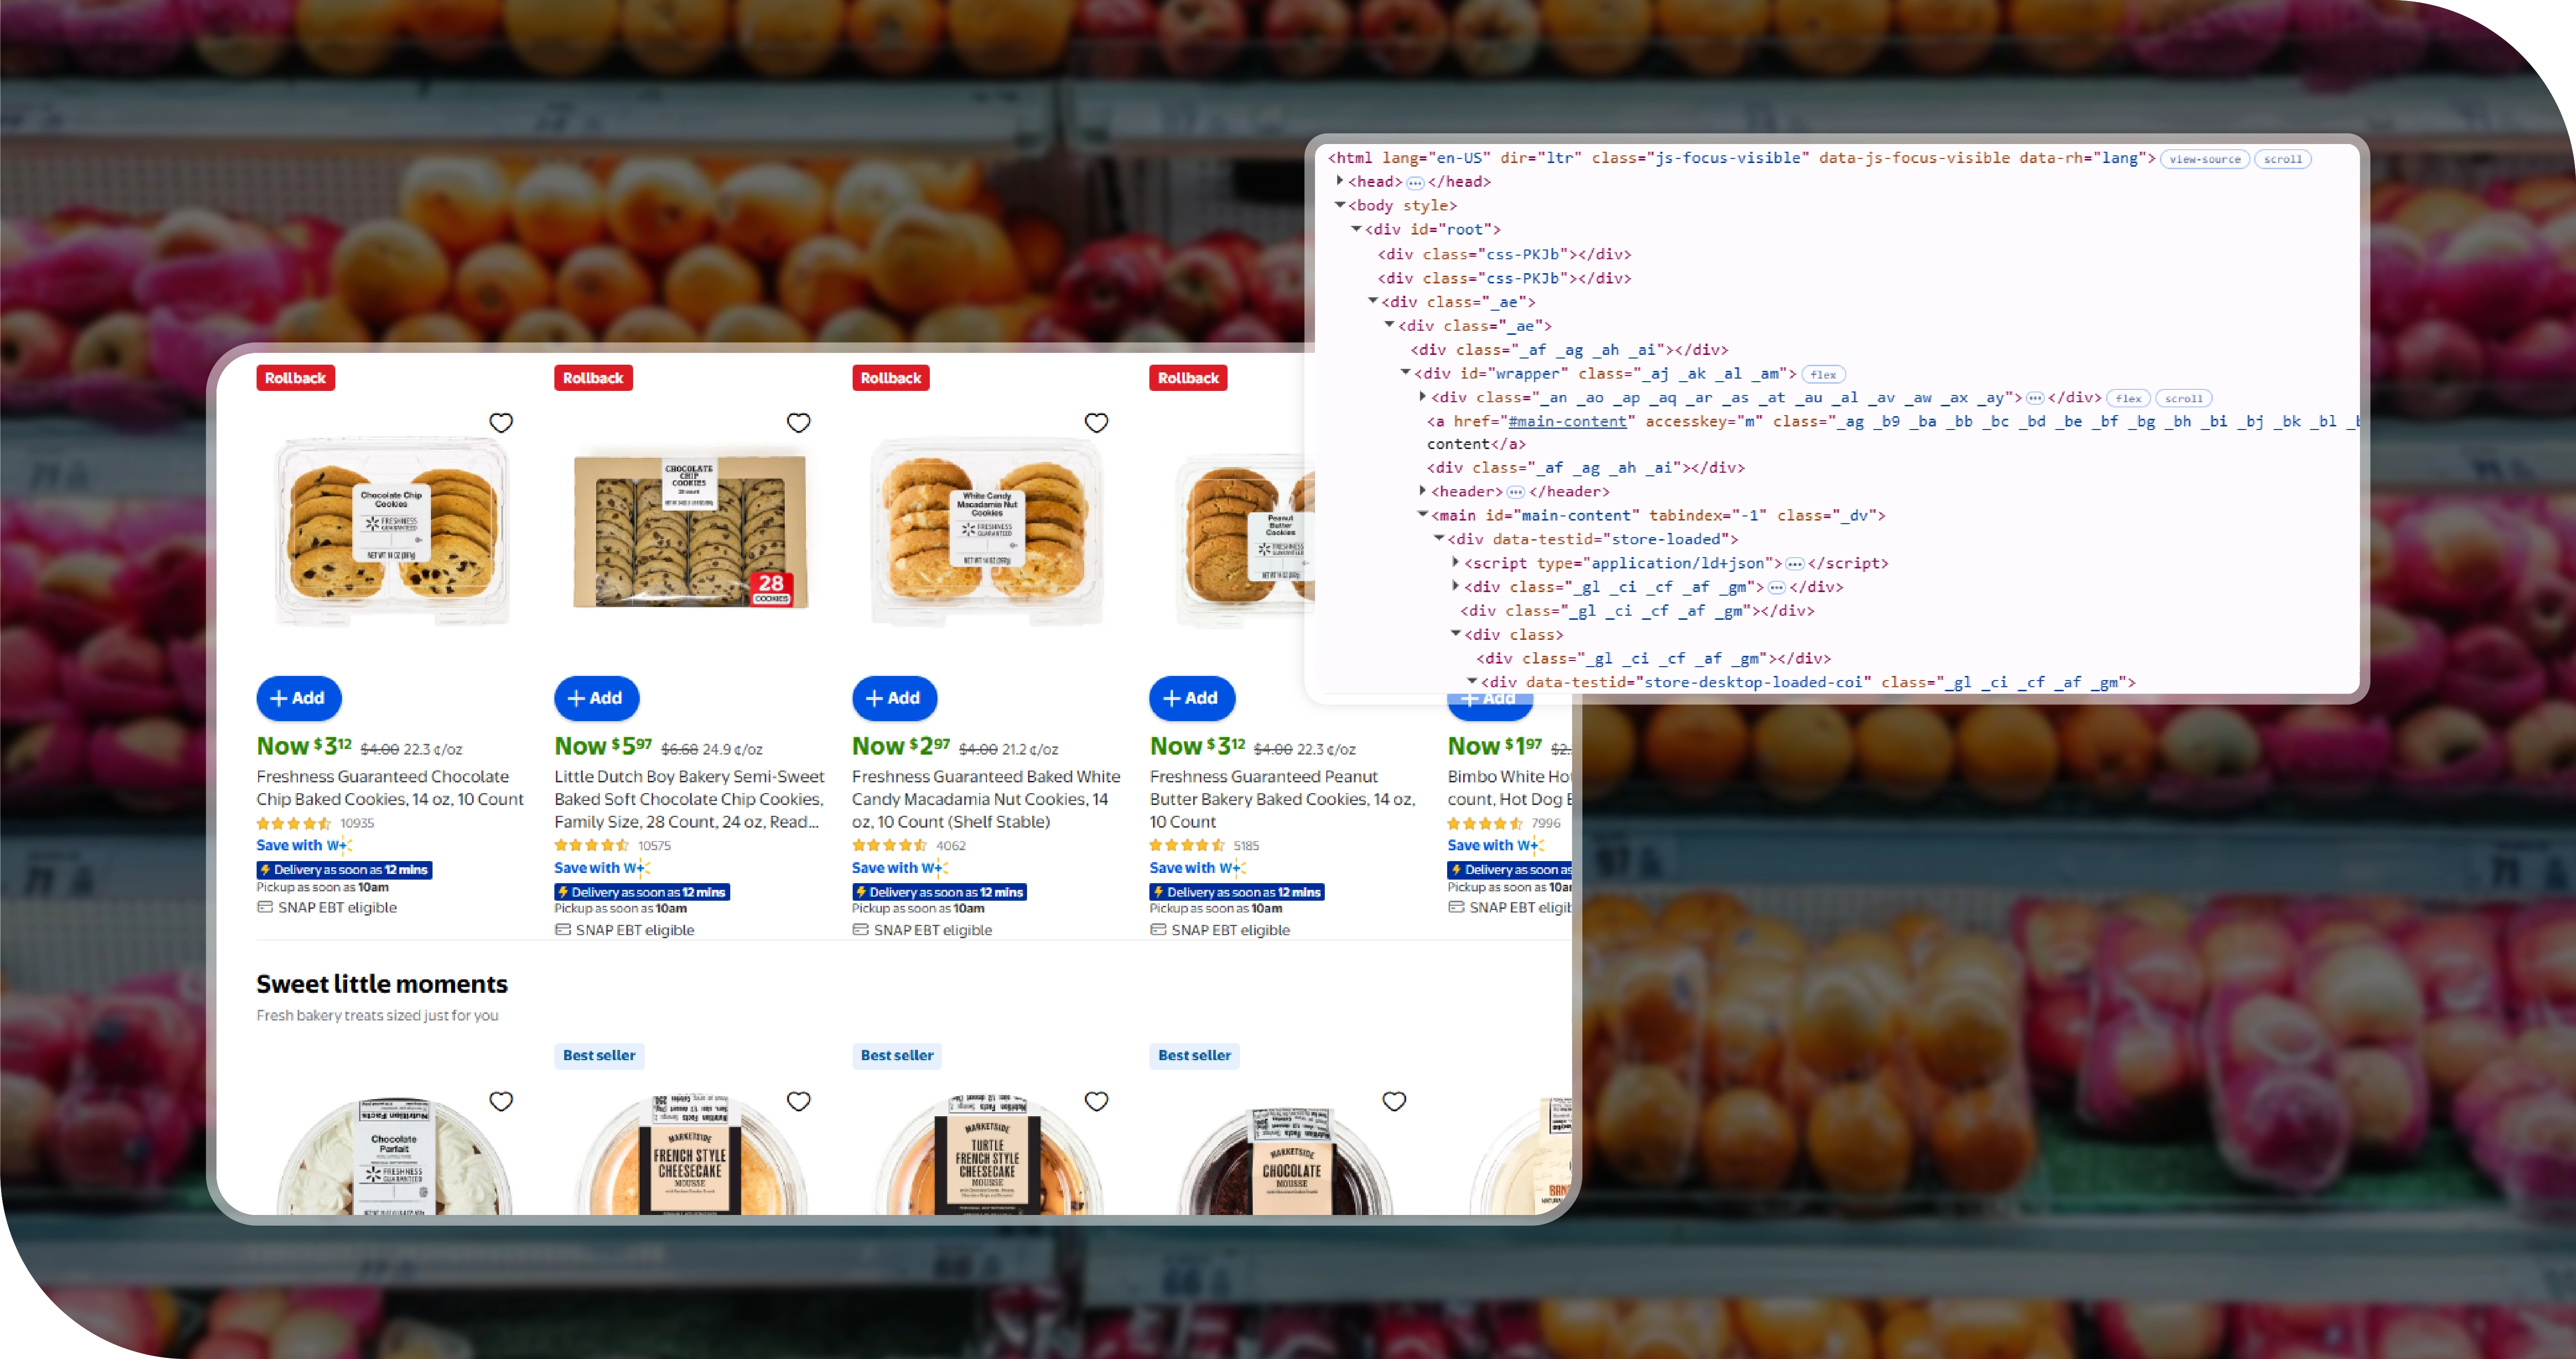
The client struggled with scattered product records across stores, categories, and periods, making supermarket pricing trend analysis difficult. Inconsistent formats and missing historical observations reduced confidence in comparisons and prevented teams from identifying sustained inflation patterns accurately. -
Rapid Price Changes
Grocery prices changed frequently because of promotions, supplier adjustments, seasonal demand, and market conditions. The business needed to Extract Real-Time Grocery Product Prices Data consistently to capture current prices before temporary changes distorted longer-term inflation analysis. -
Limited Pricing Visibility
Decision-makers lacked a centralized system for monitoring thousands of products and comparing price movements efficiently. Without a Grocery Price Monitoring Dashboard, teams spent significant time manually reviewing data, delaying insights and making responsive pricing decisions difficult.
Key Solutions
-
Centralized Price Collection
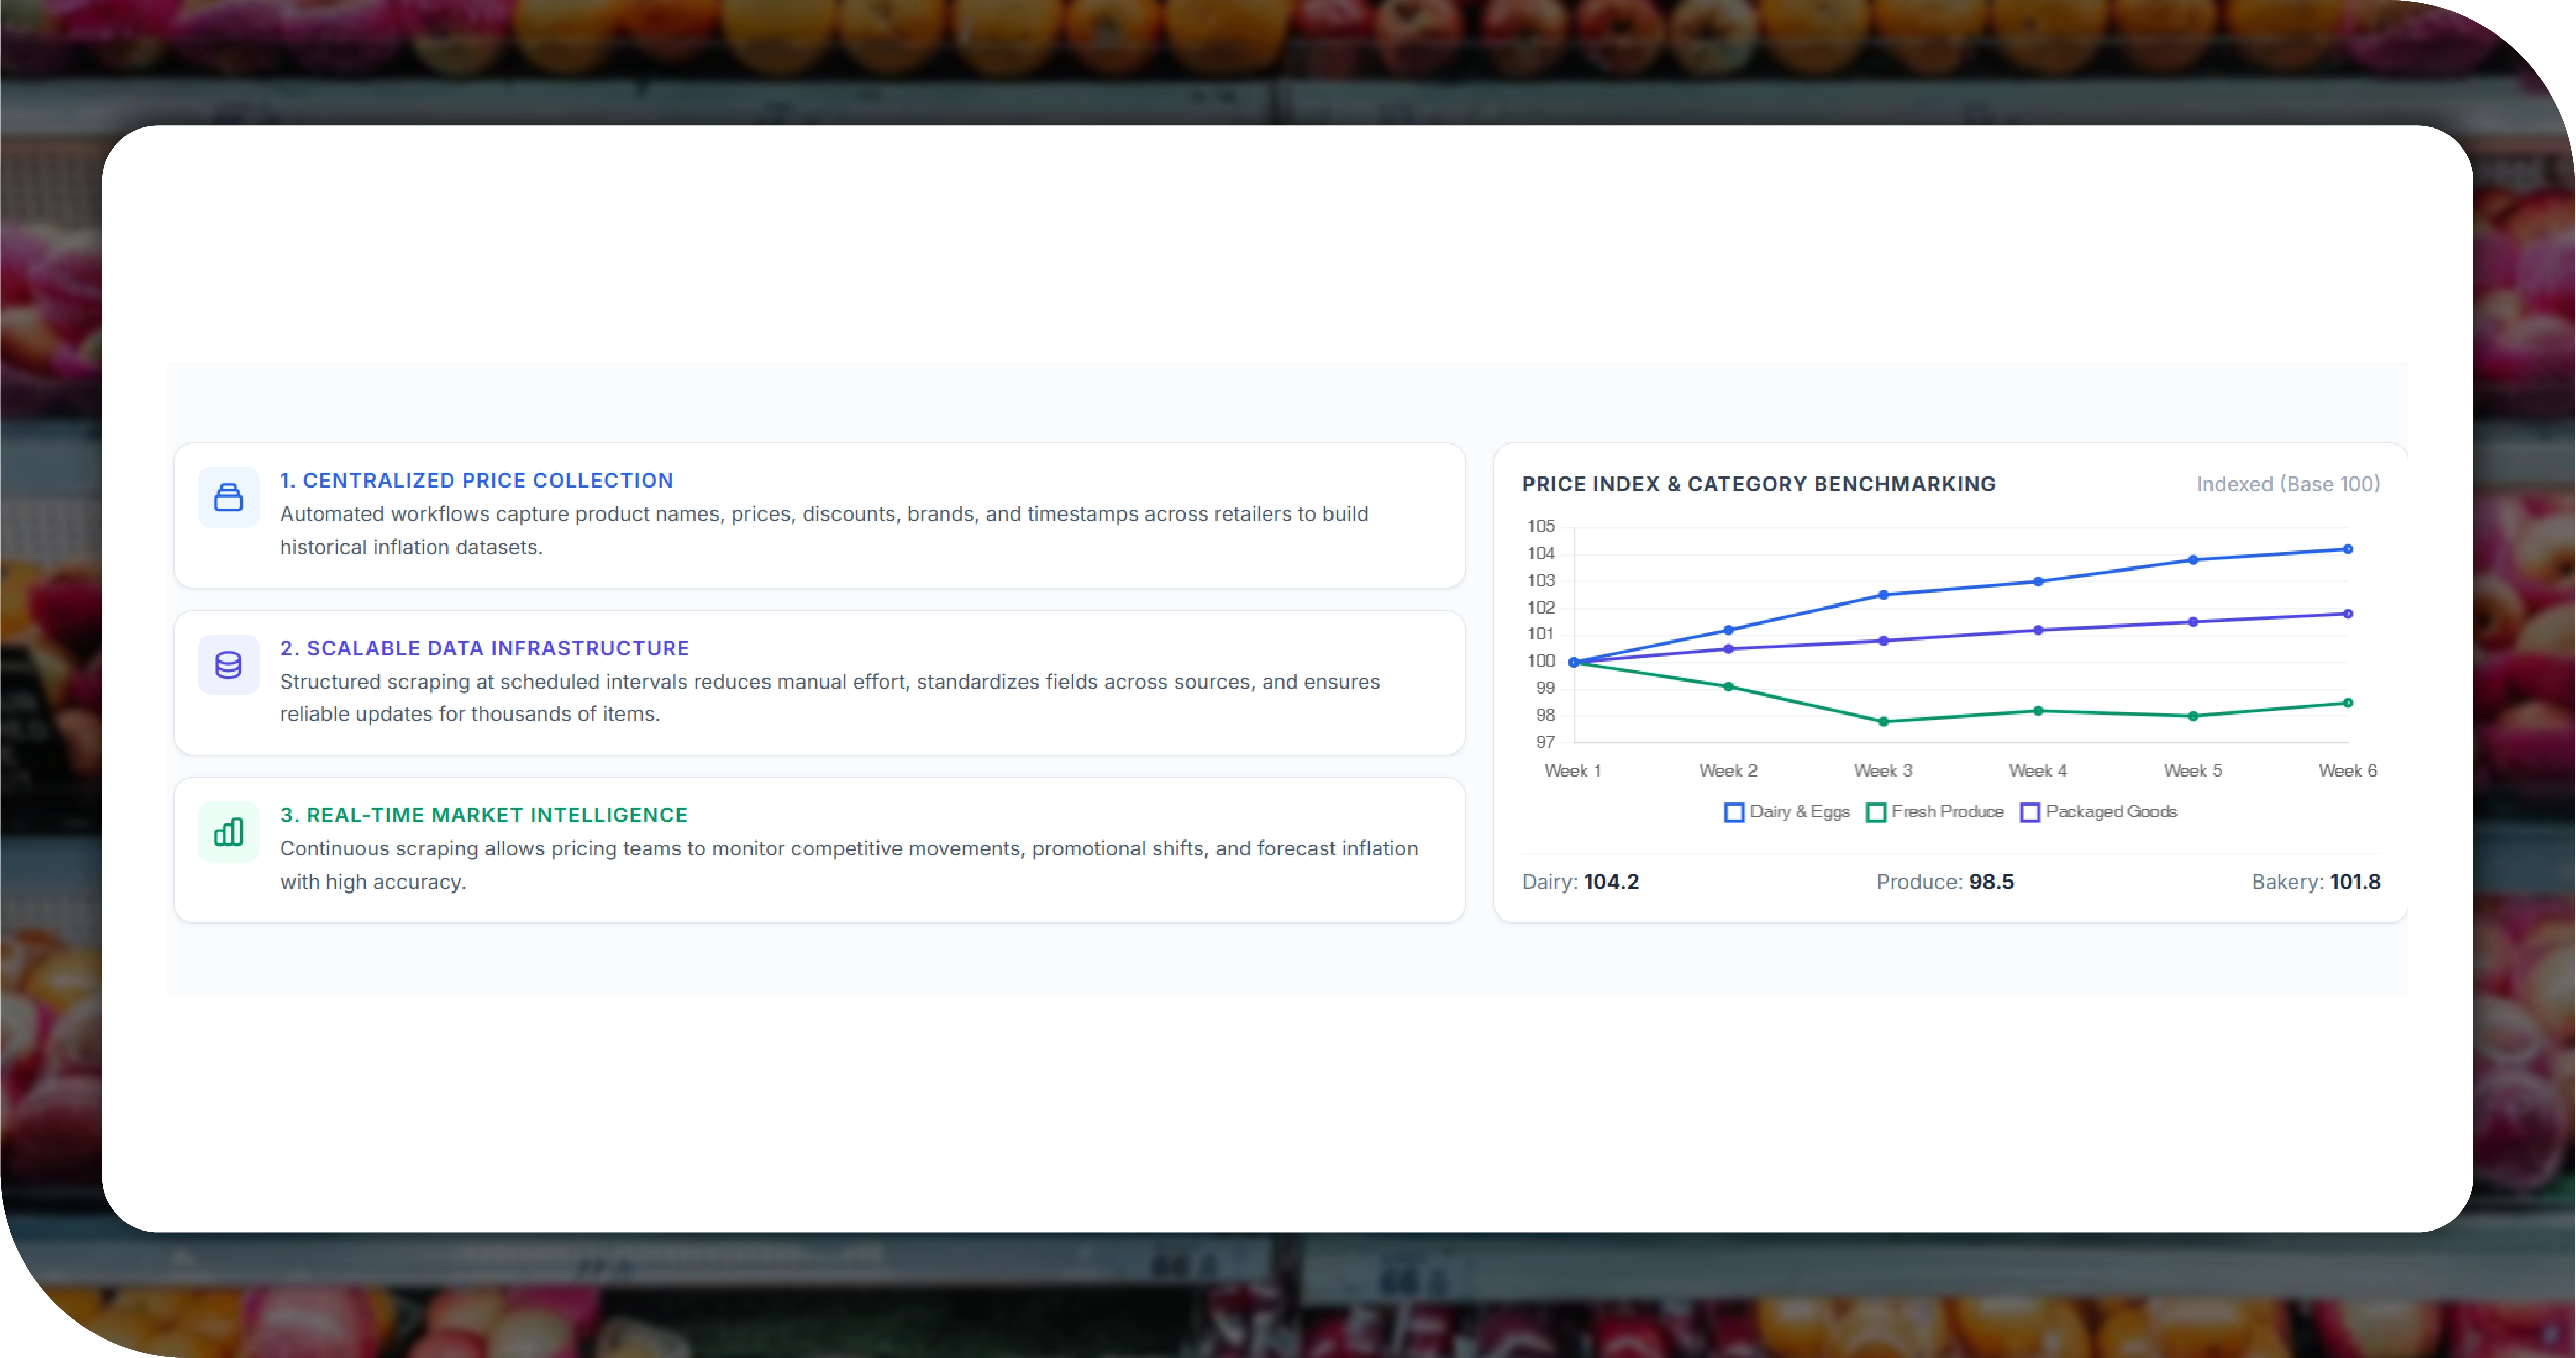
The project implemented automated Scrape Grocery Price Data workflows across selected online retailers, capturing product names, prices, discounts, brands, categories, availability, and timestamps to create a consistent dataset for historical inflation and pricing comparisons. -
Scalable Data Infrastructure
The client deployed Grocery Data Scraping Services to collect structured product information at scheduled intervals. Automated extraction reduced manual collection, standardized fields across sources, and enabled reliable updates for thousands of products across multiple grocery categories and locations. -
Real-Time Market Intelligence
The solution helped Scrape Online Grocery Data continuously, allowing pricing teams to monitor competitive movements, promotional changes, and availability fluctuations. Fresh data supported faster decisions, improved category planning, strengthened price benchmarking, and provided stronger inputs for inflation forecasting.
Scraped Grocery Data — Illustrative Dataset
| Month | Products Scraped | Categories | Retailers | Avg. Price ($) | Discounted Products | Avg. Discount (%) | Out-of-Stock (%) | Price Changes | New Products | Brands Tracked | Stores/Locations |
|---|---|---|---|---|---|---|---|---|---|---|---|
| January | 12,480 | 86 | 8 | 7.42 | 2,184 | 11.6 | 5.2 | 1,438 | 312 | 1,426 | 64 |
| February | 12,735 | 87 | 8 | 7.55 | 2,306 | 12.1 | 5.7 | 1,526 | 341 | 1,451 | 66 |
| March | 13,120 | 89 | 9 | 7.68 | 2,418 | 11.8 | 6.1 | 1,672 | 384 | 1,493 | 70 |
| April | 13,486 | 90 | 9 | 7.81 | 2,537 | 12.4 | 5.9 | 1,748 | 401 | 1,528 | 72 |
| May | 13,842 | 92 | 9 | 7.96 | 2,684 | 13.2 | 6.4 | 1,835 | 427 | 1,574 | 75 |
| June | 14,205 | 94 | 10 | 8.13 | 2,791 | 13.7 | 6.8 | 1,964 | 463 | 1,621 | 79 |
| July | 14,638 | 95 | 10 | 8.29 | 2,925 | 14.1 | 6.5 | 2,086 | 492 | 1,668 | 82 |
| August | 15,024 | 97 | 10 | 8.44 | 3,018 | 14.6 | 7.0 | 2,174 | 518 | 1,712 | 85 |
| September | 15,387 | 98 | 11 | 8.57 | 3,146 | 14.2 | 6.7 | 2,268 | 547 | 1,758 | 89 |
| October | 15,762 | 100 | 11 | 8.73 | 3,284 | 15.0 | 6.3 | 2,391 | 576 | 1,806 | 92 |
| November | 16,148 | 102 | 11 | 8.91 | 3,467 | 16.3 | 6.9 | 2,528 | 614 | 1,853 | 95 |
| December | 16,584 | 104 | 12 | 9.08 | 3,692 | 17.1 | 7.4 | 2,684 | 658 | 1,912 | 99 |
Methodologies Used
-
Multi-Source Acquisition
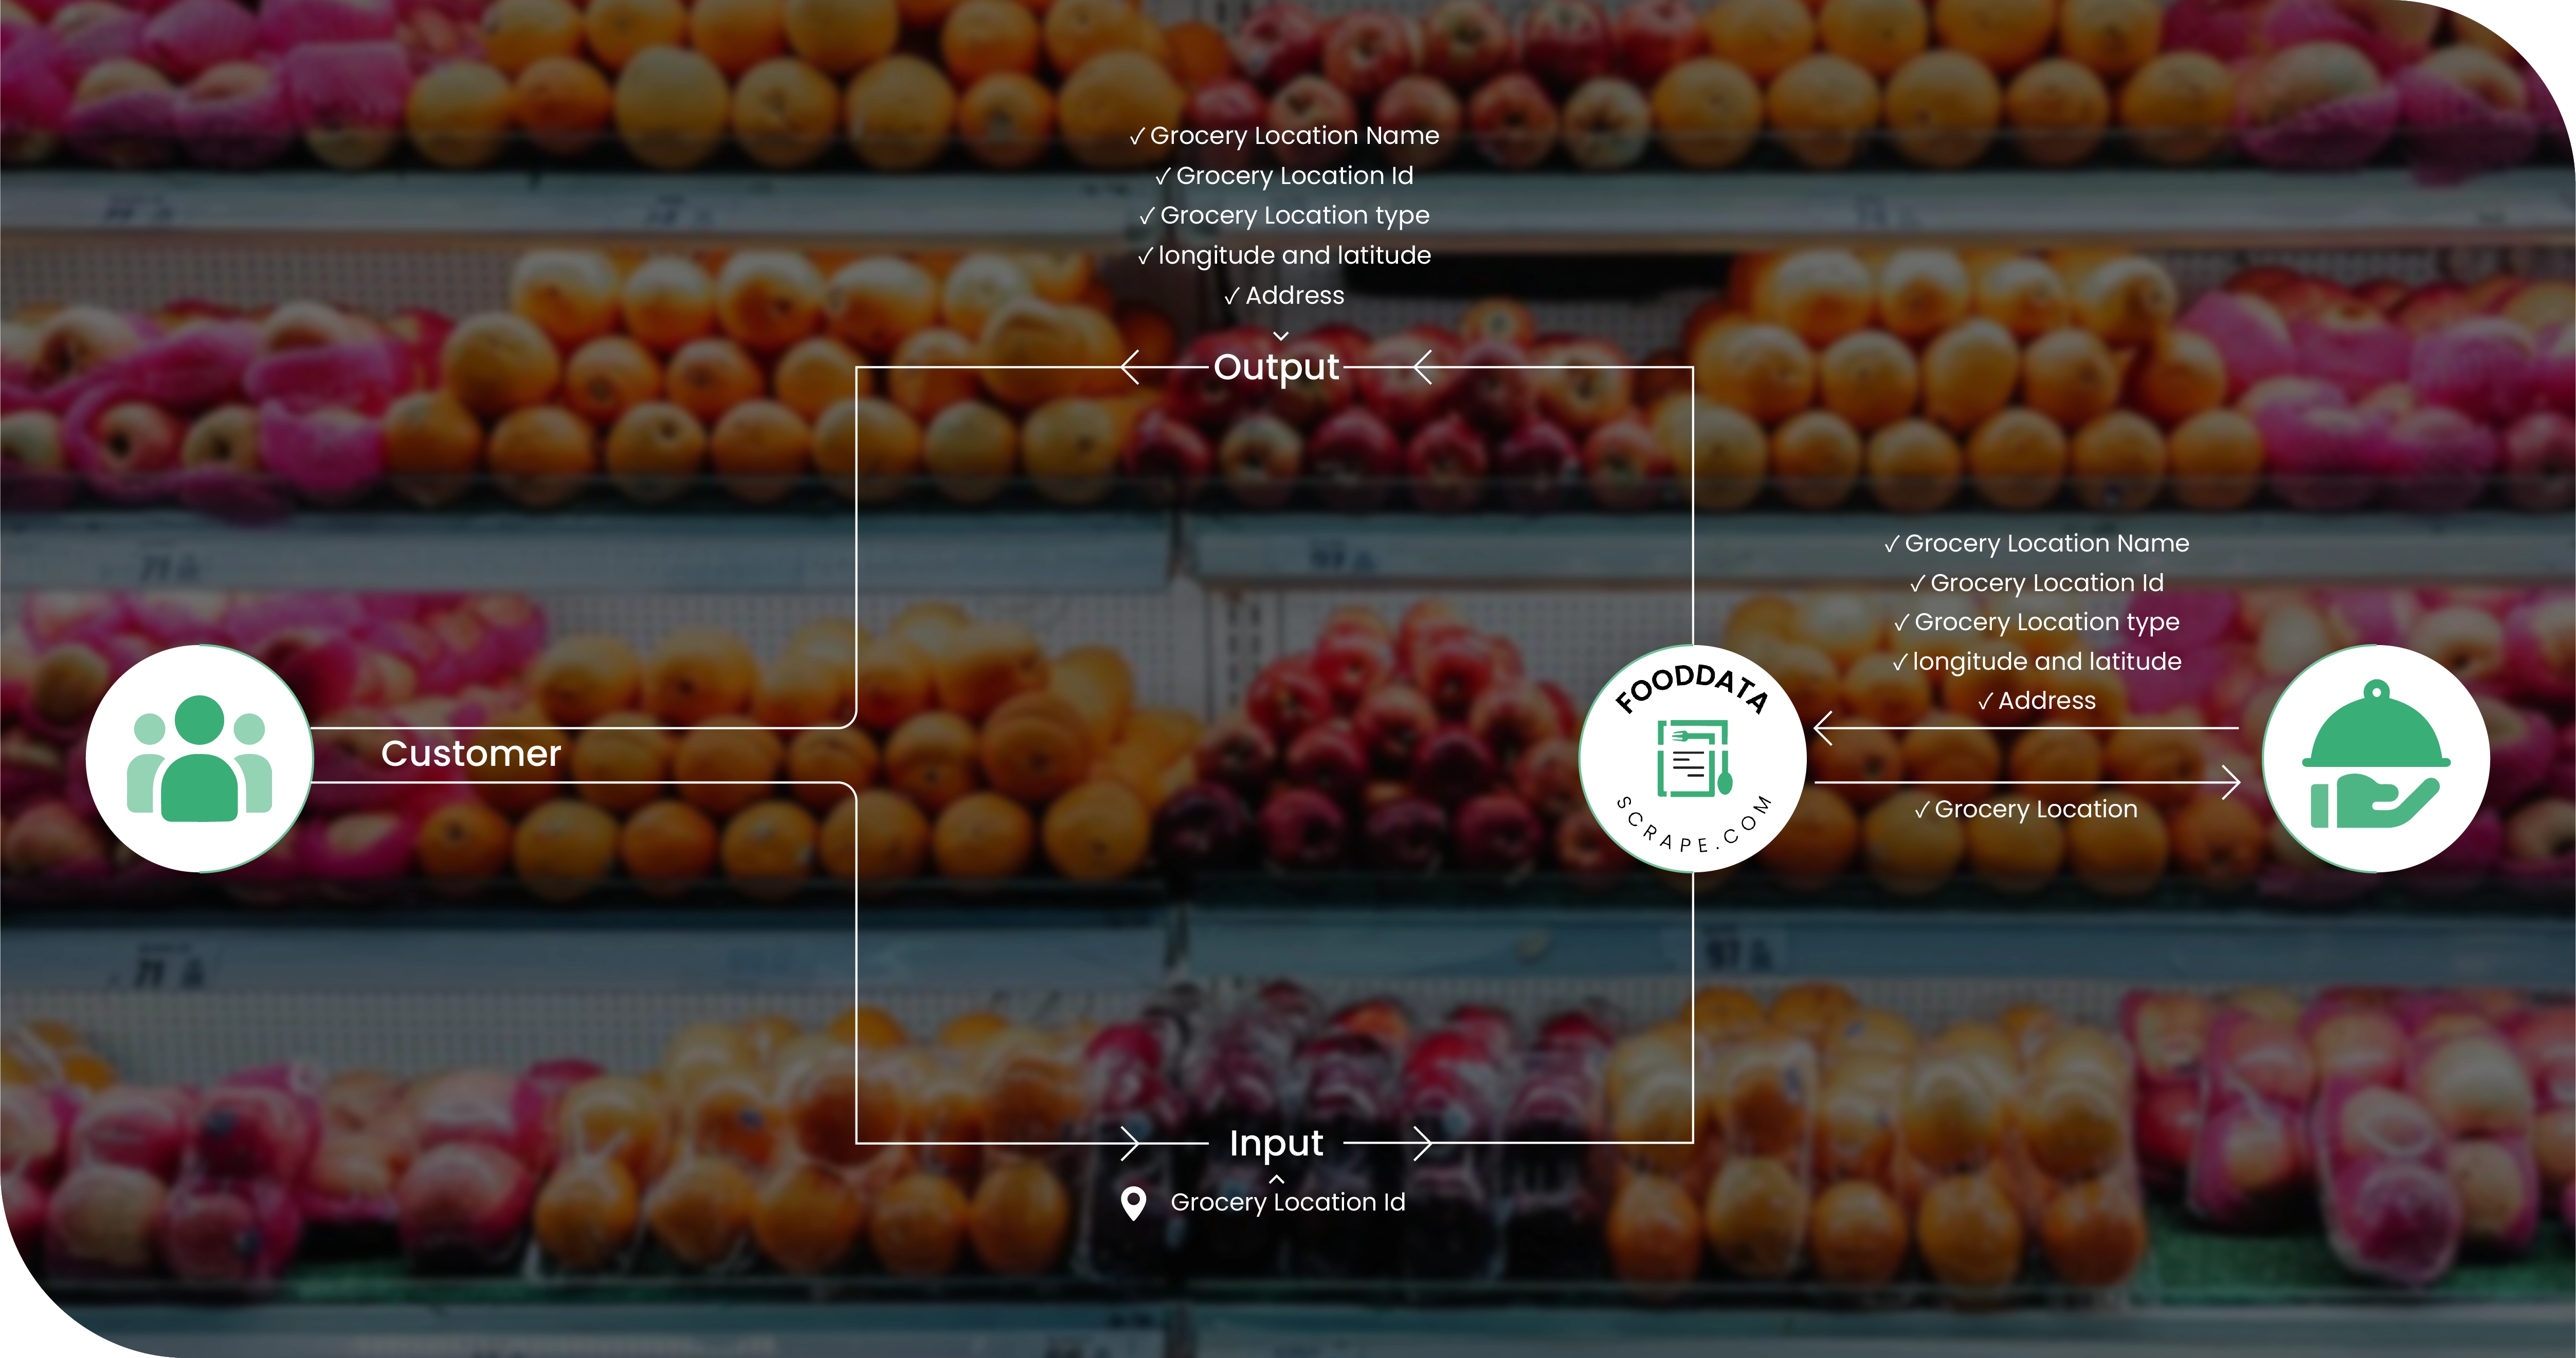
Data was gathered from diverse grocery websites and digital storefronts using scheduled extraction processes. Multiple sources helped create broader market coverage while capturing product-level pricing, promotional activity, stock status, pack information, brand details, and category attributes for comprehensive comparison. -
Data Normalization
Raw records were cleaned and converted into consistent formats for product names, currencies, units, quantities, categories, and pricing fields. Normalization made information from different retailers directly comparable and minimized inconsistencies caused by varying website structures or measurement formats. -
Temporal Comparison
Each product observation was associated with its collection date, enabling chronological analysis across twelve months. Historical snapshots were compared systematically to measure price increases, decreases, promotional fluctuations, seasonal movements, and sustained changes across individual products and broader categories. -
Anomaly Detection
Automated quality checks identified unexpected price spikes, sudden reductions, duplicate records, missing values, discontinued products, and unusual availability changes. Flagged records were reviewed against surrounding observations to separate genuine market movements from temporary anomalies or extraction inconsistencies. -
Analytical Segmentation
The processed dataset was segmented by retailer, category, brand, product type, pack size, and pricing behavior. This approach enabled deeper comparisons between product groups, highlighted inflation-sensitive segments, revealed competitive differences, and supported more targeted commercial decision-making.
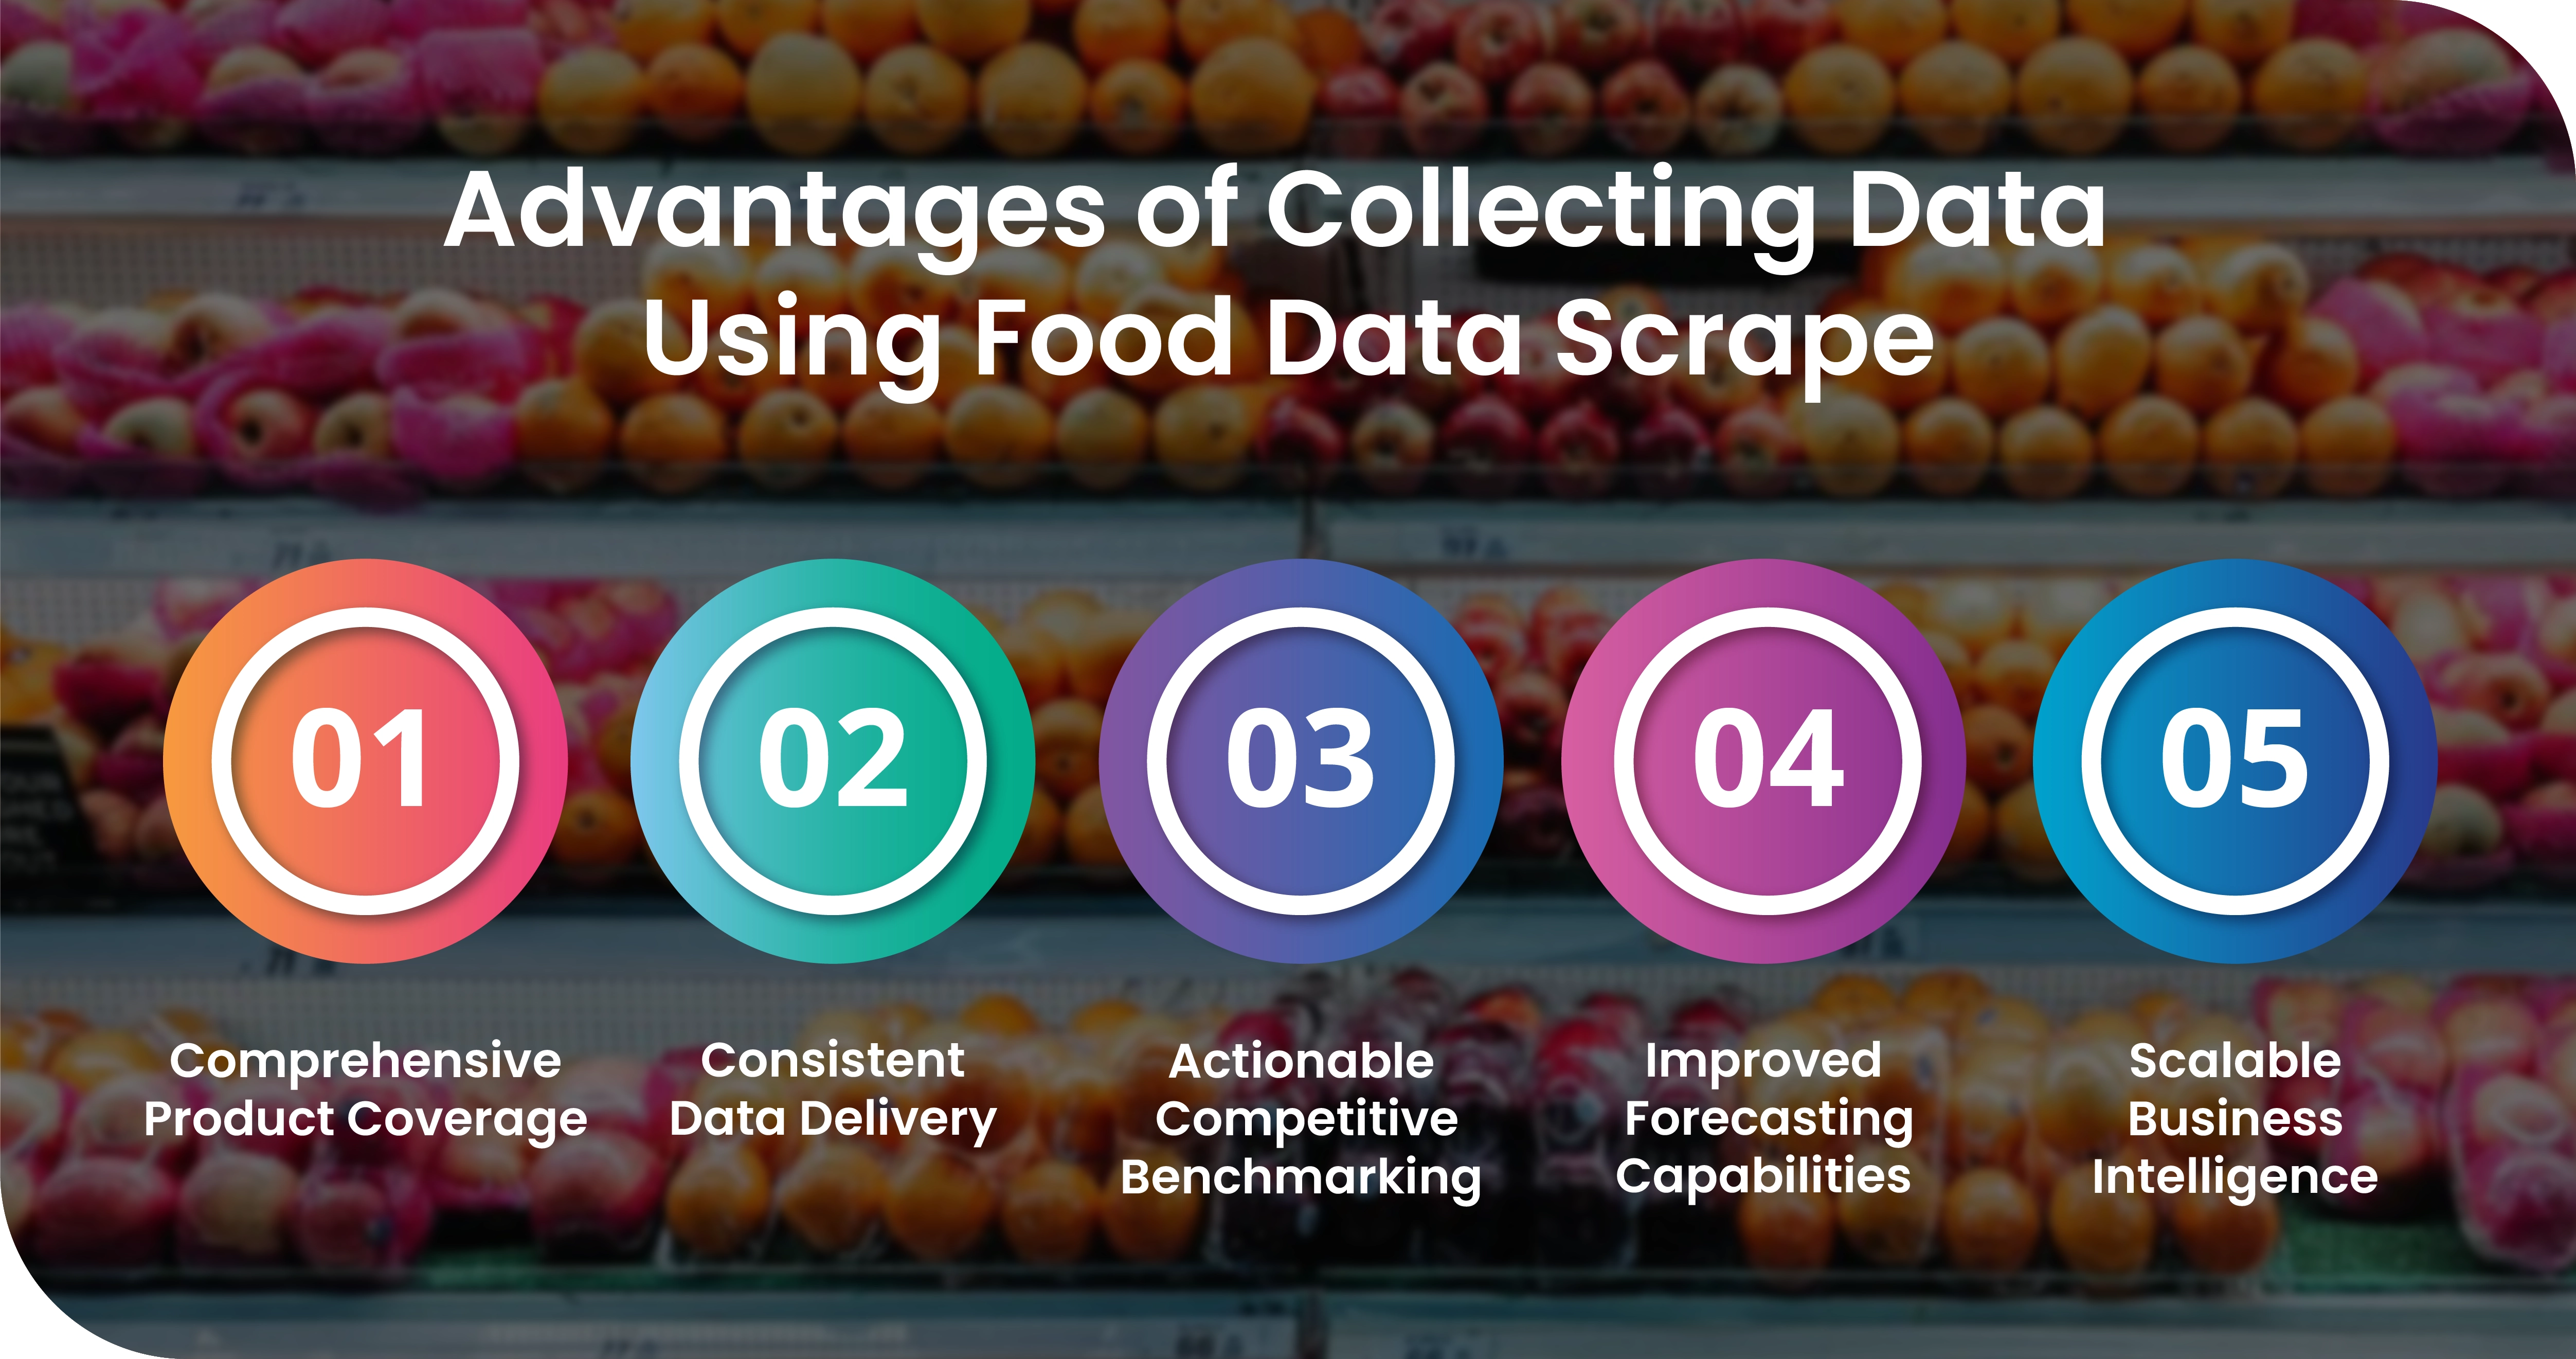
Advantages of Collecting Data Using Food Data Scrape
-
Comprehensive Product Coverage
Our services capture extensive product information across grocery categories, brands, retailers, and locations. This broad coverage helps businesses build a detailed market view, compare assortment changes, identify emerging products, and understand how pricing behavior differs across competing retail environments. -
Consistent Data Delivery
Automated extraction delivers information according to defined schedules and structured formats. Businesses receive standardized datasets that are easier to integrate into analytical systems, reporting workflows, and internal databases, reducing inconsistencies that commonly occur with manually collected information. -
Actionable Competitive Benchmarking
Collected records enable retailers to benchmark their prices against competing businesses across comparable products and pack sizes. These comparisons reveal pricing gaps, promotional differences, category-level movements, and opportunities to refine positioning without depending solely on internal historical records. -
Improved Forecasting Capabilities
Longitudinal datasets provide valuable inputs for forecasting future pricing and demand conditions. Analysts can study historical movements, seasonal behavior, promotional cycles, and category fluctuations to develop more informed projections and prepare commercial strategies around anticipated market changes. -
Scalable Business Intelligence
Our scraping infrastructure can expand as product catalogs, retailers, locations, and monitoring requirements grow. This scalability allows organizations to increase coverage without proportionally increasing manual research resources, supporting larger analytical initiatives while maintaining structured, repeatable, and manageable data workflows.
Client's Testimonial
"Working with the data scraping team transformed how we manage grocery pricing intelligence. Previously, our analysts spent significant time collecting and organizing product information from different sources, which made historical comparisons slow and inconsistent. The structured data gave us a clear view of monthly price movements, promotional changes, product availability, and competitive pricing patterns. Our teams can now identify inflation trends much faster and make more confident pricing decisions. The consistency and scalability of the data have also improved our reporting and forecasting workflows. This solution has become an important part of our ongoing market intelligence strategy."
—Head of Pricing & Market Intelligence
Final Outcome
The project delivered a structured, reliable, and analysis-ready grocery pricing dataset covering twelve months of market activity. The client gained centralized visibility into product prices, discounts, availability, brands, categories, and retailer-level movements, replacing fragmented records with consistent historical intelligence. Automated data collection reduced manual research efforts while improving the frequency and accuracy of updates. Pricing teams could identify inflation-sensitive categories, monitor competitive changes, recognize seasonal fluctuations, and distinguish temporary promotions from sustained price increases. The resulting insights supported better pricing decisions, stronger forecasting, improved promotional planning, and more effective category management. Management also gained a clearer understanding of how grocery prices evolved throughout the year, enabling faster responses to market conditions. Overall, the solution transformed raw product information into practical intelligence that strengthened pricing strategy and long-term commercial planning.



