
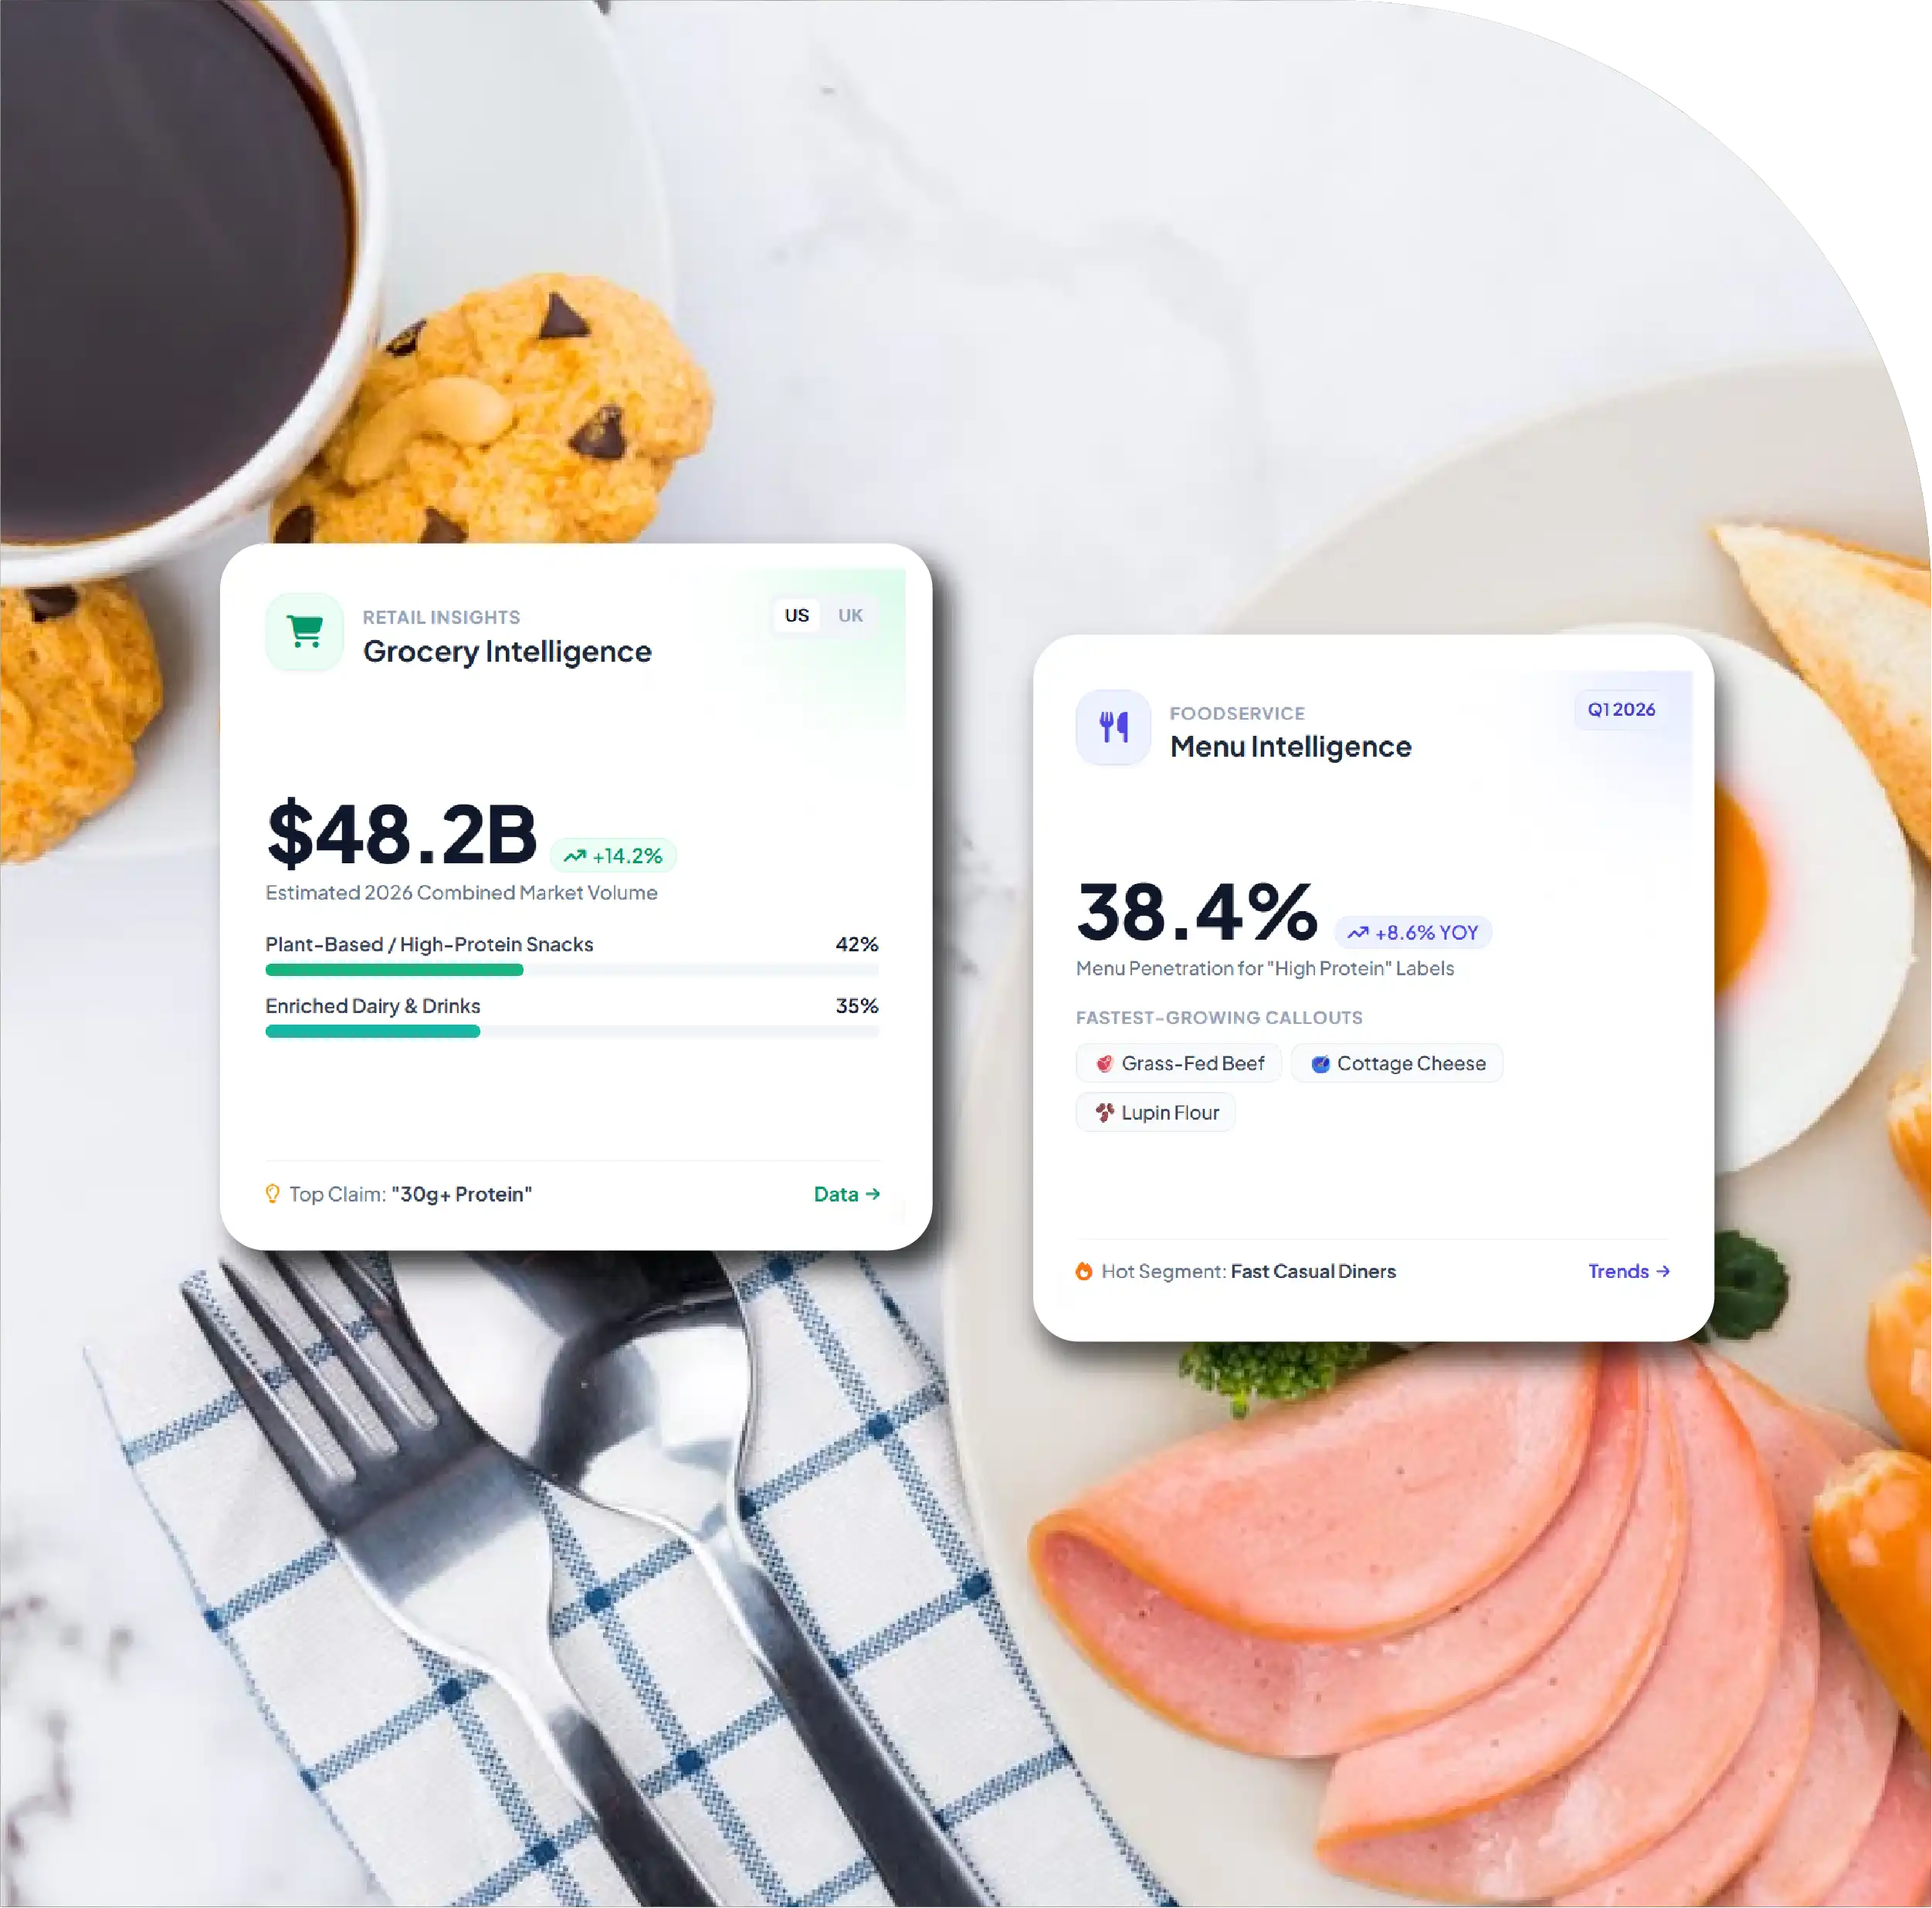
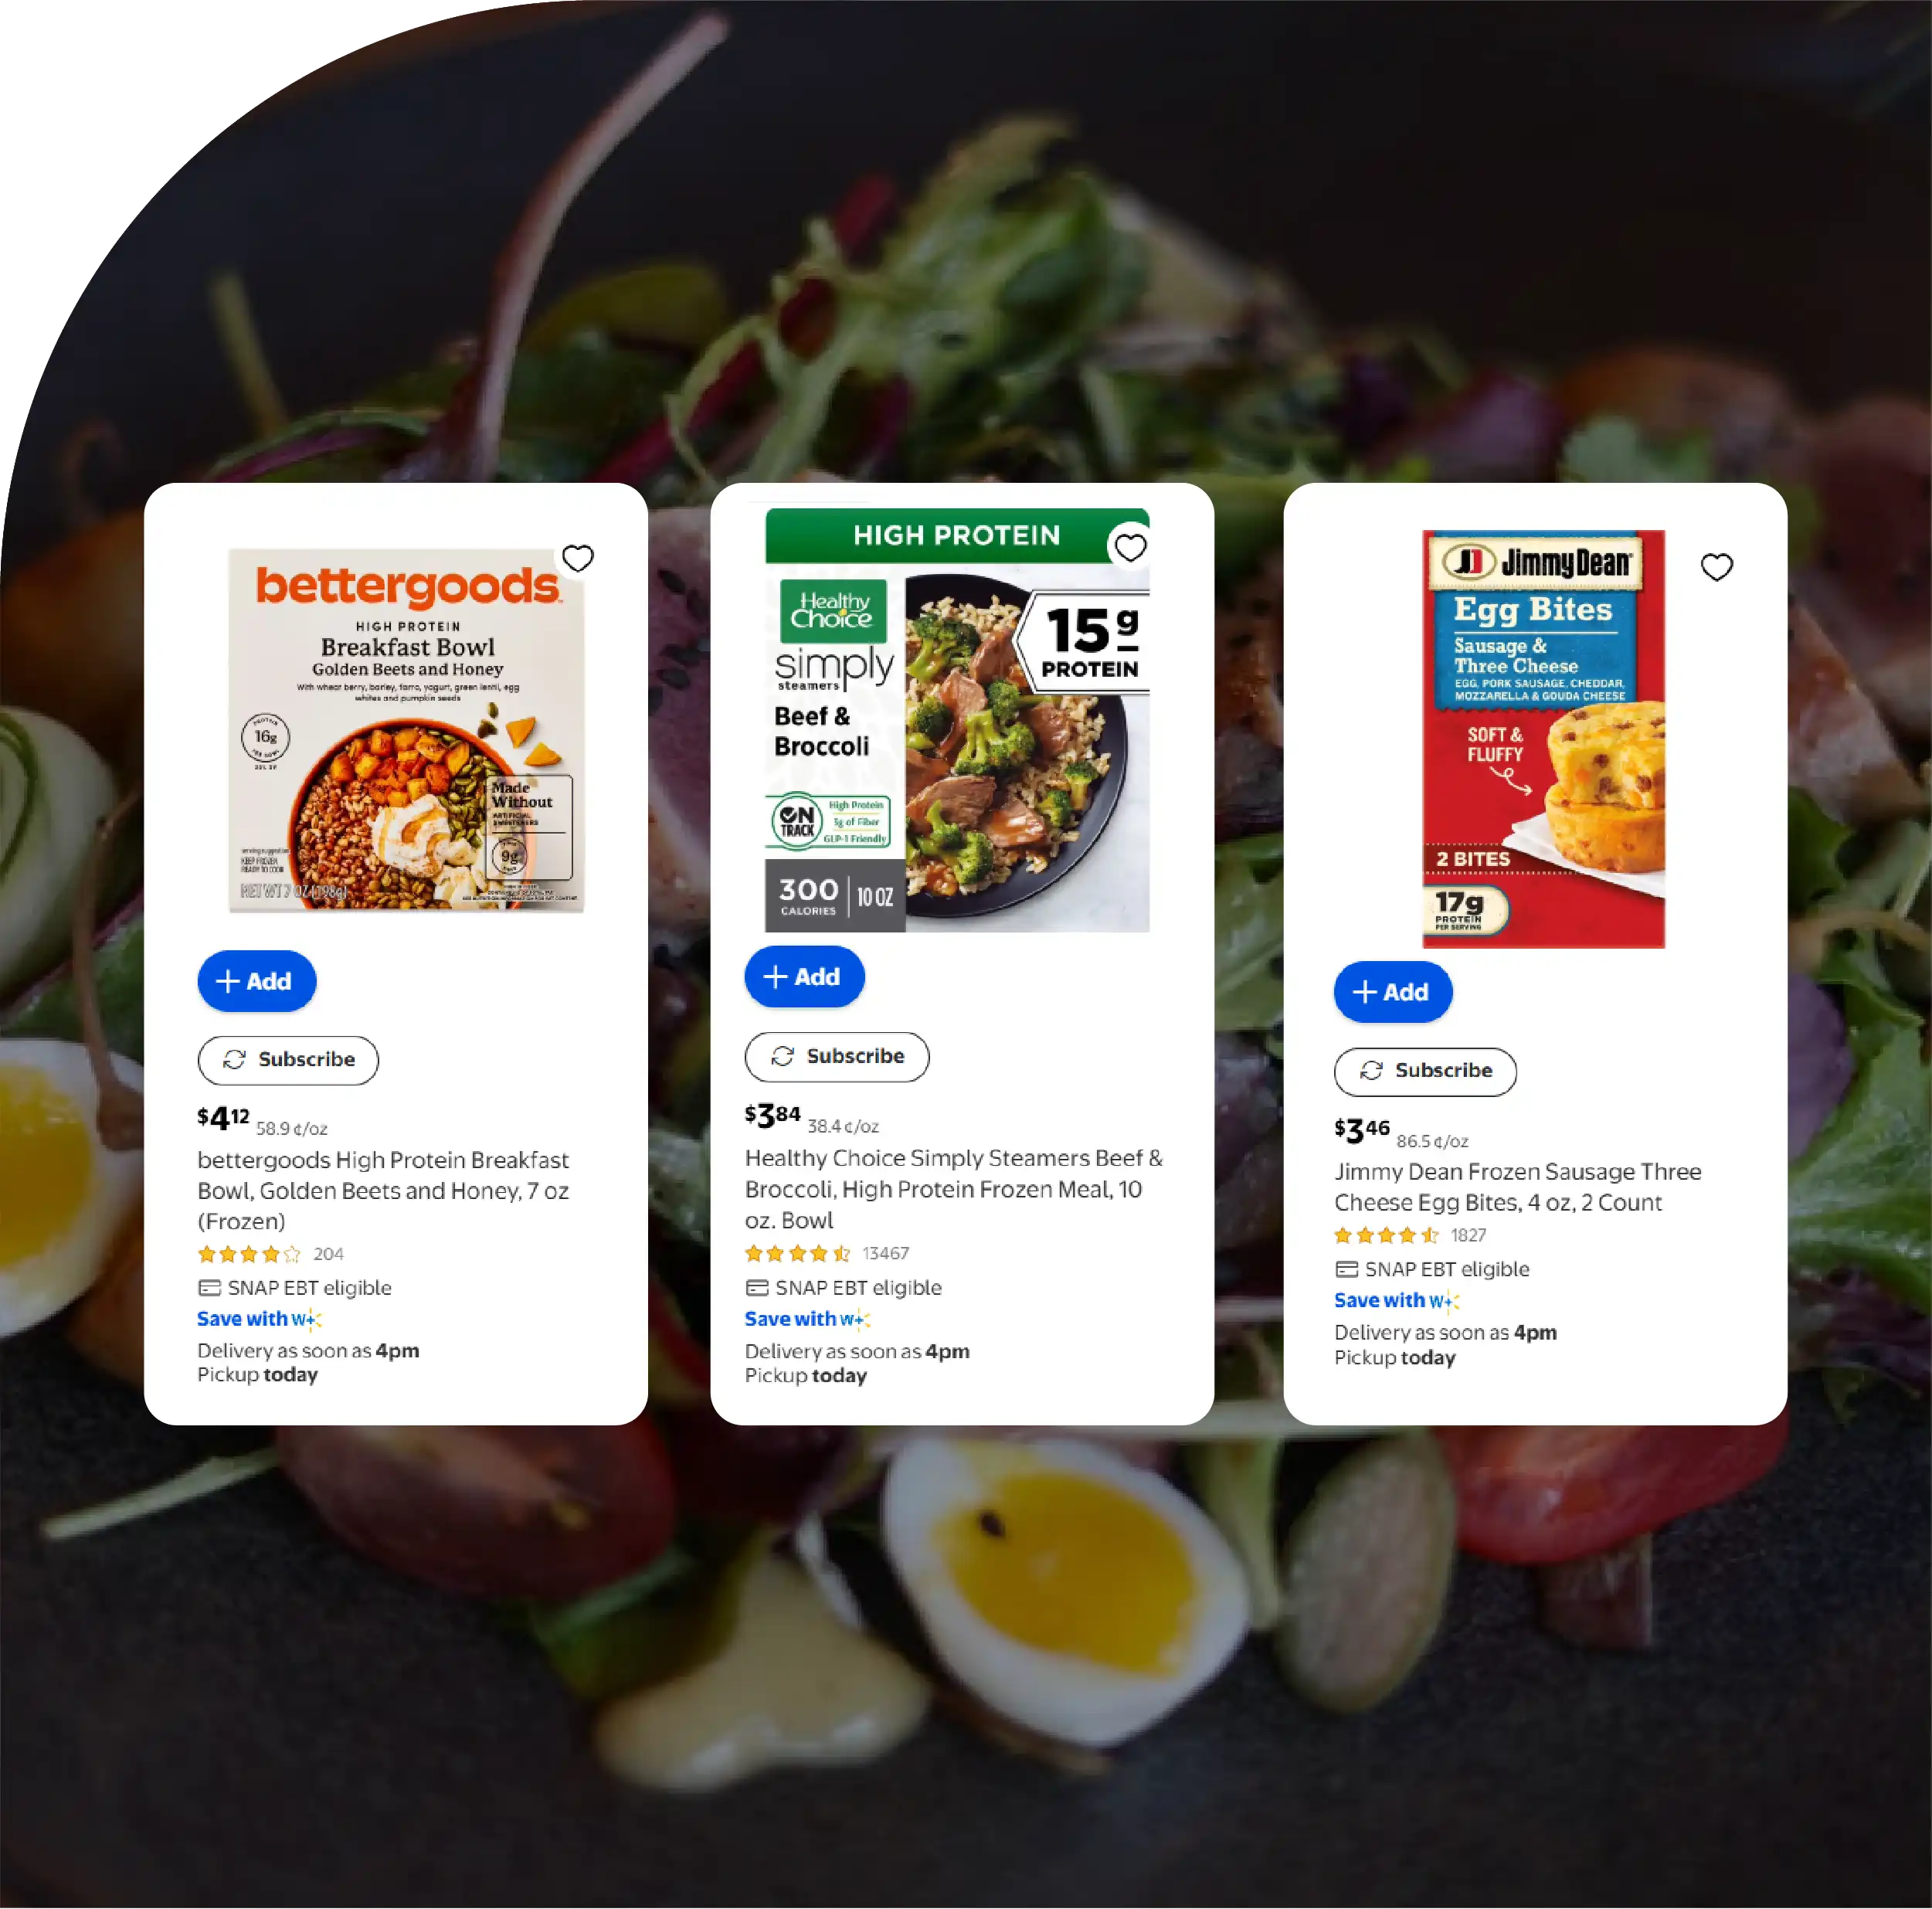
Market Growth: Global high-protein food, drinks, and supplements retail sales exceeded USD 3 trillion in 2025.
Consumer Demand: 71% of Americans reported trying to consume protein in 2025.
Market Coverage: Report covers US and UK grocery retailers, delivery platforms, and restaurant menus.
Protein Claims: Analysis compares US FDA labeling criteria with UK high-protein claim regulations.
Price Intelligence: Tracks price per gram of protein, promotional offers, and high-protein product premiums.
Data Attributes: Records include protein content, calories, pack sizes, product claims, prices, availability, and promotions.

High-protein food market data is the structured record of which protein-claim products are sold, at what price, with what nutrition, and where they appear on grocery sites and restaurant menus. In 2026 it matters because demand is rising faster than shoppers' understanding, so brands and retailers need shelf-level evidence rather than headline trends.
The headline numbers are big. Euromonitor International says retail sales of high-protein food, drinks and supplements passed USD 3 trillion in 2025, and it projects global protein demand to grow 11% between 2024 and 2029 (Euromonitor, July 2026).
This report pulls together what public, primary-led sources say about the US and UK, explains the rules behind a 'high protein' claim in each country, and shows which data fields teams use to turn that noise into price, assortment and menu intelligence. Where a number needs our own scraped dataset, we show a clear placeholder instead of an estimate.
Protein used to live in the sports-nutrition aisle. Today it sits on yoghurt, bread, cereal, ready meals, coffee drinks and fast-casual bowls. Survey data tracks that move year after year.
In the US, the share of Americans trying to consume protein rose from 59% in 2022 to 67% in 2023 and 71% in 2025, according to the IFIC Food & Health Survey. Circana's 2026 eating-behaviour research, reported by NACS, found 48% of adults want more protein, up 7 points on the year before (NACS / Circana, August 2026).
The UK picture is more uneven. Mintel data quoted by FoodNavigator shows the share of UK food and soft-drink launches carrying a 'high protein' claim was 8% in 2019, fell to 5% in 2023 and recovered to 7% in 2024 (FoodNavigator / Mintel, March 2025). That dip and rebound is exactly why live shelf tracking beats annual snapshots.
| Year | Sourced metric | Value | Source |
|---|---|---|---|
| 2019 | UK launches with a 'high protein' claim | 8% | Mintel via FoodNavigator |
| 2022 | Americans trying to consume protein | 59% | IFIC |
| 2023 | Americans trying to consume protein | 67% | IFIC |
| 2023 | UK launches with a 'high protein' claim | 5% | Mintel via FoodNavigator |
| 2023 | US consumers rating protein intake important | 38% | Datassential via US Foods |
| 2024 | UK launches with a 'high protein' claim | 7% | Mintel via FoodNavigator |
| 2025 | Americans trying to consume protein | 71% | IFIC |
| 2025 | US consumers rating protein intake important | 52% | Datassential via US Foods |
| 2025 | Global high-protein retail sales | Over USD 3 trillion | Euromonitor |
| 2026 | US adults wanting more protein | 48% | Circana via NACS |
Note that these rows come from different surveys with different samples. Read them as direction of travel, not as one continuous series.
Any high-protein dataset is only as good as its definition. The US and UK use different tests, so the same product can qualify in one market and not the other.
In the US, the FDA Daily Value for protein is 50 g, and the agency's label guide says 20% DV or more per serving counts as high (FDA). That puts the practical bar at about 10 g of protein per serving.
In Great Britain, retained Regulation (EC) No 1924/2006 allows a 'high protein' claim only when at least 20% of the food's energy comes from protein, and 'source of protein' at 12% (legislation.gov.uk). That is an energy-share test, not a grams-per-serving test.
| Rule | United States | United Kingdom (GB) |
|---|---|---|
| Reference value | Protein Daily Value 50 g (FDA) | No single DV used for the claim test |
| 'High' threshold | 20% DV or more per serving (about 10 g) | At least 20% of energy from protein |
| Lower claim | 'Good source' claim (lower %DV band) | 'Source of protein' (at least 12% of energy) |
| Basis | Per serving / reference amount | Share of total energy |
| Data field needed | protein_g_per_serving, serving_size | protein_g_per_100g, energy_kcal_per_100g |
For data teams, the practical step is to capture both per-serving and per-100 g nutrition, then compute a flag for each market. A claim printed on the pack and a claim that passes the rule are two separate fields.
Context also changed in 2026. The new Dietary Guidelines for Americans 2025–2030 tell people to prioritise protein at every meal, aiming for 1.2 to 1.6 g per kg of body weight daily (AAFP summary, July 2026). Expect more US packs and menus to lean on that message.
Reliable high-protein food market data starts with product pages on retailer sites and delivery apps. In the US that usually means Walmart, Target, Kroger and Amazon Fresh plus Instacart storefronts. In the UK it means Tesco, Sainsbury's, Asda, Ocado and the grocery tabs on Deliveroo and Uber Eats.
Each product page exposes public fields: name, brand, pack size, price, promotion, nutrition panel, ingredients, allergens and claim text. Capturing them on a fixed cadence turns a static shelf into a time series.
| Field | What it captures | Why it matters |
|---|---|---|
| product_id / gtin_on_page | Retailer ID and any barcode shown on the page | Matching the same item across retailers |
| claim_text | 'High protein', '20 g protein', 'source of protein' | Measuring claim spread by category |
| protein_g_per_serving | Grams of protein per stated serving | US 20% DV test and shopper comparison |
| protein_g_per_100g | Grams of protein per 100 g or 100 ml | UK energy-share test and fair comparison |
| energy_kcal_per_100g | Calories per 100 g | Computing protein share of energy |
| price / unit_price | Shelf price and price per kg or litre | Deriving price per gram of protein |
| promo_flag | Multibuy, rollback, loyalty price | Separating base price from deals |
| category_path | Breadcrumb such as Dairy > Yoghurt | Category share of protein claims |
| availability | In stock, out of stock, delisted | Distribution and stock-out tracking |
Our grocery product nutritional data service collects these fields from public pages, and the Tesco grocery data API covers the UK's largest grocer. We follow robots.txt, site terms and polite rate limits.
Protein carries a price premium. Euromonitor puts the average mark-up for high-protein ready meals at 66% in 2024 (Euromonitor). The question for buyers is whether shoppers get proportionally more protein for that money.
The cleanest answer is price per gram of protein: shelf price divided by total grams of protein in the pack. It lets you compare a protein yoghurt with a standard one, or a Tesco own-label bar with a Walmart branded bar, on the same basis.
IFIC found 59% of Americans weigh price when choosing a protein source, second only to taste at 66% (IFIC). So price-per-gram is not just an analyst metric; it is how value-seeking shoppers think.
Spot check, 14 October 2026: regular online shelf prices from Kroger.com (one Ohio store, pickup) for the US and Tesco.com for the UK, excluding sale and loyalty prices. Protein per pack comes from each product's nutrition panel. This is a single-store snapshot to show the method, not a market average.
| Category | US price per g protein (USD, spot check) | UK price per g protein (GBP, spot check) | High-protein vs standard premium (same retailer) |
|---|---|---|---|
| High-protein yoghurt | $0.09 – Oikos Pro 20g protein cup, 5.3 oz, $1.79 | £0.035 – Tesco High Protein Natural Yogurt, 500g, £1.95, 11.3g protein/100g | US +153% per oz vs Yoplait Original ($0.80/6 oz); UK +70% per kg vs Tesco Natural Yogurt (£1.15/500g). Per gram of protein the high-protein pots are cheaper: 44% (US) and 22% (UK) |
| Protein bars | $0.14 – Quest Protein Bar, 60g, $2.99 regular, 21g protein | £0.14 – Grenade Carb Killa bar, 60g, £2.90, 21g protein | US +51% per oz: Nature Valley Protein ($4.79/7.1 oz) vs Nature Valley Crunchy ($3.99/8.94 oz); UK +58% per kg: Nature Valley Protein (£18.75/kg) vs Nature Valley Crunchy (£11.90/kg) |
| High-protein ready meals | $0.29 – Healthy Choice Protein Bowl, Greek-Style Chicken, 9.5 oz, $5.29, 18g protein | £0.10 – Tesco High Protein Chicken Shawarma, 400g, £3.75, 37.7g protein per pack (nutrition table) | 66% average mark-up, 2024 (Euromonitor, global) |
| Protein RTD drinks | $0.17 – Core Power 26g shake, 14 fl oz, $4.49 regular | £0.06 – UFIT Pro50 drink, 500ml, £3.00 regular, 50g protein | High-protein milk vs standard milk: US +222% per fl oz, fairlife 2% ($5.99/52 oz) vs Kroger 2% ($2.29/64 oz); UK +127% per litre, SuperNutrio High Protein semi-skimmed (£2.50/L) vs Tesco Filtered Semi Skimmed (£1.10/L) |
| High-protein bread and bakery | $0.07 – Thomas' High Protein Plain Bagels, 4 ct, $5.99, 21g protein each | £0.03 – Tesco High Protein 4 White Rolls, £1.60, 12.8g protein per roll | US +56% per oz vs Thomas' Plain Bagels ($4.49/18 oz); UK +60% per roll vs Tesco 4 Large White Baps (£1.00) |
Availability is the second lens. Tracking in-stock status daily shows which protein lines sell through, which are delisted, and where a new launch gains listings. Order and sales volumes are not public, so we use labelled proxies such as stock-outs, review counts and bestseller badges.
Protein has moved onto restaurant menus too. Circana reports that 12% of US commercial foodservice meals are described as 'high protein' (NACS / Circana). Datassential, as quoted by US Foods, found the share of consumers calling protein intake important rose from 38% in 2023 to 52% in 2025 (US Foods, July 2026).
QSR Magazine, citing Datassential, reports that 66% of consumers are interested in high-protein products and 75% actively think about protein in their daily diet (QSR Magazine, May 2026). Chains respond with protein-forward bowls, double-protein add-ons, gram callouts and protein coffee drinks.
Menu data shows this in measurable form. Each chain's public menu and nutrition page lists items, prices and often protein grams. Delivery apps add item-level prices by location and promotional bundles.
| Menu metric | US example (cited) | UK example (cited) | Field to track |
|---|---|---|---|
| Menu items with protein grams shown | Chipotle's High Protein Menu (from 23 Dec 2025) lists items from 15g to 81g protein (Axios) | LEON's spring menu labelled 8 items with protein grams, 11g to 35g (Retail Times, Apr 2025) | protein_g, item_name |
| Items with 'protein' in name or description | Starbucks launched 7 protein lattes and protein cold foam drinks, up to 36g per grande (WLOS, 29 Sep 2025) | Pret added a Chicken & Edamame protein pot and a 50g-protein Chipotle Chicken Super Plate (Grocery Gazette, 28 Apr 2026) | item_name, description, claim_text |
| Price of a protein-only item | Chipotle High Protein Cup of adobo chicken: $3.82 national weighted average (Axios) | Pret protein pots from £2.95 (Grocery Gazette) | price, portion_size |
| Demand for high-protein meals | 12% (commercial foodservice) | 46% of LEON customers look for high-protein options on the go (LEON research via Retail Times) | claim_text, menu_section |
Our restaurant menu nutritional data work captures item, price, calories and protein where the chain publishes them. We collect public menu data only and never promise order or sales volumes.
GLP-1 weight-loss medicines are a new demand driver. Circana says GLP-1 use is now the second most common diet type among US adults at 8.5%, up from 4.8%, and 65% of GLP-1 users want more protein (NACS / Circana).
Circana also projects that 35% of US food and beverage units could come from GLP-1 households by 2030 (Prepared Foods / Circana, January 2026). Users eat smaller portions, so they look for dense protein in small packs. That links protein claims to pack-size and portion data.
In the UK, Mintel research quoted by FoodNavigator found 54% of consumers agree people need more protein as they age and 53% believe protein keeps you fuller for longer (FoodNavigator / Mintel). Both themes map to labels you can scrape: 'keeps you fuller', 'GLP-1 friendly' and 'companion' wording, plus pack sizes.
| Signal | US evidence | UK evidence | Data field to track |
|---|---|---|---|
| Consumer pull | 71% trying to consume protein (IFIC, 2025) | 21% say protein is a top healthy-food factor, late 2024 (FoodNavigator) | claim_text, category_path |
| Weight-management driver | GLP-1 diet at 8.5% of adults (Circana) | GLP-1 use rose from 3.1% to 4.2% of UK adults, June–September 2025 (IGD via Grocery Gazette) | claim_text ('GLP-1', 'satiety') |
| New-product pace | Protein led Circana's 2024 Pacesetters (Nosh) | 7% of launches with a high-protein claim, 2024 (Mintel) | first_seen_date |
| Small-pack shift | 35% of units from GLP-1 households by 2030 (Circana projection) | Ocado opened a portion-controlled aisle (Jan 2026); M&S, Iceland, Ocado and Co-op launched smaller-portion ranges (Grocery Gazette) | pack_size, unit_price |
Circana's 2024 New Product Pacesetters report called 2024 'the year of protein', with protein drink, powder and supplement formats up 18% in dollar sales (Nosh, June 2025). Watching first-seen dates on retailer sites shows whether 2026 launches keep that pace.
In high-protein food market data, brand position on a digital shelf is about more than price. It covers how many protein SKUs a brand lists, how high they rank in category search, how often they are on promotion and how many reviews they collect.
Share of shelf is a simple, public proxy: the share of a category's listed protein-claim SKUs that belong to each brand or own label. It is not market share by sales, and we label it that way.
| Brand group | US examples (Kroger.com, 14 Oct 2026) | UK examples (Tesco.com, 14 Oct 2026) | Promotions seen in the spot check |
|---|---|---|---|
| Leading branded dairy | Oikos Pro, Oikos Triple Zero, fairlife | Arla Protein, Danone Skyr, Müller x MyProtein | US: Oikos Triple Zero 4-pack $4.50 (was $5.29). UK: Clubcard 'Any 5 for £5' on selected dairy |
| Sports-nutrition brands | Quest, Core Power | Grenade, UFIT, FUEL10K | US: Quest bar $2.50 (was $2.99), '2 for $5'. UK: UFIT Pro50 £2.00 Clubcard (was £3.00) |
| Retailer own label | Simple Truth Protein bagels (Kroger own label) | Tesco High Protein yogurt, rolls and ready meals | UK: Tesco High Protein ready meals 'Any 3 for £8' (Clubcard) |
| Challenger / start-up brands | Healthy Choice Protein Bowls, Thomas' High Protein bagels | The Gym Kitchen, GetPRO, Fulfil, PUREPOWER NUTRITION | UK: The Gym Kitchen Salt & Pepper Chicken £3.00 Clubcard (was £4.00) |
The broader health and specialty diet data feed adds keto, vegan, gluten-free and allergen fields, so protein can be read alongside other diet claims. For trend context, see our article on scraping healthy food trends and demand data.
We build high-protein food market data feeds around six building blocks.
1. Shelf capture. Scheduled collection of public product pages from US and UK grocers and delivery apps, with nutrition, claims, price and stock fields.
2. Claim validation. Computed flags for the FDA 20% DV test and the GB 20%-of-energy test, kept separate from the claim printed on pack.
3. Price per gram. Normalised unit prices converted to price per gram of protein, with promo and base prices split.
4. Menu tracking. Public QSR and fast-casual menus and nutrition pages, with item, price, calories and protein grams where published.
5. Delivery formats. CSV, JSON, API or scheduled feeds into BI tools and dashboards, refreshed daily, weekly or monthly, as agreed when we scope your project.
6. Compliance first. Public business data only, collected in line with robots.txt, site terms and rate limits; no personal data, no logins.
Protein is now a mainstream purchase driver in both the US and UK. Surveys from IFIC, Circana, Datassential and Mintel all point the same way, and Euromonitor sizes the global category above USD 3 trillion. But headline surveys cannot tell you what is on the shelf this week, at what price per gram, or which chain just added a double-protein bowl.
High-protein food market data fills that gap. With claim-tested nutrition fields, price-per-gram metrics and menu signals in one dataset, category and menu teams can act on evidence instead of hype. Download the full report or request a free sample dataset via our contact page.
Questions
It is structured data on protein-claim products and menu items: product names, brands, prices, nutrition per serving and per 100 g, claim text, availability and menu callouts. It is collected from public retailer, delivery-app and restaurant pages and refreshed on a schedule.
In the US, 20% of the 50 g Daily Value per serving, about 10 g, is considered high under FDA label guidance. In Great Britain, at least 20% of the food's energy must come from protein. The two tests can give different answers for the same product.
Survey evidence says yes. IFIC found 71% of Americans trying to consume protein in 2025, and Circana found 48% of US adults want more protein in 2026. Euromonitor projects 11% global demand growth between 2024 and 2029.
Use price per gram of protein: shelf price divided by total protein grams in the pack. It removes pack-size differences and lets you compare brands, own labels and countries on one basis, with promotions tracked separately.
Yes, where chains publish menus and nutrition publicly. We capture items, prices, calories and protein grams. Order and sales volumes are not public, so we offer labelled proxies such as menu presence, price changes and delivery-app availability.
We collect only publicly available business data, respect robots.txt, site terms and rate limits, and never bypass logins, CAPTCHAs or paywalls. No personal data is collected.