

1. Expanding Dark-Store Network: Major platforms continue expanding their dark-store networks across India.
2. Wider SKU Availability: Quick-commerce platforms are increasing assortment across important product categories.
3. Intensifying Price Competition: Frequent price changes create opportunities for continuous competitor monitoring.
4. Growing Geographic Coverage: Quick-commerce services are expanding across metros and emerging cities.
5. Localized Market Intelligence: Pincode-level data reveals differences in pricing and availability.

India's quick-commerce industry has entered a new phase in 2026. What initially emerged as a rapid grocery-delivery model has evolved into a highly distributed retail ecosystem combining dark stores, localized inventories, algorithmic pricing, digital promotions, and increasingly broad product assortments. Blinkit, Zepto, Swiggy Instamart, Flipkart Minutes, and BigBasket are competing not only on delivery speed but also on assortment depth, product availability, pricing, discounts, and geographic coverage.
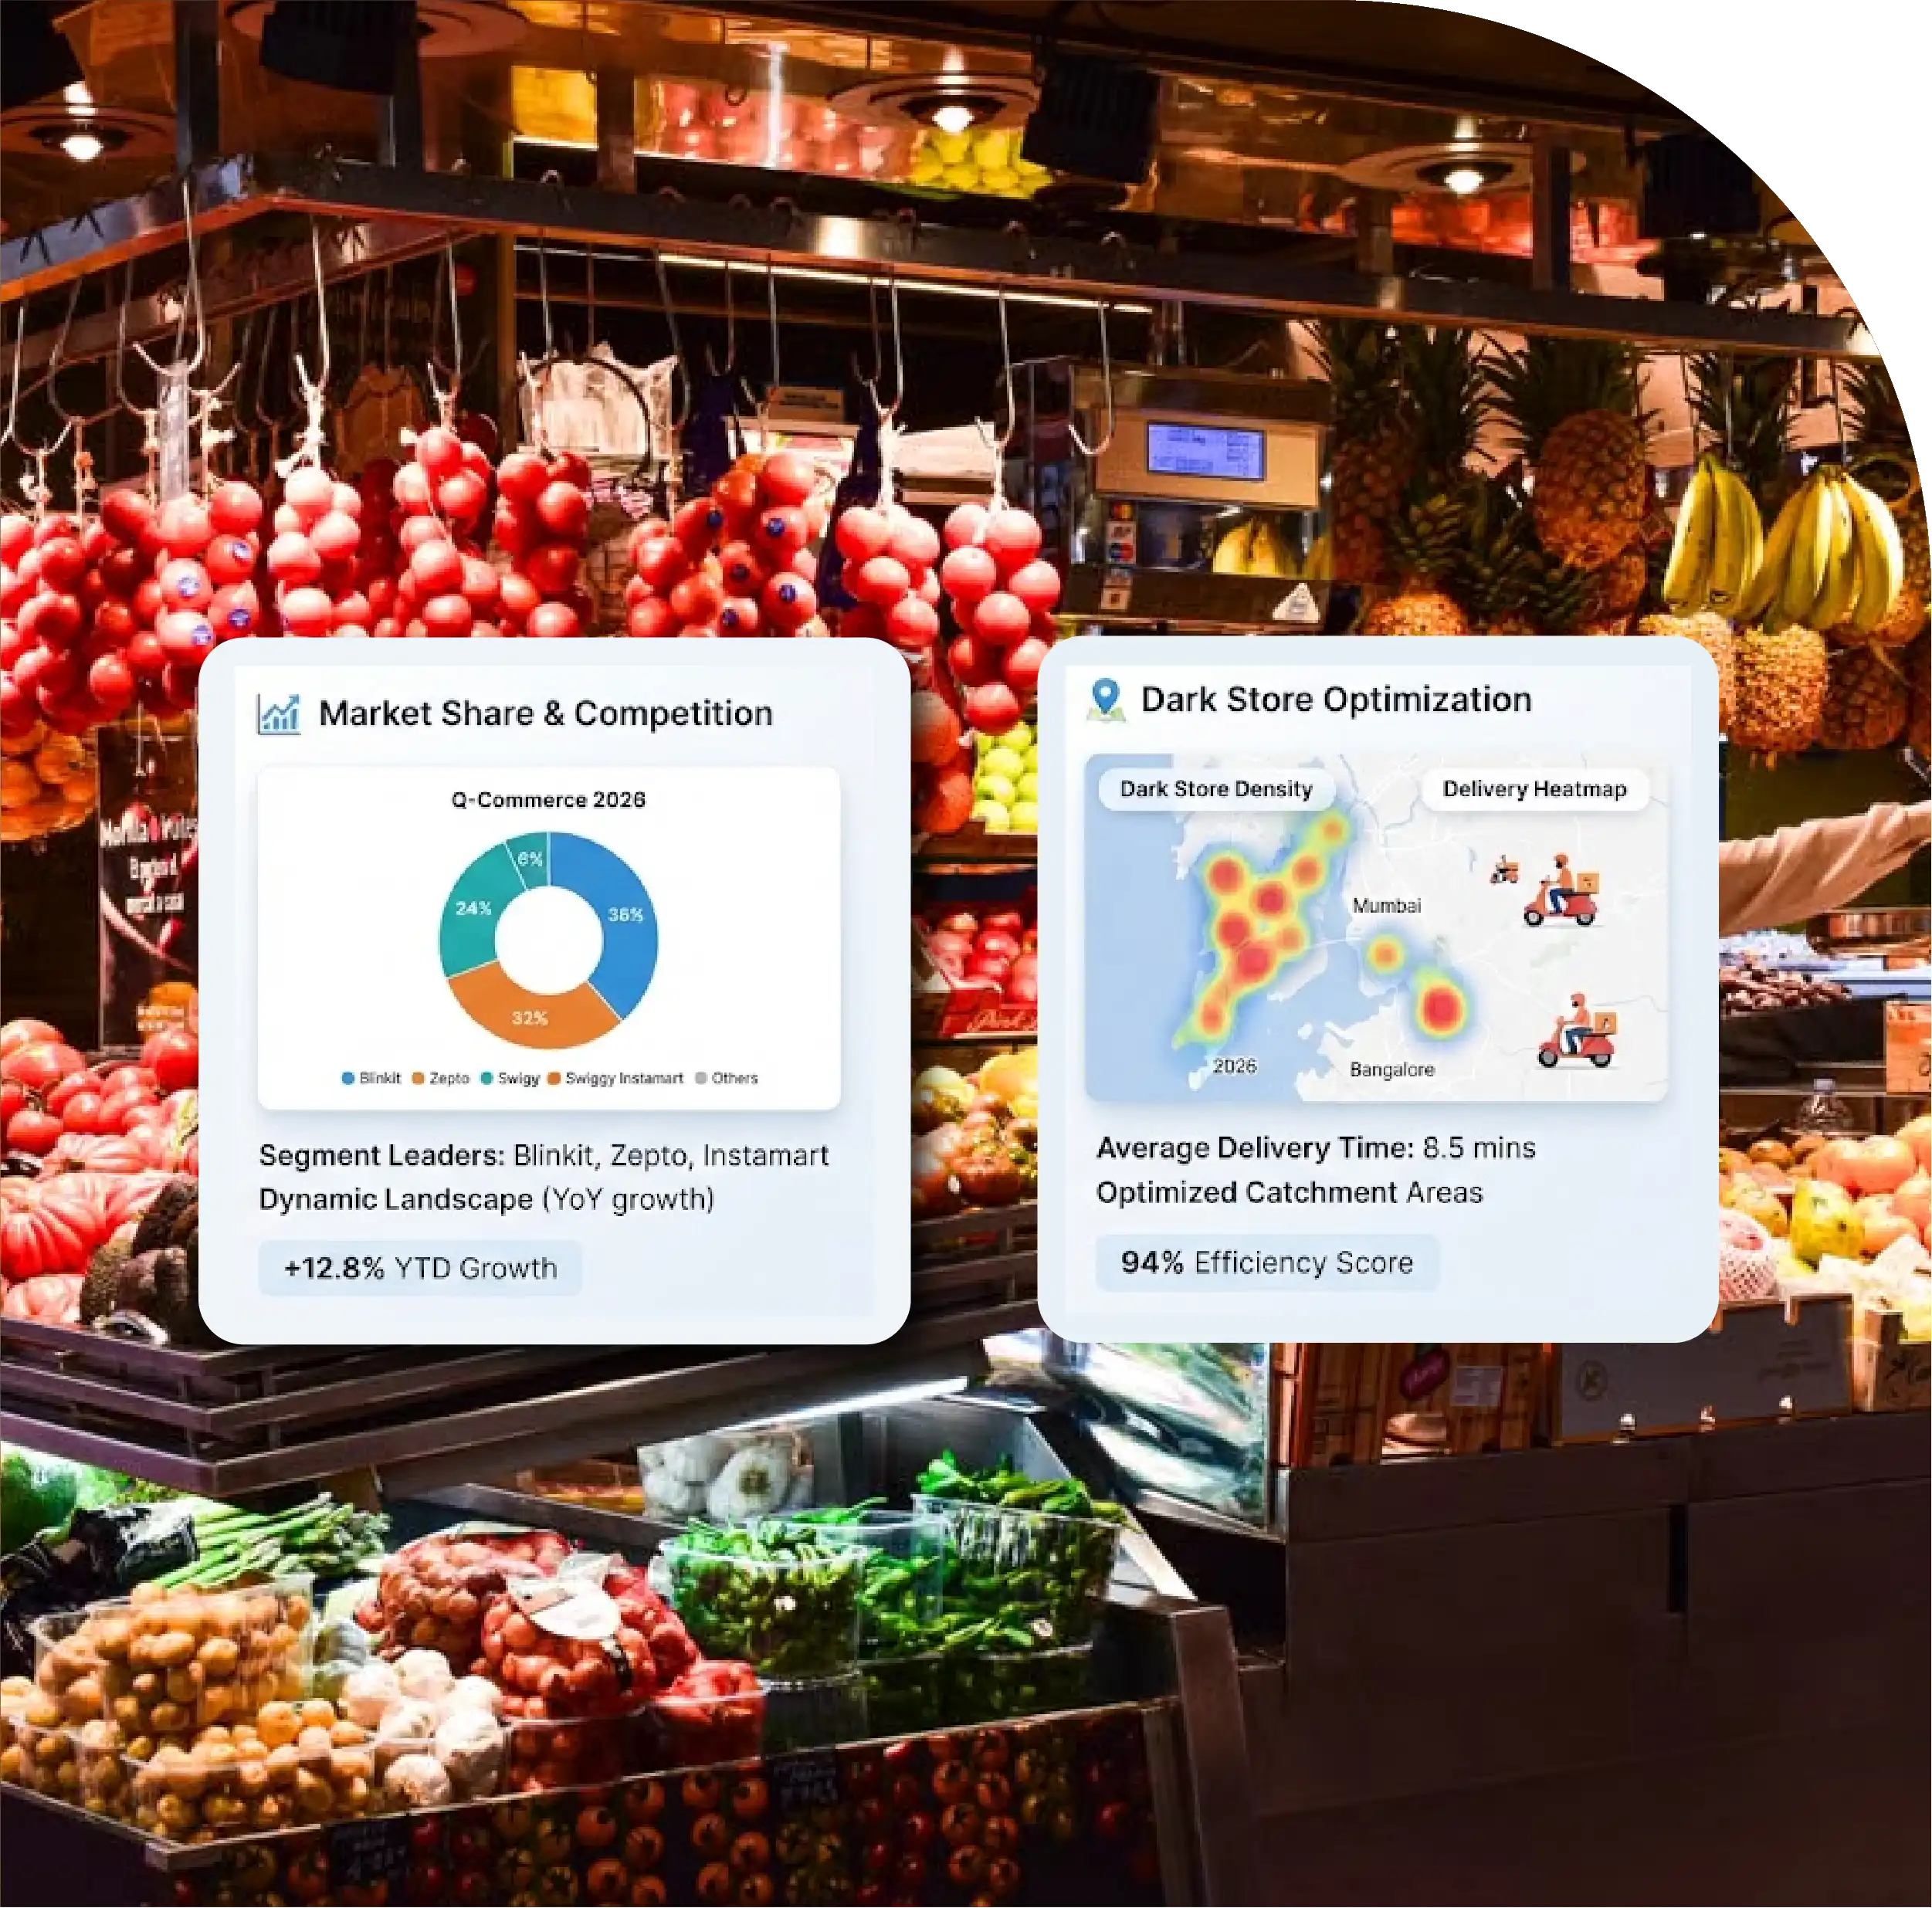
A July 2026 mapping exercise identified 5,625 dark stores across five major platforms, covering 408 cities and 26 states. Blinkit accounted for 1,955 mapped stores, followed by Zepto with 1,088, Swiggy Instamart with 1,038, Flipkart Minutes with 880, and BigBasket with 664.
For brands and retailers, Indian Quick Commerce Data Scraping 2026 can provide structured visibility into product listings, prices, discounts, availability, categories, locations, and promotional activity.
Meanwhile, India Quick Commerce Market Data Extraction enables businesses to combine marketplace-level observations with geographic and product-level information. Scrape Q-Commerce Availability And Pricing Data to further reveal how the same product behaves across platforms, cities, pincodes, and individual fulfillment zones.
The result is a market that increasingly needs to be analyzed at a hyperlocal level rather than through national averages alone.
The defining feature of Indian quick commerce in 2026 is the rapid development of fulfillment infrastructure. Dark stores function as localized inventory hubs positioned close to residential demand. Their proximity enables platforms to shorten delivery distances and maintain the delivery-time proposition that differentiates quick commerce from conventional e-commerce.
An Equirus report cited by Business Standard estimated that India's quick-commerce market was growing approximately 40% year over year in 2026. The combined dark-store network of Blinkit, Instamart, and Zepto was reported at 5,026 locations in May 2026, compared with 3,405 a year earlier.
The difference between these figures and other mapping datasets illustrates an important research principle: dark-store counts depend on the platforms covered, methodology, date, and definition of an operating store. Consequently, quick-commerce infrastructure should always be treated as a time-sensitive dataset.
| Platform | Mapped Dark Stores | Share of 5,625 Mapped Stores | Relative Network Position | Key Infrastructure Focus |
|---|---|---|---|---|
| Blinkit | 1,955 | 34.8% | Largest mapped network | Broad geographic expansion |
| Zepto | 1,088 | 19.3% | Second-largest mapped network | Dense urban fulfillment |
| Swiggy Instamart | 1,038 | 18.5% | Major national network | Food-delivery ecosystem integration |
| Flipkart Minutes | 880 | 15.6% | Rapidly expanding network | Expansion into additional cities |
| BigBasket | 664 | 11.8% | Established grocery network | Grocery-led assortment |
| Total | 5,625 | 100% | Five-platform ecosystem | Distributed retail infrastructure |
July 2026 public mapping snapshot. Counts are point-in-time observations rather than permanent platform totals.
A simple store-count ranking provides only part of the picture. Two platforms can have similar national footprints but very different geographic structures.
Dark-store density can be evaluated through several measures:
These measures help distinguish between broad geographic coverage and deep market penetration.
For example, a platform may operate 1,000 stores nationally but concentrate them heavily in major metropolitan areas. Another may operate fewer stores while entering a wider collection of smaller cities. The first may have greater density in core markets, while the second may have broader geographic reach.
This distinction matters because quick commerce is fundamentally local. The relevant competitive environment for a consumer is usually not the national platform footprint but the set of stores capable of serving that consumer's address.
The five-platform mapping exercise identified stores across 408 cities and 26 states, with Maharashtra, Karnataka, and Uttar Pradesh among the leading states by mapped store count.
This geographic expansion suggests that quick commerce is no longer confined exclusively to a small group of major metros.
However, expansion does not mean that all markets have identical economics. Metro markets can support high order density and dense dark-store clusters, whereas smaller cities may require different assortment strategies, lower operating costs, and carefully optimized inventory.
As platforms move into new markets, businesses can use geographic datasets to monitor:
This makes dark-store mapping an important component of Indian Quick Commerce Market Intelligence.
Blinkit Zepto Instamart Data Scraping In India allows analysts to compare the three major platforms at city, pincode, category, and SKU levels.
A CLSA mapping reported in August 2026 found Blinkit with 969 dark stores across India's top 10 cities, while Zepto had 828 and BigBasket had 497. Flipkart Minutes had also moved ahead of Swiggy Instamart in dark-store count across those top cities, illustrating how quickly the competitive landscape is changing.
This is important because national rankings can conceal rapidly changing local competition.
A particular pincode may have:
Another neighborhood may have only one platform. Therefore, consumer choice, delivery speed, product availability, and promotional intensity can differ substantially within the same city.
Dark stores create physical capacity, but inventory depth determines what consumers can actually buy.
Quick Commerce SKU Availability Data Scraping can capture product-level attributes including:
Repeated collection transforms these individual observations into an inventory history.
This makes it possible to identify products that are consistently available, products that frequently go out of stock, new product launches, discontinued SKUs, assortment changes, and differences between cities.
For FMCG companies, Quick Commerce Data Scraping in India is particularly valuable because product visibility on a quick-commerce platform can influence purchase consideration. A product that is unavailable at the consumer's preferred platform may effectively lose the immediate purchase opportunity to a competing brand.
Quick-commerce platforms increasingly carry far more than basic grocery items. Product categories include packaged food, beverages, dairy, fresh produce, personal care, household cleaning, pet products, beauty products, electronics accessories, and other convenience-oriented categories.
Research datasets indicate that assortment can run into tens of thousands of active grocery and FMCG SKUs across leading platforms, although the exact number varies by city, pincode, category, and collection methodology.
This creates an important distinction between listed assortment and available assortment.
A product may appear in a platform's catalog but not be purchasable in a particular neighborhood. Consequently, measuring only catalog size can exaggerate effective consumer choice.
A more useful metric is:
Available SKU rate = Available SKUs ÷ Listed SKUs × 100
Tracking this metric repeatedly can show whether assortment expansion is translating into actual neighborhood-level availability.
Pricing has become another defining feature of India's quick-commerce model.
The Q2 2026 iWeb Quick Commerce Price Index reported a 3.1% quarter-on-quarter increase in its tracked basket across eight cities. Bengaluru recorded the highest reported city increase, while fresh produce and dairy and eggs were among the fastest-rising categories.
The same research reported that identical SKUs could vary by as much as 14% between pincodes within a city.
This has major implications for competitive intelligence.
A brand cannot necessarily assume that there is one national Blinkit price or one national Zepto price. Prices can change according to:
Therefore, a price-monitoring system based on a single location can produce an incomplete picture.
Discounts remain an important customer-acquisition and retention mechanism, but recent research suggests that promotional intensity varies by platform and category.
The Q2 2026 iWeb index reported average tracked-basket discount depths of 13.2% for Zepto, 11.4% for Blinkit, and 9.8% for Instamart.
Separately, a September 2026 Jefferies comparison of a 45-item grocery basket in Bengaluru reported average discounts of 18.8% for DMart Ready, 15.7% for Blinkit, and 13.7% for Swiggy Instamart. It also found substantial category-level differences, with personal care showing higher average discounts than dairy.
These findings show why price intelligence should separate:
MRP → Listed Price → Discount → Effective Checkout Price
The displayed discount alone may not represent the consumer's final economic benefit because delivery, handling, membership, cashback, and minimum-order conditions can affect the final basket cost.
Historical quick-commerce research has also documented frequent SKU-level price movements. DataWeave's research found that Zepto had periods in which more than 20% of tracked SKUs underwent price changes in a month, while Blinkit and Swiggy Instamart generally showed steadier rates in the cited period.
This illustrates why weekly or monthly manual price collection is insufficient for certain categories.
For fast-moving FMCG products, a product can change price multiple times between two conventional research checkpoints.
A high-frequency data pipeline can instead create observations such as:
SKU → Platform → Pincode → Timestamp → Price → Discount → Stock Status
This structure allows businesses to reconstruct pricing histories rather than relying on isolated snapshots.
| Rank | City | Estimated Dark Stores Across Major Platforms | Key Market Characteristic | SKU Availability Intensity | Pricing Competition Level | Data Intelligence Opportunity |
|---|---|---|---|---|---|---|
| 1 | Bengaluru | 629 | Highly concentrated quick-commerce ecosystem | Very High | Very High | Pincode-level price and assortment tracking |
| 2 | Hyderabad | 310 | Large and expanding fulfillment market | High | High | Dark-store density and competitor monitoring |
| 3 | Mumbai | 280 | Dense urban delivery environment | Very High | Very High | Hyperlocal availability and price comparison |
| 4 | Delhi NCR | 270+ | Large multi-city service area | Very High | Very High | Cross-city SKU and promotion tracking |
| 5 | Pune | 220+ | Strong urban consumer demand | High | High | Category-level assortment monitoring |
| 6 | Chennai | 190+ | Established metropolitan market | High | High | Platform coverage and stockout analysis |
| 7 | Kolkata | 170+ | Growing quick-commerce adoption | High | Medium-High | Expansion and SKU availability intelligence |
| 8 | Ahmedabad | 150+ | Important western India market | Medium-High | High | Competitor pricing and assortment analysis |
| 9 | Gurugram | 140+ | Dense premium-consumer catchment | Very High | Very High | Premium SKU and promotional tracking |
| 10 | Jaipur | 120+ | Expanding tier-2 market | Medium-High | Medium-High | Dark-store expansion monitoring |
| 11 | Lucknow | 110+ | Emerging large-city opportunity | Medium | Medium-High | Pincode serviceability tracking |
| 12 | Chandigarh | 90+ | Compact and highly addressable market | Medium-High | High | Store-density and price benchmarking |
| 13 | Indore | 80+ | Growing tier-2 quick-commerce market | Medium | Medium | Assortment expansion monitoring |
| 14 | Surat | 80+ | Strong consumer and retail ecosystem | Medium | Medium-High | Category availability tracking |
| 15 | Nagpur | 70+ | Emerging regional fulfillment market | Medium | Medium | New-store and competitor monitoring |
| Total / Indicative | 15 Major Markets | ~2,900+ | Major urban concentration | High | High | City and pincode intelligence |
Extract Quick Commerce Dark Store Density Data to help organizations connect physical infrastructure with digital marketplace behavior.
A useful dark-store dataset can contain:
| Data Field | Intelligence Application |
|---|---|
| Store ID | Unique location tracking |
| Platform | Competitive comparison |
| Address | Geographic analysis |
| City | Market segmentation |
| State | Regional expansion analysis |
| Pincode | Hyperlocal serviceability |
| Latitude | Geospatial mapping |
| Longitude | Distance calculations |
| Store Status | Active/inactive monitoring |
| Collection Date | Historical comparison |
| Competitor Count | Local competition measurement |
| Service Area | Delivery coverage analysis |
When collected periodically, these fields can identify store openings, closures, relocations, geographic expansion, and competitive clustering.
Blinkit Zepto Instamart Data Scraping can create a second intelligence layer above dark-store mapping.
A SKU-level database can connect each product to:
This enables brand managers to answer practical questions such as:
These questions are difficult to answer through conventional market surveys because quick commerce changes continuously.
Quick commerce is also developing into an important digital advertising environment.
Product visibility is increasingly influenced not only by organic assortment but also by sponsored placements, promotional banners, category positioning, and platform-specific campaigns.
For FMCG brands, this means the digital shelf must be monitored alongside physical distribution.
A product can have excellent offline availability but weak quick-commerce visibility. Conversely, a brand with a smaller physical footprint may gain digital visibility through promotions and sponsored placement.
Consequently, a comprehensive market dataset should ideally track:
Availability + Price + Discount + Ranking + Promotion + Sponsored Visibility
This combination gives brands a clearer picture of their digital shelf position.
FMCG companies can use quick-commerce intelligence across the entire product lifecycle.
This converts quick-commerce platforms from simple sales channels into continuous market-observation environments.
The competitive environment is expanding beyond Blinkit, Zepto, and Instamart.
Flipkart Minutes has been expanding rapidly, while BigBasket continues to operate an extensive grocery-focused network. Amazon is also increasing its commitment to quick commerce. Reuters reported in September 2026 that Amazon planned to invest $3 billion in India's fast-delivery business through 2030, with its network expected to expand substantially.
Greater participation could increase competition across several dimensions:
As more platforms compete for the same consumer, cross-platform monitoring will become increasingly important.
A mature quick-commerce intelligence system should combine four major datasets.
Infrastructure Layer: Tracks dark stores, addresses, coordinates, pincodes, service areas, and expansion.
Assortment Layer: Tracks products, brands, categories, pack sizes, new listings, discontinued SKUs, and availability.
Pricing Layer: Tracks MRP, selling price, discounts, promotions, effective price, and price changes.
Consumer-Experience Layer: Tracks delivery estimates, serviceability, ratings, reviews, minimum order thresholds, and additional charges.
Together, these layers provide a much more comprehensive market picture than a simple store-count report.
| Indicator | 2026 Research Observation | Strategic Interpretation |
|---|---|---|
| Mapped dark stores | 5,625 | Large distributed fulfillment network |
| Mapped cities | 408 | Broadening geographic footprint |
| Mapped states | 26 | Expansion beyond traditional metros |
| Blinkit mapped stores | 1,955 | Largest mapped network |
| Zepto mapped stores | 1,088 | Major challenger network |
| Instamart mapped stores | 1,038 | Large national footprint |
| Flipkart Minutes mapped stores | 880 | Rapid infrastructure expansion |
| BigBasket mapped stores | 664 | Strong grocery infrastructure |
| Q2 2026 price-index change | +3.1% | Rising tracked basket prices |
| Highest reported city increase | Bengaluru | Stronger price movement in tracked basket |
| Highest reported category increase | Fresh produce | Greater price sensitivity |
| Maximum within-city SKU price variation | Up to 14% | Strong hyperlocal pricing effect |
The table combines findings from different 2026 research snapshots, so the figures should not be interpreted as measurements taken on one identical date.
India's quick-commerce market in 2026 is evolving from a delivery-speed competition into a sophisticated, data-intensive retail ecosystem. Dark stores determine geographic reach, SKU availability determines effective assortment, and pricing determines the competitiveness of each shopping basket.
The most important development is the growing importance of hyperlocal intelligence. A platform's national store count cannot explain what a consumer sees in a specific pincode. Likewise, a national product catalog cannot guarantee local availability, and a listed product price does not necessarily represent the final basket economics.
The combination of infrastructure mapping, SKU-level collection, availability tracking, price monitoring, discount analysis, and digital-shelf intelligence therefore provides a much more complete picture of the sector.
Real-Time Price Monitoring can help brands identify price movements, promotional changes, and competitor positioning at frequent intervals rather than relying on occasional manual checks.
Quick Commerce Data Scraping can consolidate product, price, availability, promotion, location, and competitor information into structured historical datasets for market research and business intelligence.
A Q-Commerce Dashboard can then convert this information into visual market intelligence, allowing teams to monitor dark-store density, SKU availability, price dispersion, discounts, stockouts, and platform expansion across cities and pincodes.
As Blinkit, Zepto, Instamart, Flipkart Minutes, BigBasket, Amazon, and other participants continue to develop their fulfillment networks, the competitive advantage will increasingly depend on how quickly businesses can detect and interpret changes in the digital retail environment.
Are you in need of high-class scraping services? Food Data Scrape should be your first point of call. We are undoubtedly the best in Food Data Aggregator and Mobile Grocery App Scraping service and we render impeccable data insights and analytics for strategic decision-making. With a legacy of excellence as our backbone, we help companies become data-driven, fueling their development. Please take advantage of our tailored solutions that will add value to your business. Contact us today to unlock the value of your data.



