

Coverage Benchmarking
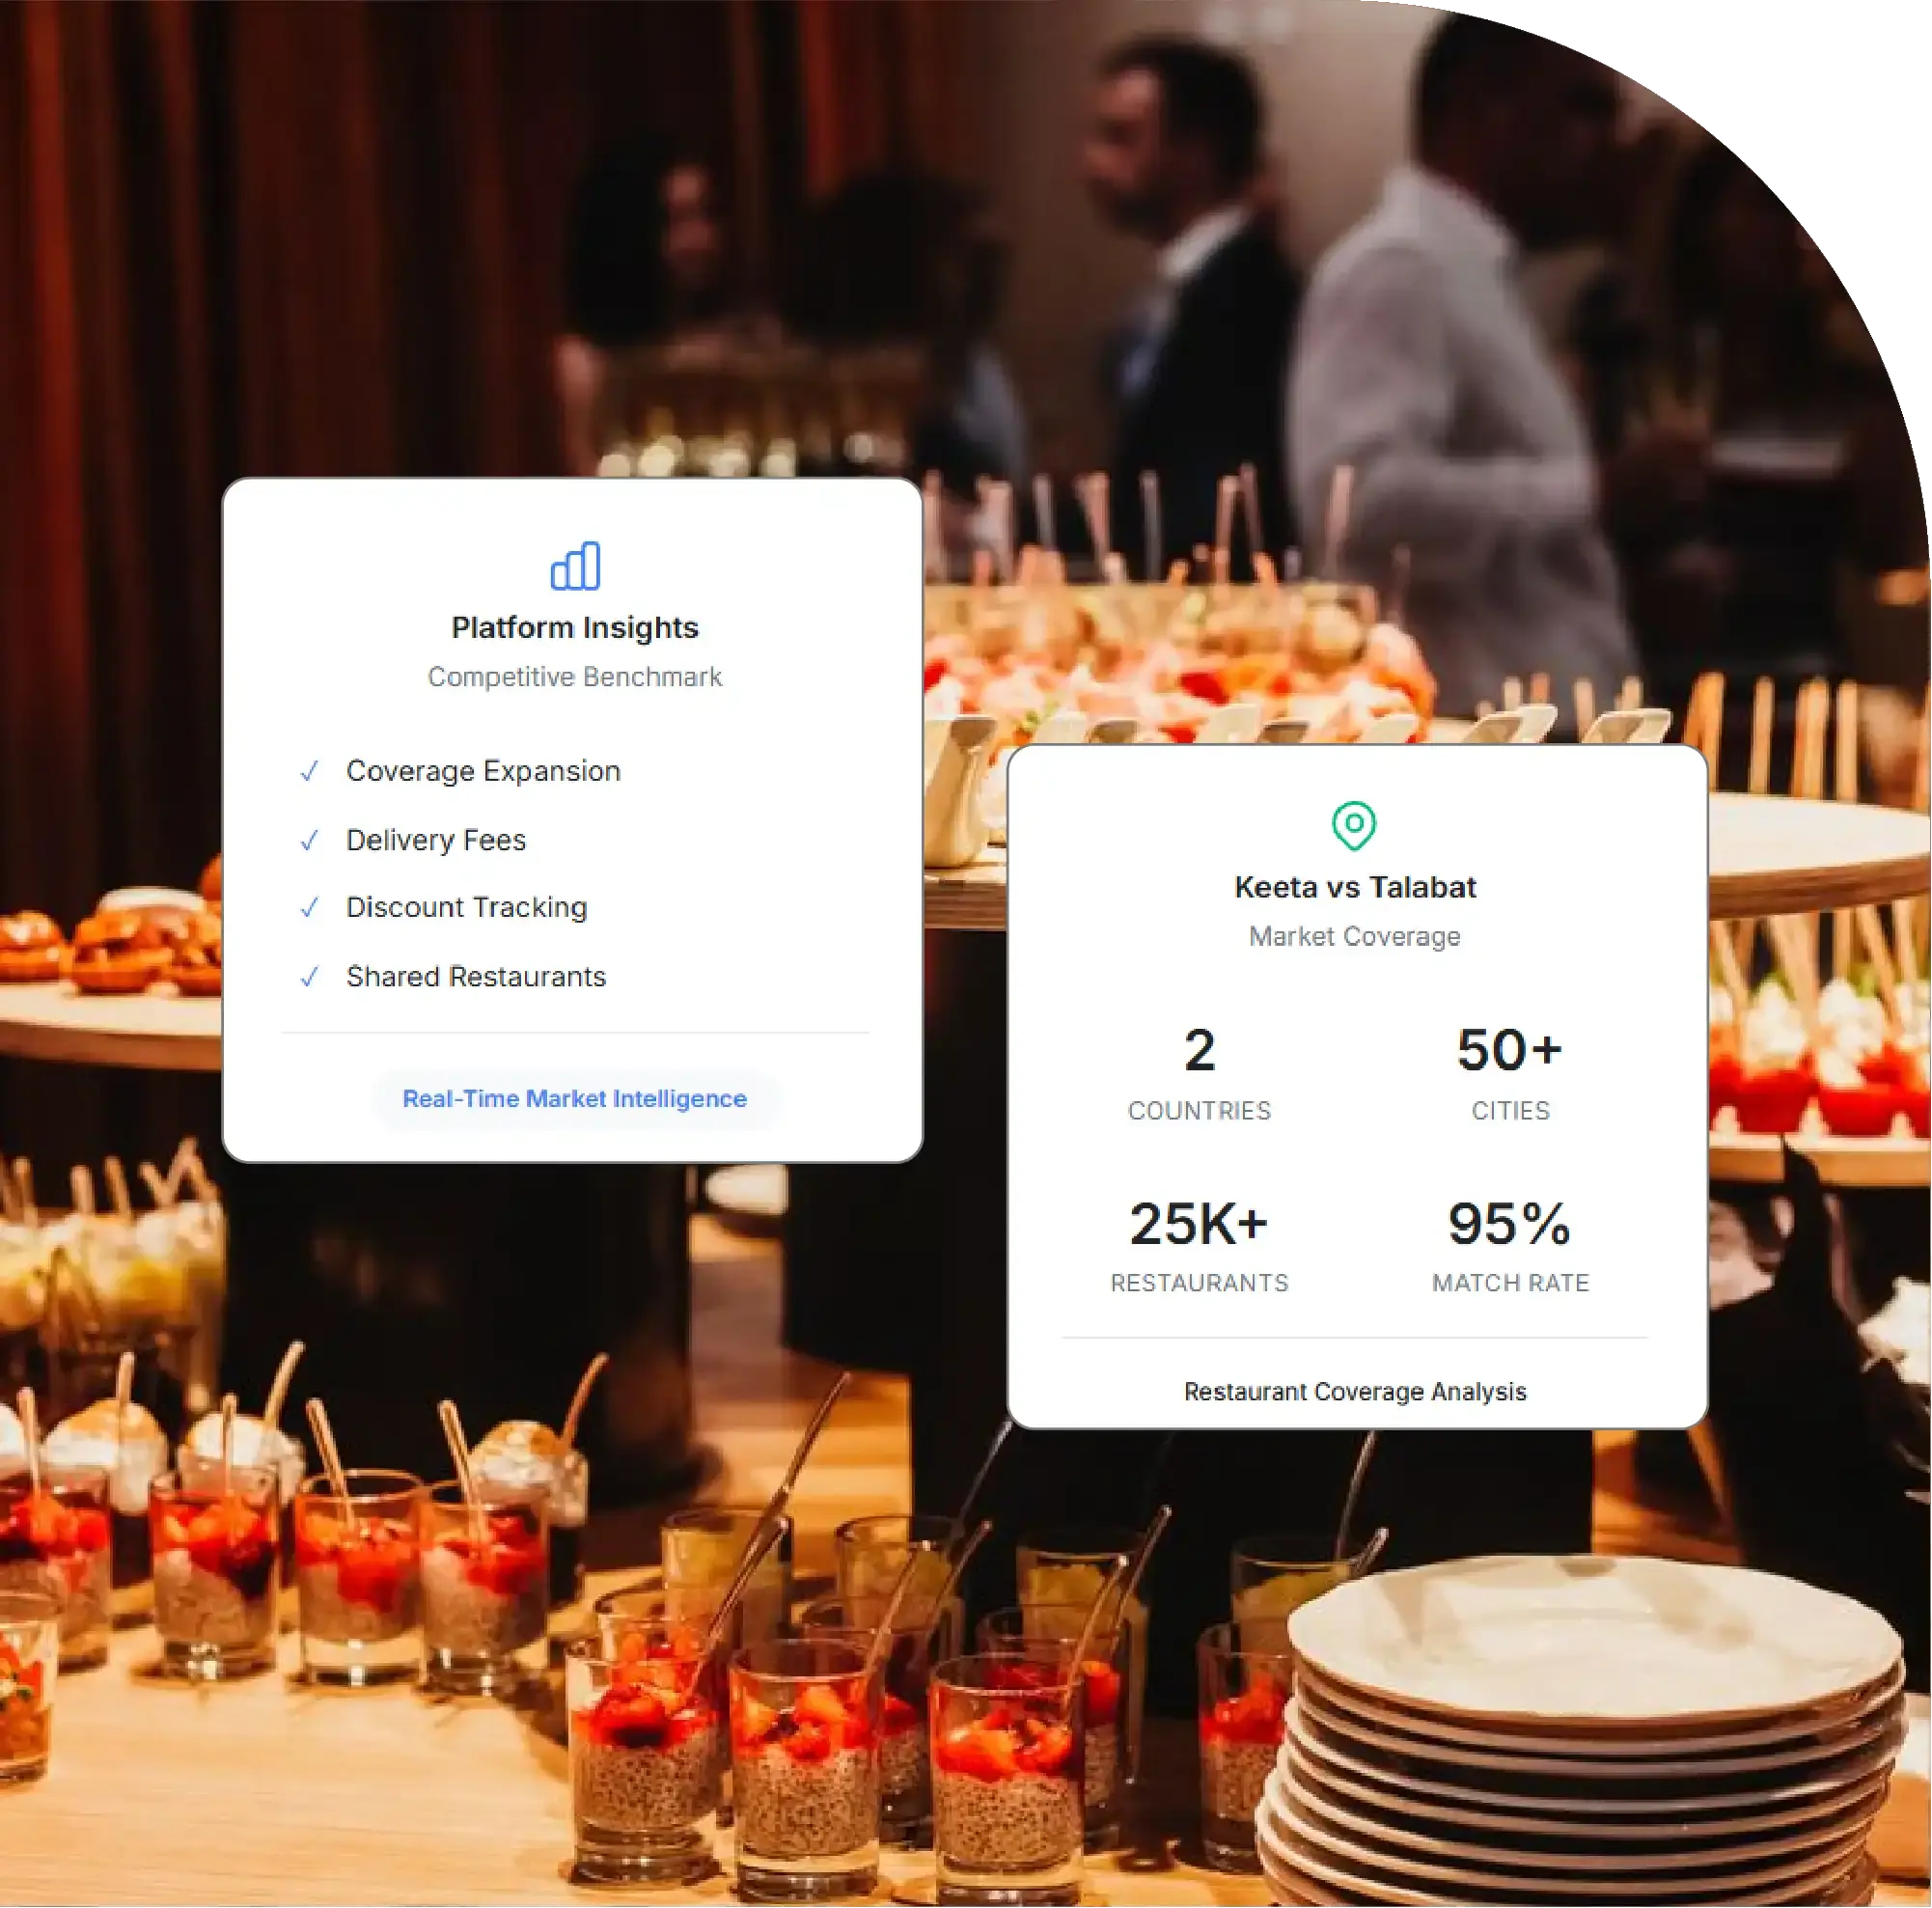
Compares restaurant listings city by city across Riyadh, Jeddah, Dammam, Dubai and Abu Dhabi to size the challenger's reach against the incumbent.
Discount Depth Analysis
Measures the share of listings carrying an active discount on each platform, distinguishing a subsidy-led entry phase from settled pricing.
Supply Overlap Mapping
Classifies restaurants as shared or exclusive to reveal how much of the challenger's catalogue is net-new supply an incumbent cannot quickly match.
Matched-Cohort Fee Comparison
Compares delivery fees on the same restaurants across both platforms, so cost differences aren't distorted by differing restaurant mixes.
Competitive Outlook
Tracks whether discount depth holds or tapers and whether exclusive supply grows, indicating which platform is building position rather than buying it.

How far has Keeta expanded across Saudi Arabia and the UAE against incumbent Talabat? Restaurant counts, coverage, discount depth and supply overlap — measured from our own crawls of both platforms.
50%
Keeta's coverage ratio vs Talabat (same cities)
22%
Lower avg Keeta delivery fee in Riyadh
71%
Keeta listings with an active discount (vs 44%)
+34%
Fastest Keeta growth — Jeddah, QoQ
City-by-city restaurant listings, Keeta versus Talabat, in the cities we crawl both.
Keeta now lists 13,500 restaurants across 5 cities in KSA and the UAE, versus Talabat's 27,000 in the same cities — a coverage ratio of 50%. The gap is widest in Dubai, where Talabat's incumbency is strongest, and narrowest in Dammam.
Two things separate a challenger from an incumbent: how hard it discounts, and how much new supply it actually brings.
During the study window, 71% of Keeta listings carried an active discount versus 44% on Talabat — the clearest sign of a subsidy-led acquisition phase. On supply, 63% of Keeta's Riyadh restaurants also list on Talabat, meaning roughly 37% are exclusive or net-new to the market rather than poached listings.
Coverage ≠ order share. Keeta's 50% listing coverage doesn't mean 50% of orders — listing counts measure supply, not demand. Track both.
The discount gap is the story. 71% vs 44% signals a subsidy phase; watch whether that depth holds or tapers next quarter — that's when true pricing shows.
Exclusive supply is the moat. The 37% Keeta-exclusive share is what an incumbent can't quickly copy. If it grows, Keeta is building, not just buying.
Coverage: matched-city crawls of both platforms across Riyadh, Jeddah, Dammam, Dubai, Abu Dhabi.
Comparable orders: delivery fees and promo depth compared on matched restaurant cohorts (same restaurant, both platforms).
Overlap: restaurants matched by name + location to classify shared vs exclusive supply.
Period: [state exact crawl dates].
Collection: FoodDataScrape platform crawls, public (logged-out) data only.
Limitations: logged-out view; promos vary by user; listing counts measure supply, not order volume.
Questions
By listing count, no — in July 2026 Keeta covered about 50% of Talabat's restaurants in the cities we crawl. But coverage is a supply measure, not order share, so it doesn't tell you who wins more baskets.
As of July 2026, our crawl covers Keeta in Riyadh, Jeddah, Dammam, Dubai and Abu Dhabi. Coverage expands each quarter; the changelog records new cities.
On matched restaurant cohorts, Keeta's average delivery fee ran ~22% lower in Riyadh, and 71% of its listings carried a discount versus 44% on Talabat — consistent with a subsidy-led entry.
Matched-city crawls of both platforms, restaurants matched by name and location, fees and promos compared on shared cohorts. Public data only.



