Boo-st your food data. Save 20% on scraping services
Menus · Grocery · Alcohol · AI Intelligence, across 40+ countries

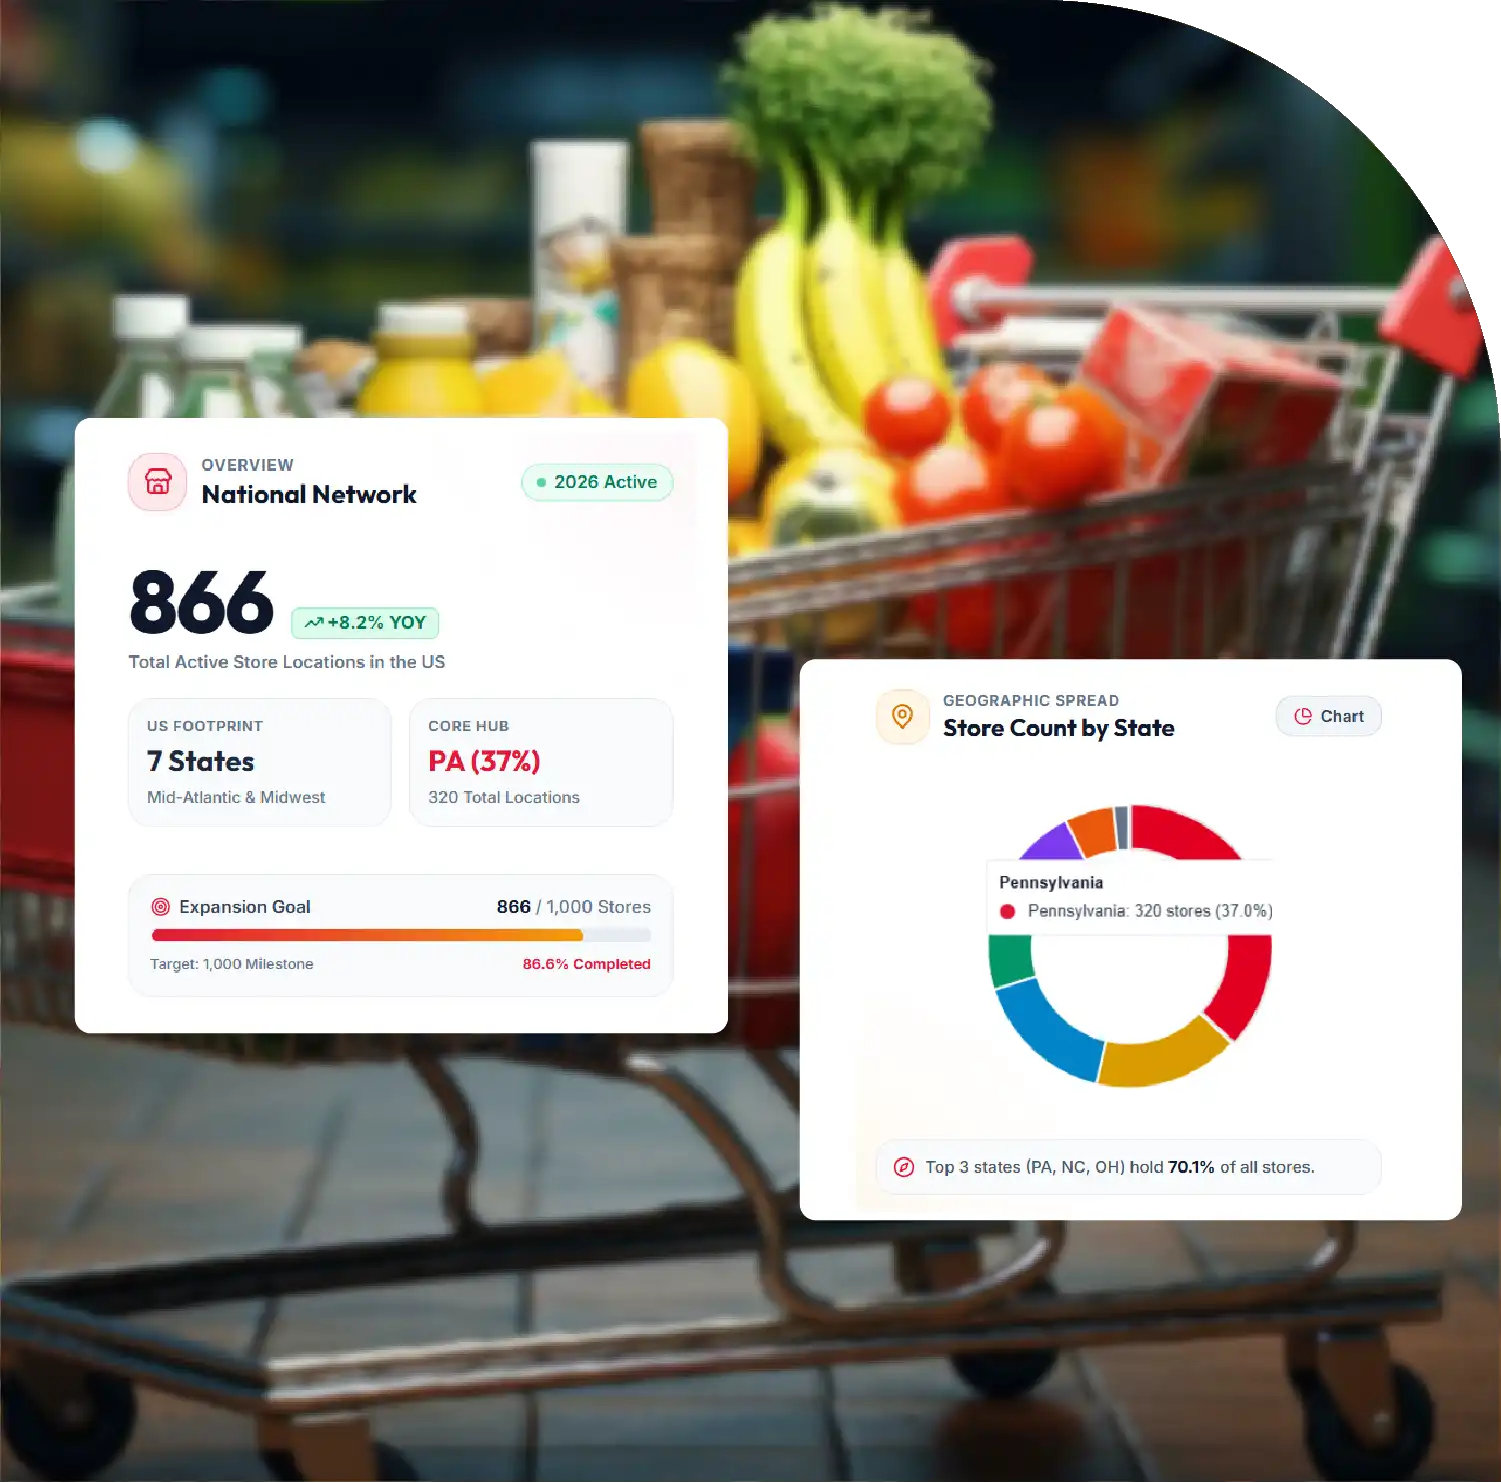
1. 859 Total Sheetz Locations: Sheetz operates 859 stores across seven U.S. states.
2. Pennsylvania Leads the Network: Pennsylvania contains 320 stores, representing 37% nationally.
3. Seven-State Geographic Presence: Sheetz operates across seven states and territories.
4. 505 Cities Covered: Sheetz locations span 505 cities across America.
5. Strong Regional Concentration: Four leading states contain 735 Sheetz stores.

The Number of Sheetz stores in the United States in 2026 stands at 859 locations as of September 21, 2026, distributed across seven states and territories and 505 cities. The network demonstrates a strong concentration across Pennsylvania, North Carolina, Ohio, Virginia, West Virginia, Maryland, and Michigan. Pennsylvania alone accounts for 320 stores, representing approximately 37% of the total U.S. footprint. This concentration provides an important foundation for understanding Sheetz's geographic market presence and regional convenience-store strategy.
For businesses monitoring convenience retail expansion, Sheetz Store Location Data Scraping In US provides structured information about individual outlets, including store names, addresses, telephone numbers, geographic coordinates, and update dates. Such datasets can support competitive benchmarking, territory analysis, market research, location intelligence, and retail planning.
The available dataset also strengthens Sheetz US Market Data Intelligence by transforming store-level information into measurable geographic insights. Examining store counts, population-per-store ratios, city concentration, and state-level distribution makes it possible to understand where the retailer has established the strongest physical presence and where its footprint remains comparatively limited.
Sheetz operates 859 stores across seven states and territories in the United States. Although the network covers multiple markets, its distribution is highly concentrated geographically. Pennsylvania is the largest market with 320 locations, followed by North Carolina with 144 and Ohio with 141.
Together, these three states contain 605 stores, equivalent to approximately 70.4% of the entire Sheetz U.S. network. Adding Virginia's 130 locations brings the combined total for the four largest states to 735 stores, or approximately 85.6% of all reported locations.
This concentration is significant for retail market analysis because the national store count alone does not fully describe the structure of the network. A retailer can have hundreds of locations while maintaining a highly regional operating model. Sheetz's 859-store footprint illustrates this distinction clearly.
| Rank | State / Territory | Store Locations | Share of U.S. Network | Population | Population per Store |
|---|---|---|---|---|---|
| 1 | Pennsylvania | 320 | 37% | 13.06M | 40.81K |
| 2 | North Carolina | 144 | 17% | 11.20M | 77.76K |
| 3 | Ohio | 141 | 16% | 11.90M | 84.40K |
| 4 | Virginia | 130 | 15% | 8.88M | 68.31K |
| 5 | West Virginia | 63 | 7% | 1.77M | 28.03K |
| 6 | Maryland | 47 | 5% | 6.26M | 133.30K |
| 7 | Michigan | 14 | 2% | 10.13M | 723.43K |
| Total | 7 States/Territories | 859 | 100% | --- | --- |
The population-per-store figures reveal another dimension of the network. West Virginia has approximately one Sheetz store for every 28,030 people, while Pennsylvania has one for approximately every 40,810 people. By comparison, Michigan has one store for approximately every 723,430 people, reflecting its much smaller current Sheetz footprint relative to population.
Pennsylvania is the central market in Sheetz's U.S. network, with 320 stores. Its 37% share means that more than one out of every three reported Sheetz locations is situated in Pennsylvania. The state's 320 locations also exceed the combined number of stores in several smaller Sheetz markets.
North Carolina and Ohio form the next major concentration points. North Carolina contributes 144 locations, while Ohio contributes 141. Their combined 285 stores account for approximately one-third of the total U.S. network.
Virginia follows closely with 130 stores. Together, Pennsylvania, North Carolina, Ohio, and Virginia account for 735 locations. This represents more than four-fifths of Sheetz's reported national store footprint.
West Virginia contributes 63 locations, while Maryland has 47. Michigan has the smallest presence among the seven reported markets, with 14 stores.
This geographic structure is particularly useful when evaluating competitive retail environments. Rather than treating the United States as a uniform market, analysts can segment Sheetz's footprint into high-density core markets, established secondary markets, and smaller emerging or recently entered markets.
The dataset covers 505 cities, demonstrating that Sheetz's 859 stores are spread across a substantial number of individual urban and local markets. However, store distribution at the city level is also uneven.
Columbus, Ohio, has the highest reported concentration with 12 Sheetz locations. Altoona in Pennsylvania, Greensboro in North Carolina, and Raleigh in North Carolina each have 11 stores. Lancaster and Pittsburgh in Pennsylvania each have 10.
Fredericksburg and York have eight locations each, while Hagerstown and Richmond also have eight each.
| Rank | City | State / Territory | Number of Locations | Approx. Share of 859 Stores | Store Network Position |
|---|---|---|---|---|---|
| 1 | Columbus | Ohio | 12 | 1.40% | Highest city concentration |
| 2 | Altoona | Pennsylvania | 11 | 1.28% | Major Pennsylvania market |
| 3 | Greensboro | North Carolina | 11 | 1.28% | Major North Carolina market |
| 4 | Raleigh | North Carolina | 11 | 1.28% | Major North Carolina market |
| 5 | Lancaster | Pennsylvania | 10 | 1.16% | Major Pennsylvania market |
| 6 | Pittsburgh | Pennsylvania | 10 | 1.16% | Major Pennsylvania market |
| 7 | Fredericksburg | Virginia | 8 | 0.93% | Major Virginia market |
| 8 | York | Pennsylvania | 8 | 0.93% | Major Pennsylvania market |
| 9 | Hagerstown | Maryland | 8 | 0.93% | Major Maryland market |
| 10 | Richmond | Virginia | 8 | 0.93% | Major Virginia market |
| Top 10 Total | --- | --- | 97 | 11.29% | --- |
The top ten cities collectively account for 97 locations, or approximately 11.3% of the total U.S. network. This indicates that while Sheetz has concentrated clusters in important cities, the majority of its stores are distributed beyond these ten leading markets.
Sheetz Store Location Data Extraction can provide a structured foundation for analyzing this geographic footprint. The supplied records include fields such as store name, street address, city, state, ZIP code, telephone number, latitude, longitude, country, and last updated date.
These fields enable analysts to move beyond simple store counting. Latitude and longitude can support mapping and proximity analysis, while ZIP codes can be used for demographic segmentation. Phone numbers and addresses can assist with location verification and business-directory enrichment.
The dataset also demonstrates why Number Of Sheetz Stores Data Scraping In USA can be valuable for recurring market research. Store networks change as retailers open new locations, relocate outlets, close stores, or expand into additional markets. A dated dataset therefore provides a measurable snapshot that can be compared with subsequent collection cycles.
One of the clearest findings is regional concentration. Seven states and territories contain all 859 reported stores, while 49 other states and territories have no reported Sheetz location in the supplied dataset.
Pennsylvania is particularly dominant, containing 320 locations. North Carolina, Ohio, and Virginia form another major regional group, collectively contributing 415 stores. West Virginia and Maryland add 110 locations, while Michigan contributes 14.
The population-per-store metric also highlights differences between markets. West Virginia's ratio of approximately 28,030 people per store is substantially lower than Maryland's 133,300 and Michigan's 723,430. These differences do not by themselves establish demand or performance, but they provide useful context for examining retail coverage.
For analysts seeking broader convenience-retail intelligence, Extract Sheetz Convenience Store Data to support comparisons involving store density, geographic penetration, market clusters, and city-level presence.
A structured Sheetz dataset can support several research applications. Retail analysts can use store coordinates to calculate distances between locations, identify geographic clusters, and examine proximity to population centers. Competitor researchers can compare Sheetz locations with other convenience stores, fuel stations, supermarkets, and quick-service restaurants.
Location datasets can also support territory planning. Businesses can identify markets with high concentrations of Sheetz stores and examine surrounding retail activity. Marketing teams can use city and ZIP-level information for regional campaign planning, while data teams can incorporate store records into broader geographic intelligence platforms.
The information is also useful for Grocery Data Scraping in the USA, particularly when convenience retail is analyzed alongside supermarkets, grocery chains, fuel retailers, and other food-oriented businesses. Combining multiple retailer datasets can reveal differences in geographic coverage, competitive intensity, and market accessibility.
The September 21, 2026 dataset establishes several measurable findings:
These findings demonstrate that Sheetz maintains a distinctly regional U.S. footprint rather than an evenly distributed national network.
The 859 Sheetz stores reported as of September 21, 2026 provide a detailed view of a highly concentrated convenience-store network. Pennsylvania remains the largest market with 320 locations, while North Carolina, Ohio, and Virginia form additional major centers of presence. The 505-city footprint shows that the retailer extends beyond a small number of metropolitan clusters, even though the overall network remains concentrated in seven markets.
For businesses tracking retail expansion, location intelligence, and competitive distribution, structured datasets can transform individual store records into actionable geographic research. Grocery Data Scraping Services can help organizations maintain comparable retailer datasets and monitor changes across markets over time.
Combining store locations with demographic, geographic, pricing, and competitive information can further support AI Grocery Intelligence, enabling organizations to organize large volumes of retail information for faster analysis and recurring market monitoring.
A structured Supermarket Store Locator DB can also integrate Sheetz locations with broader grocery and convenience-retail datasets, creating a centralized resource for location discovery, competitive benchmarking, territory analysis, and retail intelligence.
Ultimately, the September 2026 Sheetz dataset illustrates how store-level information can reveal much more than a national location count. It provides a geographic framework for understanding regional concentration, city-level penetration, population coverage, and the evolving structure of the U.S. convenience-retail landscape.
Are you in need of high-class scraping services? Food Data Scrape should be your first point of call. We are undoubtedly the best in Food Data Aggregator and Mobile Grocery App Scraping service and we render impeccable data insights and analytics for strategic decision-making. With a legacy of excellence as our backbone, we help companies become data-driven, fueling their development. Please take advantage of our tailored solutions that will add value to your business. Contact us today to unlock the value of your data.