
The Client
The client was a food intelligence and market research company seeking to understand India's expanding healthy food ecosystem. Its objective was to develop a reliable and scalable database covering healthy restaurants, nutrition-focused brands, specialty diet providers, and cloud kitchens operating across major Indian markets. The company required structured information that could be filtered by city, cuisine, dietary preference, menu category, pricing, ingredients, nutrition attributes, and business type. Our Pan India Restaurant Nutrition Database helped consolidate fragmented restaurant and menu information into a standardized structure. Through Restaurant Ingredient Data Extraction, the client could analyze ingredients and product compositions across thousands of menu offerings. The project also incorporated Healthy Food Competitive Intelligence, allowing the client to compare competitors by pricing, menu breadth, dietary positioning, geographic presence, and product offerings. The resulting database became a valuable foundation for market sizing, competitor analysis, expansion planning, consumer trend analysis, and strategic decision-making within India's rapidly evolving healthy food sector.
Key Challenges
-
Fragmented Cloud Kitchen Information
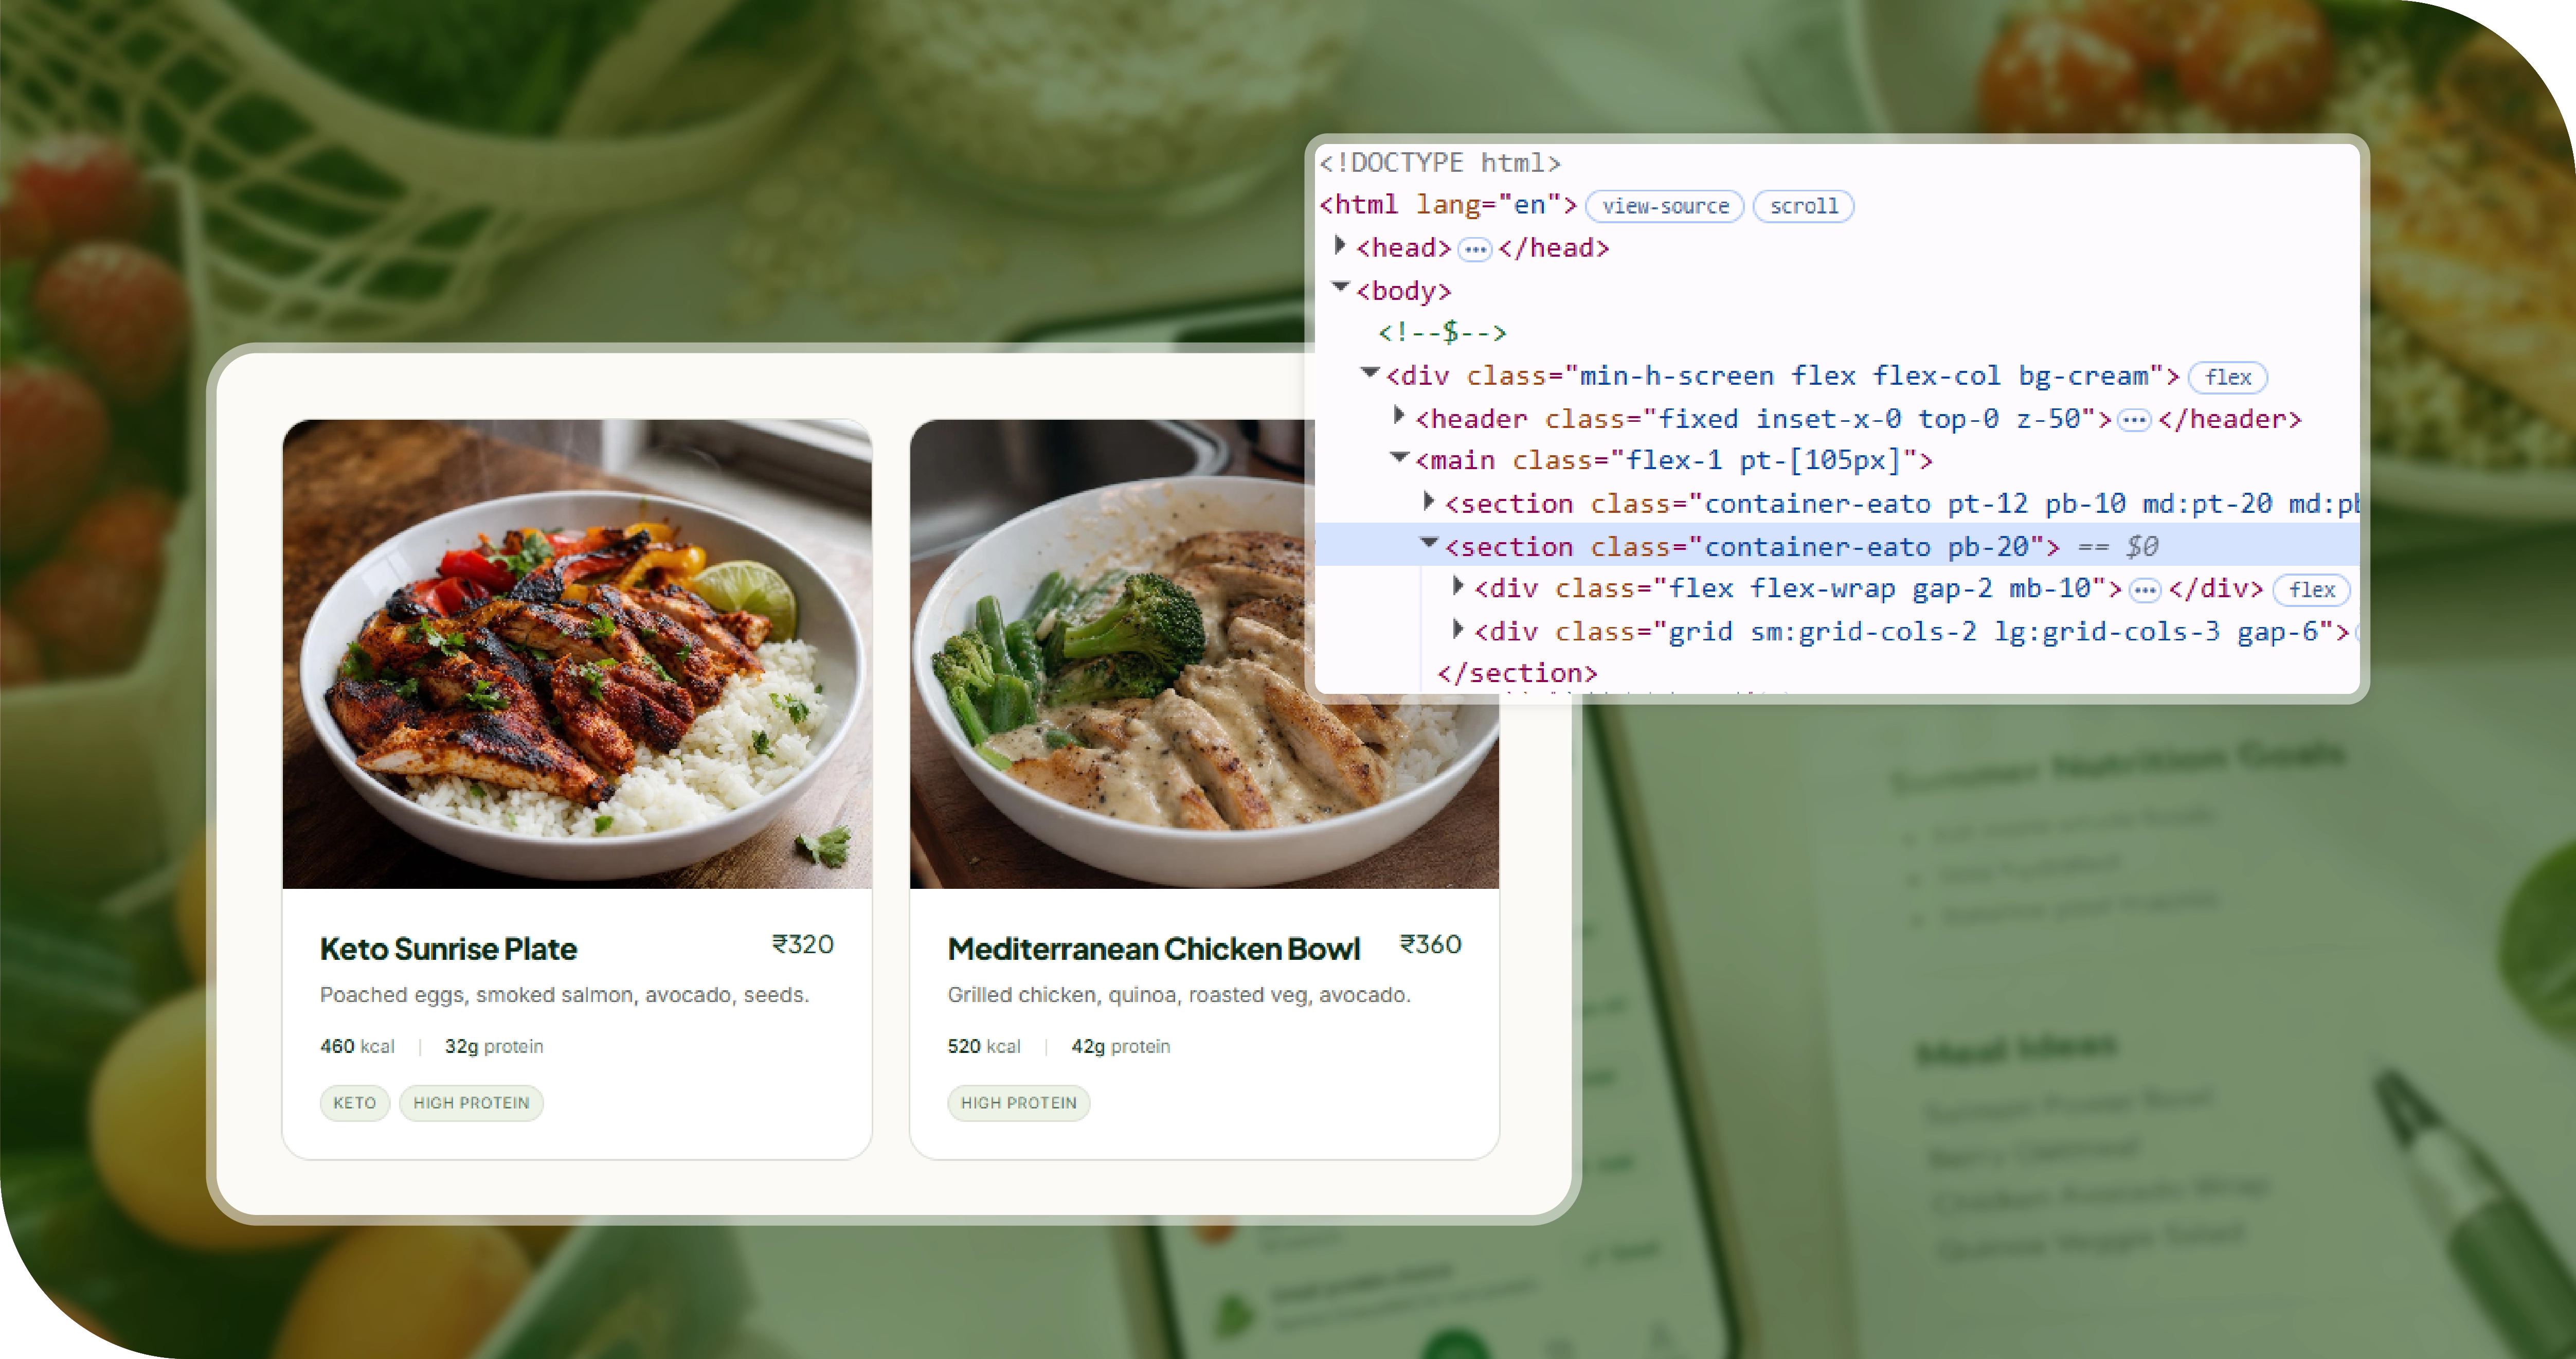
The client struggled to identify and consolidate businesses operating through different formats, including restaurants, delivery-only brands, and virtual kitchens. Cloud Kitchen Location Data Scraping was required to capture business names, locations, cuisines, operating areas, ratings, menus, and other attributes from fragmented digital sources. -
Inconsistent Food Market Information
Restaurant information appeared in different formats across websites, delivery platforms, business listings, and brand pages. Food Data Scraping in India therefore required advanced extraction and normalization processes to convert inconsistent information into standardized records suitable for filtering, comparison, analytics, and database development. -
Complex Dietary and Nutrition Attributes
Healthy food businesses frequently use varied terminology for vegan, keto, gluten-free, low-carb, high-protein, organic, and other offerings. Health & Specialty Diet Data Scraping required identification and classification of these attributes while capturing ingredients, nutrition information, allergens, prices, portions, and menu categories accurately.
Key Solutions
-
Comprehensive Restaurant Data Collection
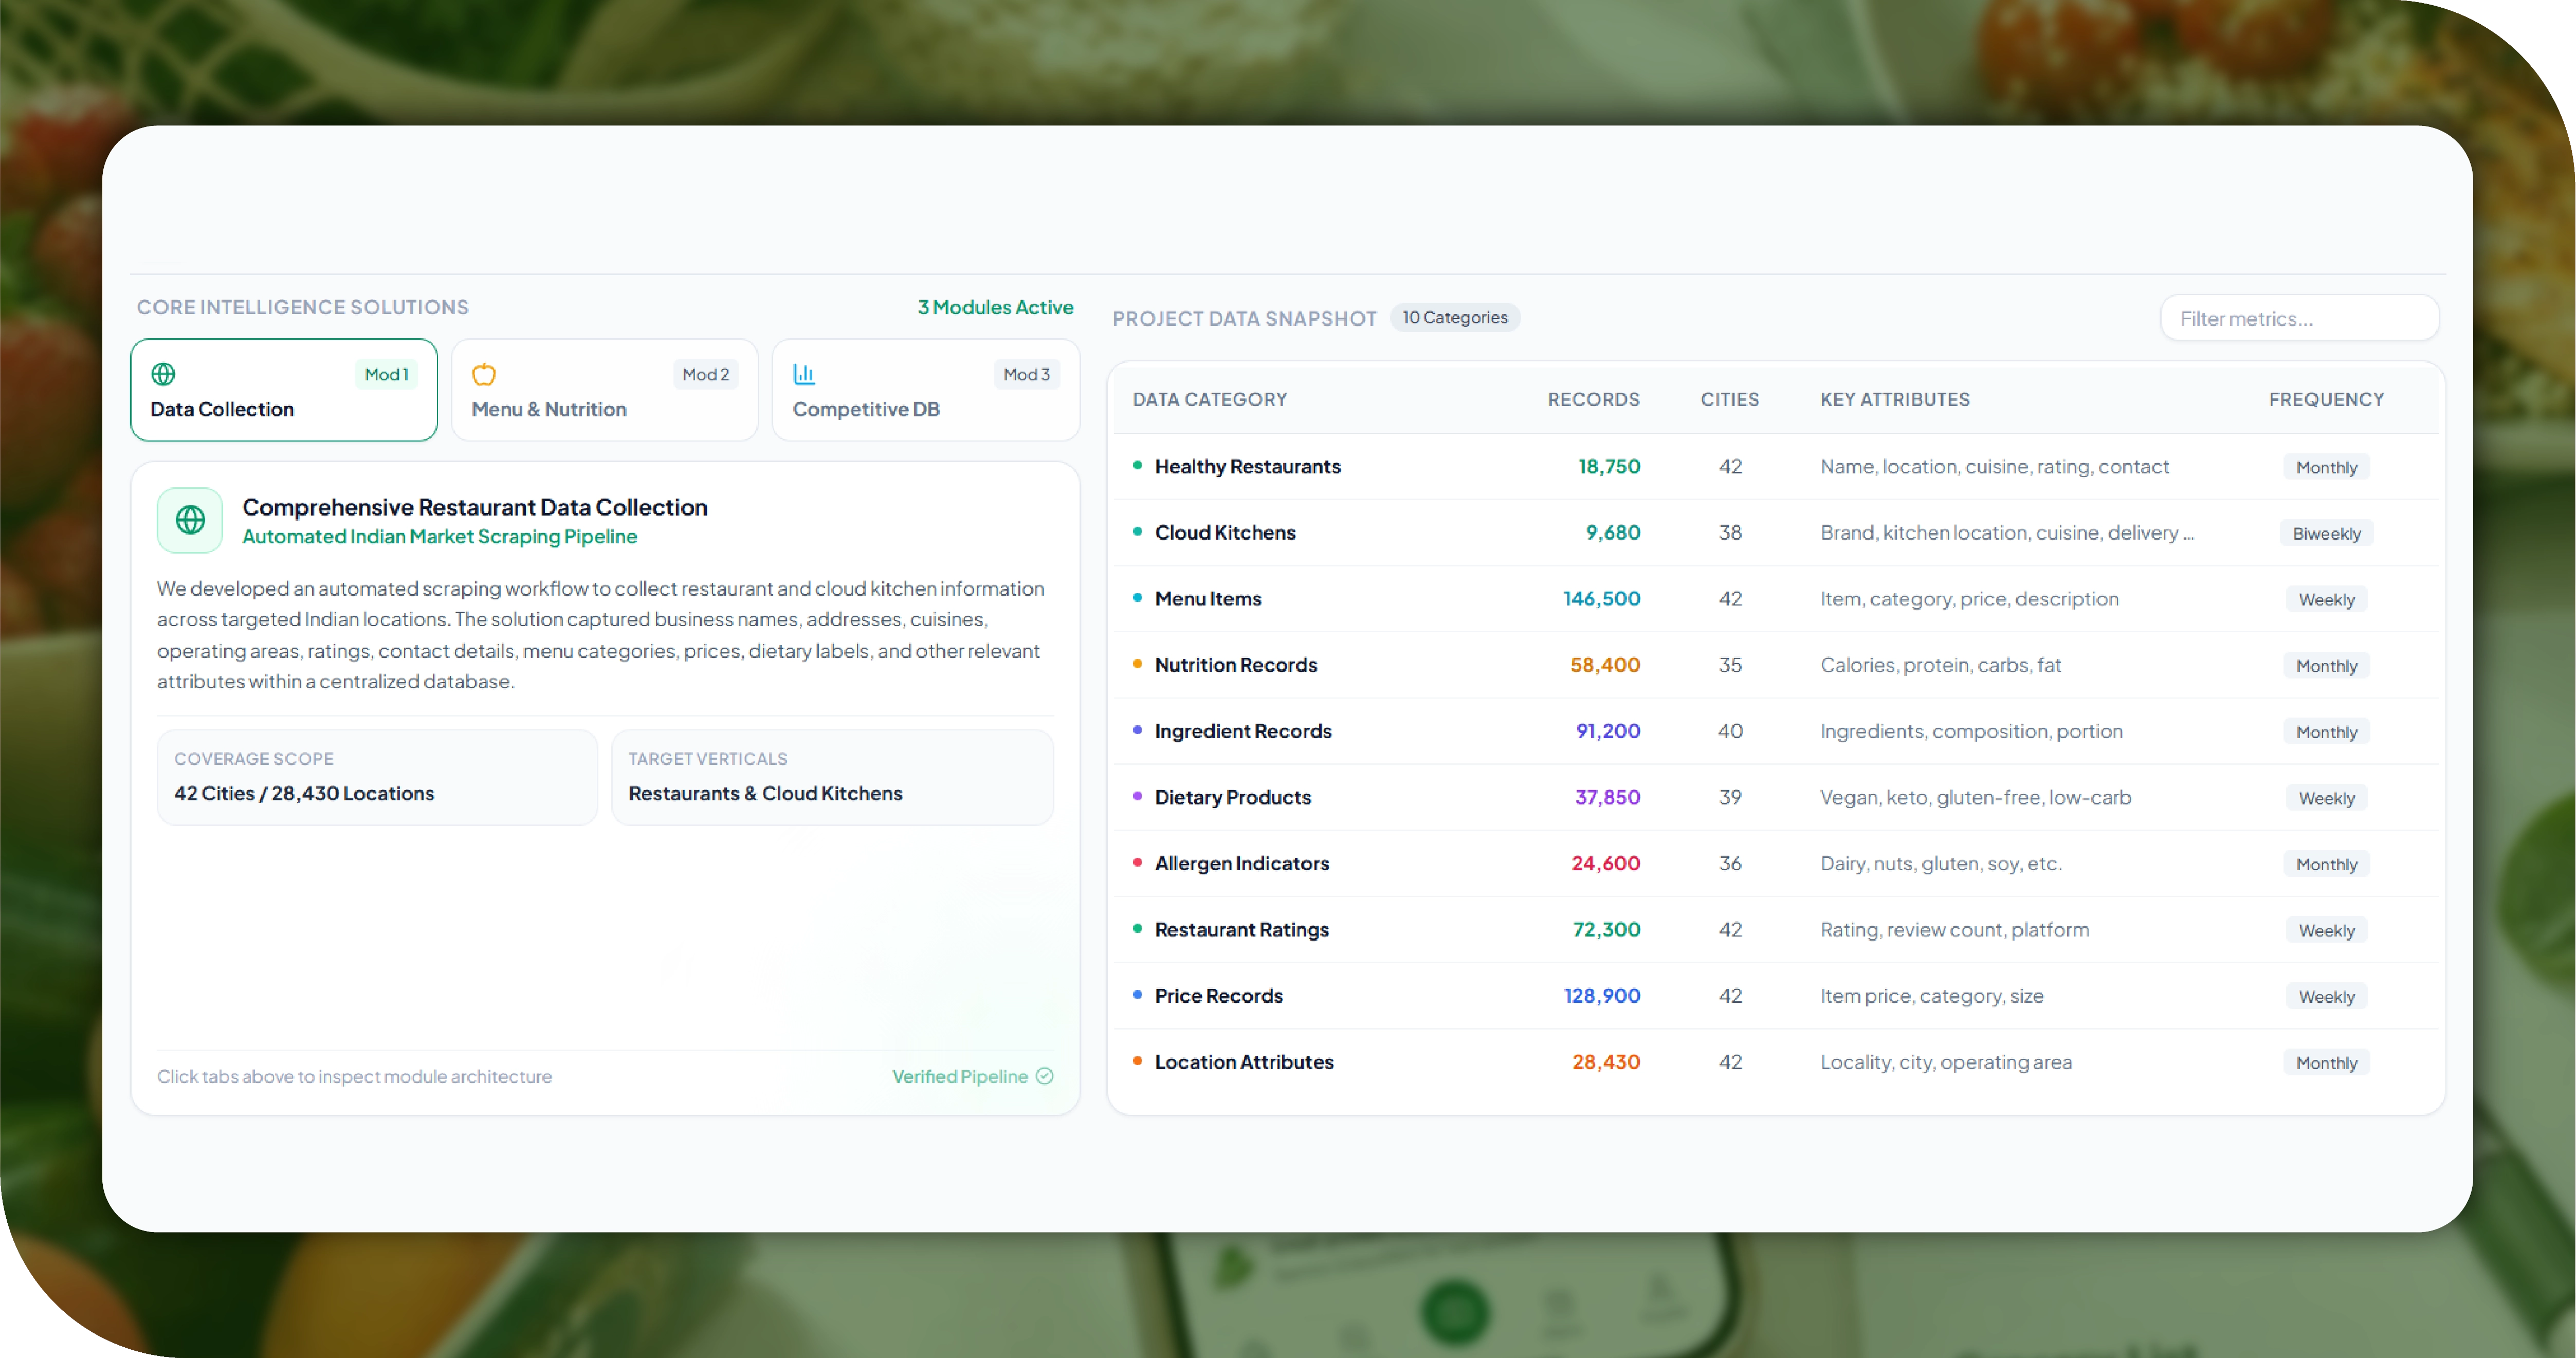
We developed an automated scraping workflow to collect restaurant and cloud kitchen information across targeted Indian locations. The solution captured business names, addresses, cuisines, operating areas, ratings, contact details, menu categories, prices, dietary labels, and other relevant attributes within a centralized database. -
Menu and Nutrition Intelligence
Our solution extracted menu-level information, including item names, descriptions, prices, ingredients, portions, nutritional values, dietary classifications, and allergen indicators wherever available. Standardized fields enabled the client to compare products across brands, cities, cuisines, and healthy-food categories more efficiently. -
Structured Competitive Intelligence Database
We transformed raw scraped information into an analytical dataset using data cleaning, deduplication, categorization, normalization, and validation processes. This enabled the client to benchmark competitors, identify emerging healthy food concepts, analyze pricing patterns, evaluate geographic gaps, and monitor changes across the market.
Project Data Snapshot
| Data Category | Records Collected | Cities Covered | Key Attributes Captured | Update Frequency |
|---|---|---|---|---|
| Healthy Restaurants | 18,750 | 42 | Name, location, cuisine, rating, contact | Monthly |
| Cloud Kitchens | 9,680 | 38 | Brand, kitchen location, cuisine, delivery area | Biweekly |
| Menu Items | 146,500 | 42 | Item, category, price, description | Weekly |
| Nutrition Records | 58,400 | 35 | Calories, protein, carbs, fat | Monthly |
| Ingredient Records | 91,200 | 40 | Ingredients, composition, portion | Monthly |
| Dietary Products | 37,850 | 39 | Vegan, keto, gluten-free, low-carb | Weekly |
| Allergen Indicators | 24,600 | 36 | Dairy, nuts, gluten, soy, etc. | Monthly |
| Restaurant Ratings | 72,300 | 42 | Rating, review count, platform | Weekly |
| Price Records | 128,900 | 42 | Item price, category, size | Weekly |
| Location Attributes | 28,430 | 42 | Locality, city, operating area | Monthly |
The numerical figures above are representative project figures intended to demonstrate the structure and scale of the case study.
Methodologies Used
-
Automated Web Data Extraction
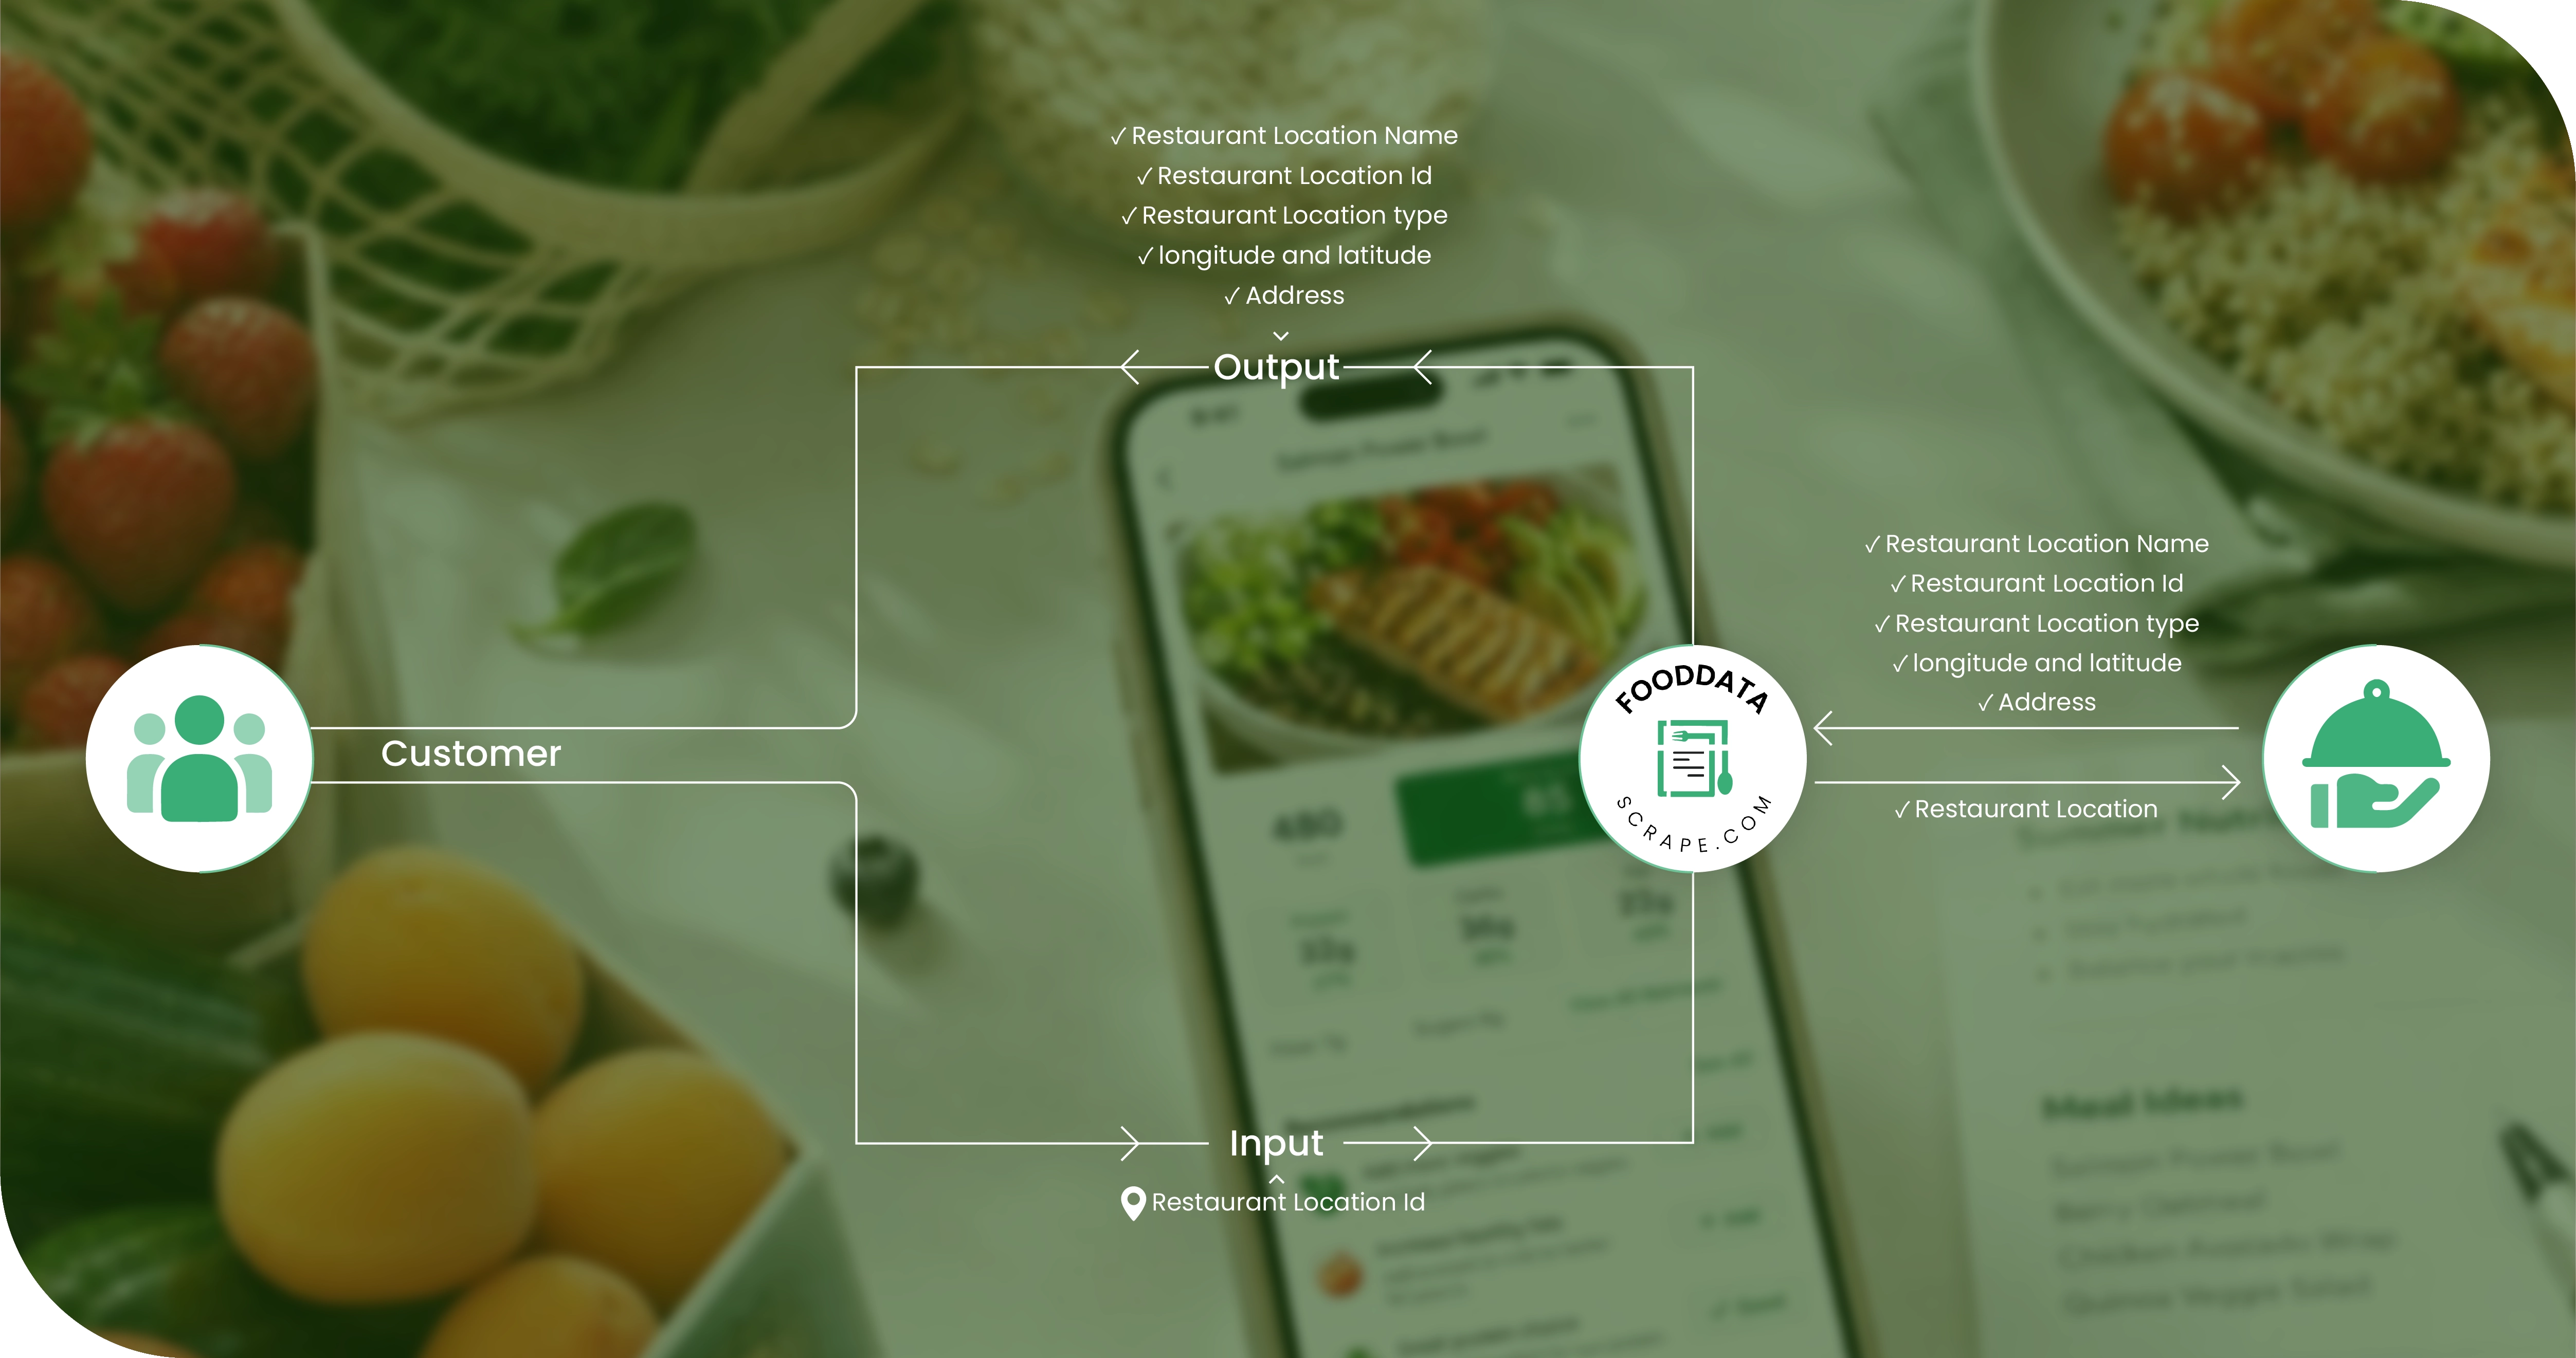
We deployed automated extraction workflows to collect large volumes of restaurant, cloud kitchen, menu, ingredient, pricing, and nutrition information from relevant digital sources. Automated collection reduced manual research requirements while enabling consistent retrieval of structured information across multiple geographic markets and business categories. -
Data Normalization and Standardization
Collected records were converted into standardized formats to ensure consistent naming conventions, pricing structures, location fields, menu categories, dietary classifications, and nutritional attributes. This methodology made records easier to compare, search, filter, aggregate, and analyze across different restaurants and geographic locations. -
Entity Matching and Deduplication
Duplicate restaurant listings and repeated menu records can significantly distort market analysis. We applied entity matching and deduplication techniques to identify overlapping records, variations in business names, repeated locations, and duplicate menu entries, improving database consistency and analytical reliability. -
Dietary and Nutrition Classification
Menu items were classified according to available dietary and nutritional attributes such as vegan, vegetarian, keto, gluten-free, high-protein, low-carb, and other specialty categories. This structured classification helped transform unorganized menu descriptions into usable intelligence for health-focused market analysis. -
Continuous Data Monitoring
Because restaurant menus, prices, locations, ratings, and operating models change frequently, we established recurring data collection cycles. Continuous monitoring helped the client identify new businesses, detect menu changes, observe pricing movements, and maintain a more current and actionable restaurant intelligence database.
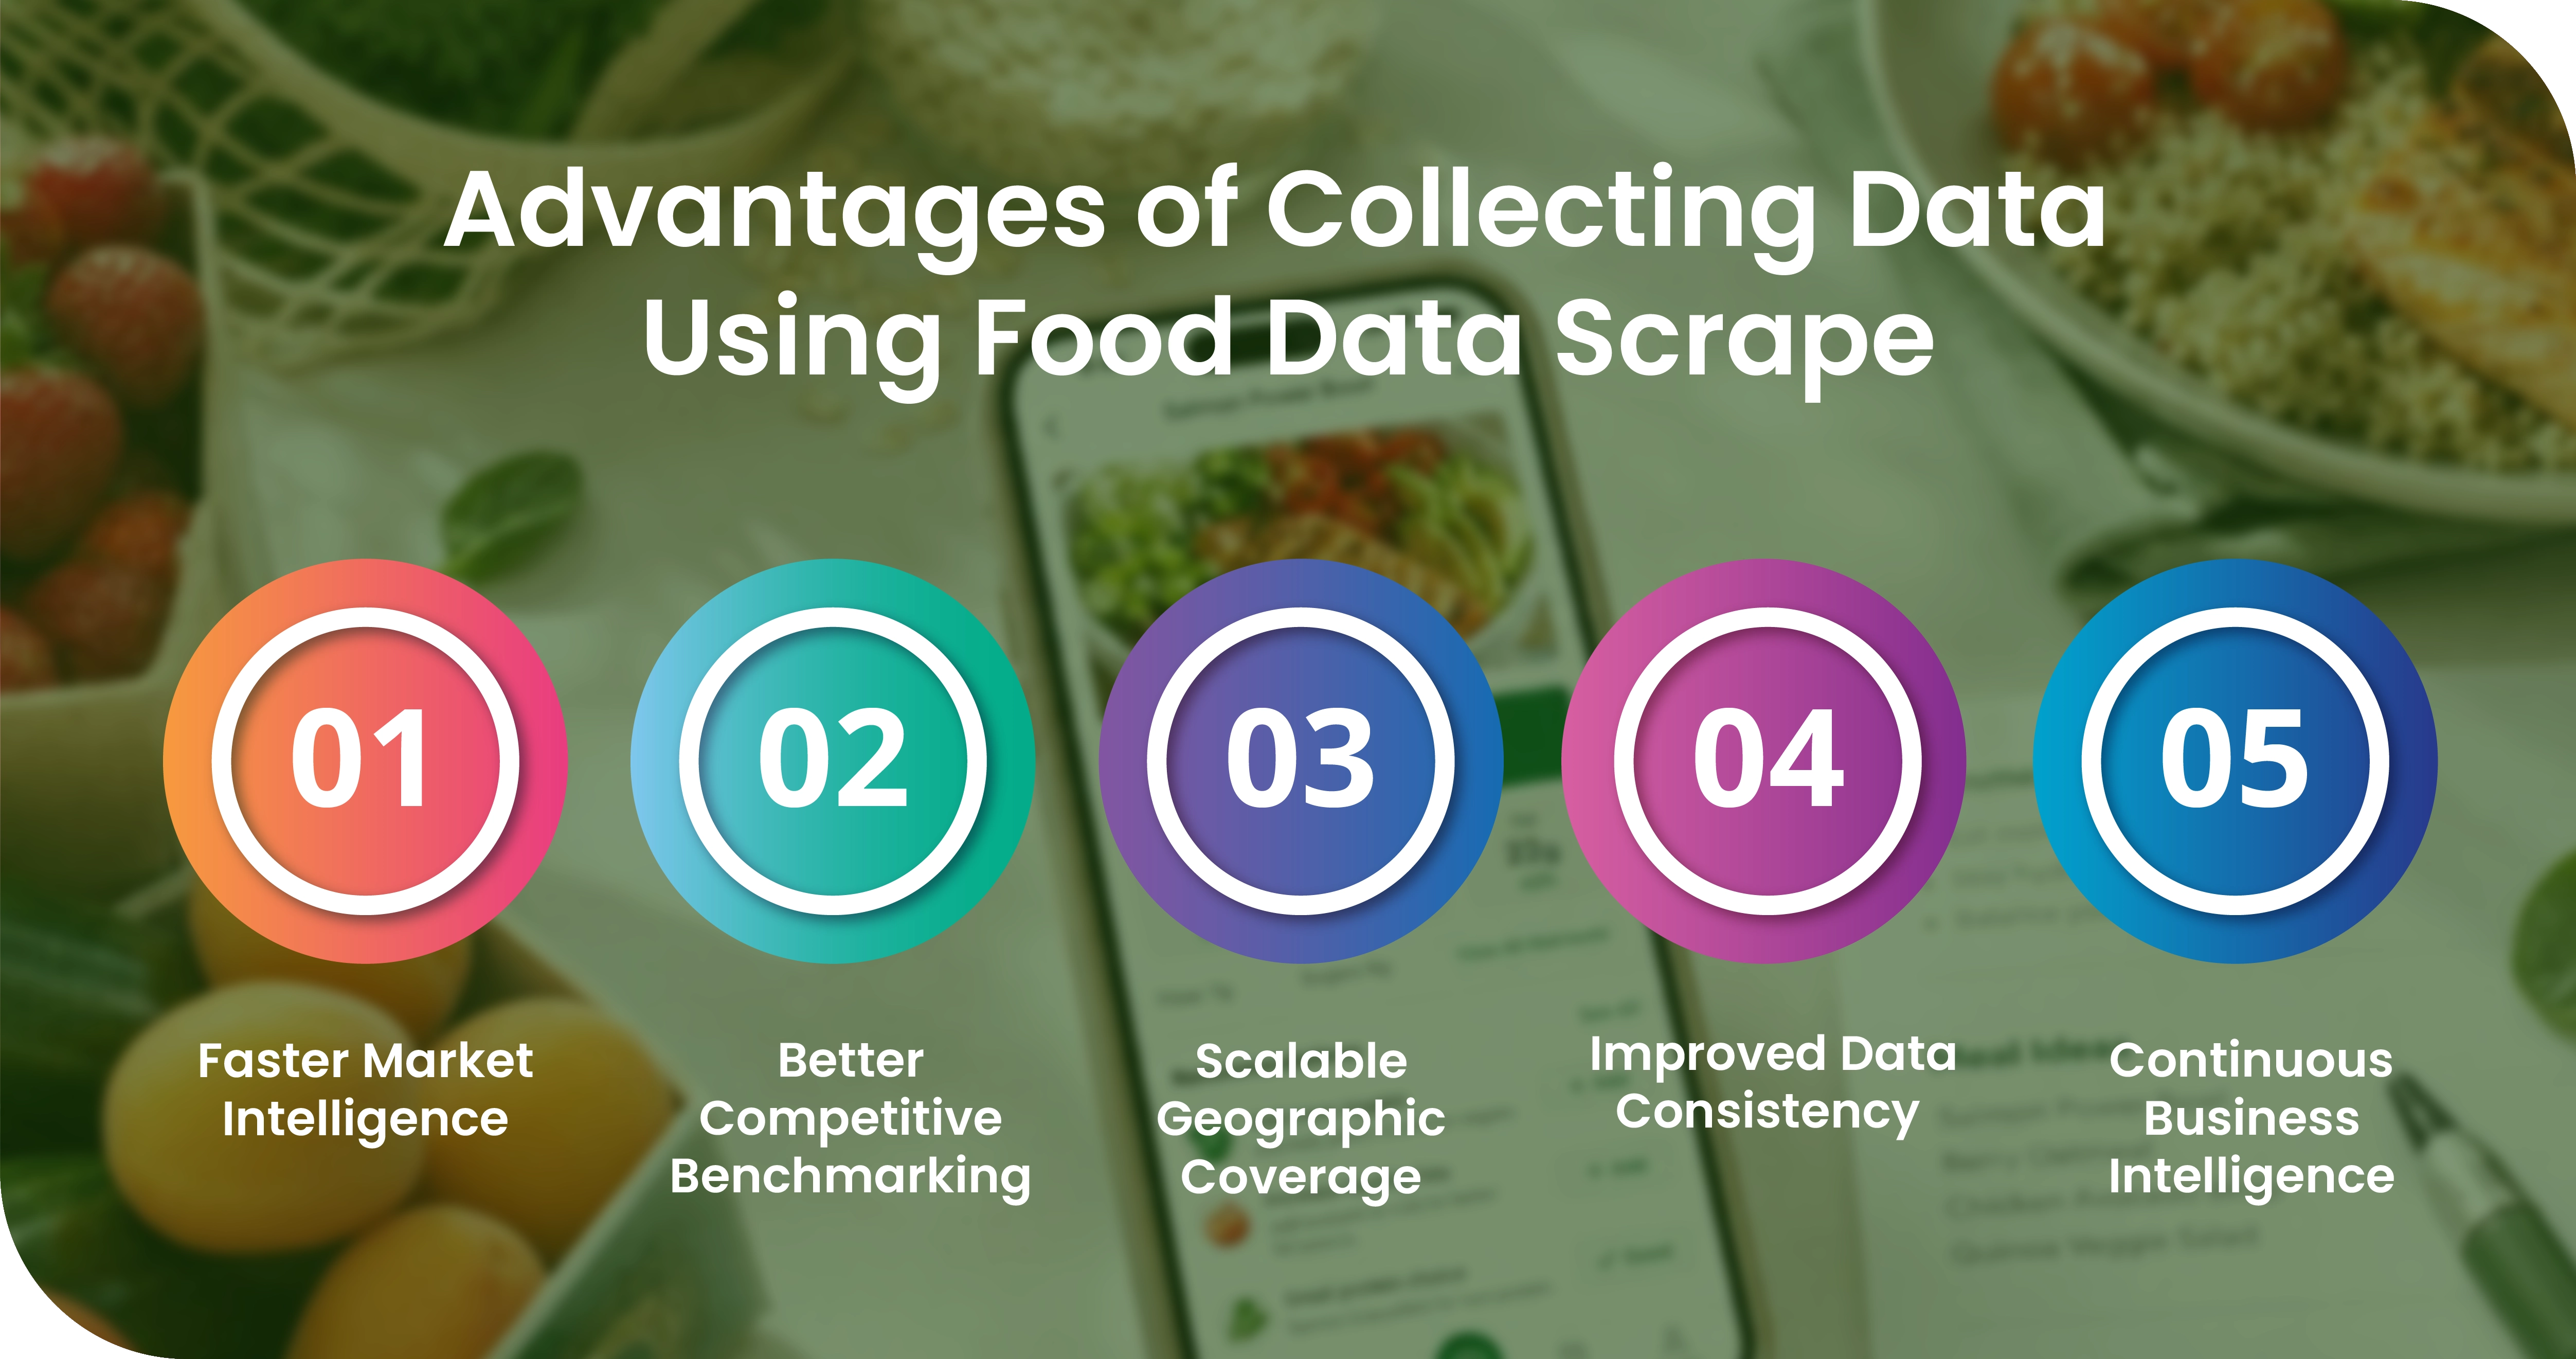
Advantages of Collecting Data Using Food Data Scrape
-
Faster Market Intelligence
Automated food data collection allows businesses to gather thousands of restaurant and menu records significantly faster than conventional manual research. Structured datasets provide analysts with timely information for market evaluation, competitor benchmarking, pricing analysis, geographic studies, and healthy food trend identification. -
Better Competitive Benchmarking
Scraped restaurant data enables detailed comparisons of competitors based on menu size, pricing, cuisines, dietary positioning, ratings, ingredients, locations, and product categories. Businesses can identify competitive gaps, understand market positioning, and make evidence-based decisions regarding their own offerings. -
Scalable Geographic Coverage
Our scraping approach enables businesses to expand research from individual cities to multiple regions without proportionally increasing manual research resources. This scalability supports nationwide restaurant discovery, cloud kitchen mapping, market expansion analysis, and location-based competitive intelligence across India's diverse food ecosystem. -
Improved Data Consistency
Automated extraction combined with normalization and validation creates a consistent database structure. Standardized fields allow teams to compare restaurants, menu items, prices, ingredients, and dietary attributes more efficiently while reducing inconsistencies commonly associated with manually collected information. -
Continuous Business Intelligence
Recurring scraping enables organizations to track market changes instead of relying on one-time research. Updated information can reveal new competitors, changing menu prices, newly introduced dietary products, shifting ratings, expanding delivery areas, and emerging healthy food concepts that influence strategic planning.
Client's Testimonial
"The structured restaurant and cloud kitchen database gave our research team a much clearer understanding of India's healthy food landscape. Previously, information about menus, ingredients, dietary categories, pricing, and locations was scattered across numerous sources, making analysis slow and difficult. The data scraping solution brought these elements together into a standardized and highly usable dataset. We particularly valued the ability to compare businesses across cities and identify healthy food concepts based on their menus and specialty offerings. The recurring data collection process also helped us monitor market changes without repeatedly conducting extensive manual research. The quality and organization of the data significantly improved our research workflow and allowed our team to focus more on analysis and strategic insights rather than data collection."
—Head of Market Intelligence, Client Organization
Final Outcome
The project delivered a scalable and structured database covering healthy restaurants, cloud kitchens, menu items, ingredients, nutrition attributes, dietary categories, pricing, ratings, and geographic information across multiple Indian markets. The client gained improved visibility into competitive positioning and could identify market opportunities using standardized restaurant-level and menu-level information. The solution also supported Cloud & Dark Kitchen Tracking, enabling better understanding of delivery-focused business models and geographic expansion patterns. Structured information around Nutrition & Allergen Compliance helped organize available nutritional and allergen-related attributes for analytical purposes. Through recurring Food Data Scraping Services, the database could be refreshed as menus, prices, restaurants, and operating areas changed. Overall, the project reduced dependence on manual research, improved data accessibility, strengthened competitive intelligence capabilities, and provided the client with a scalable foundation for market research, business expansion, product benchmarking, and strategic decision-making within India's growing healthy food industry.



