
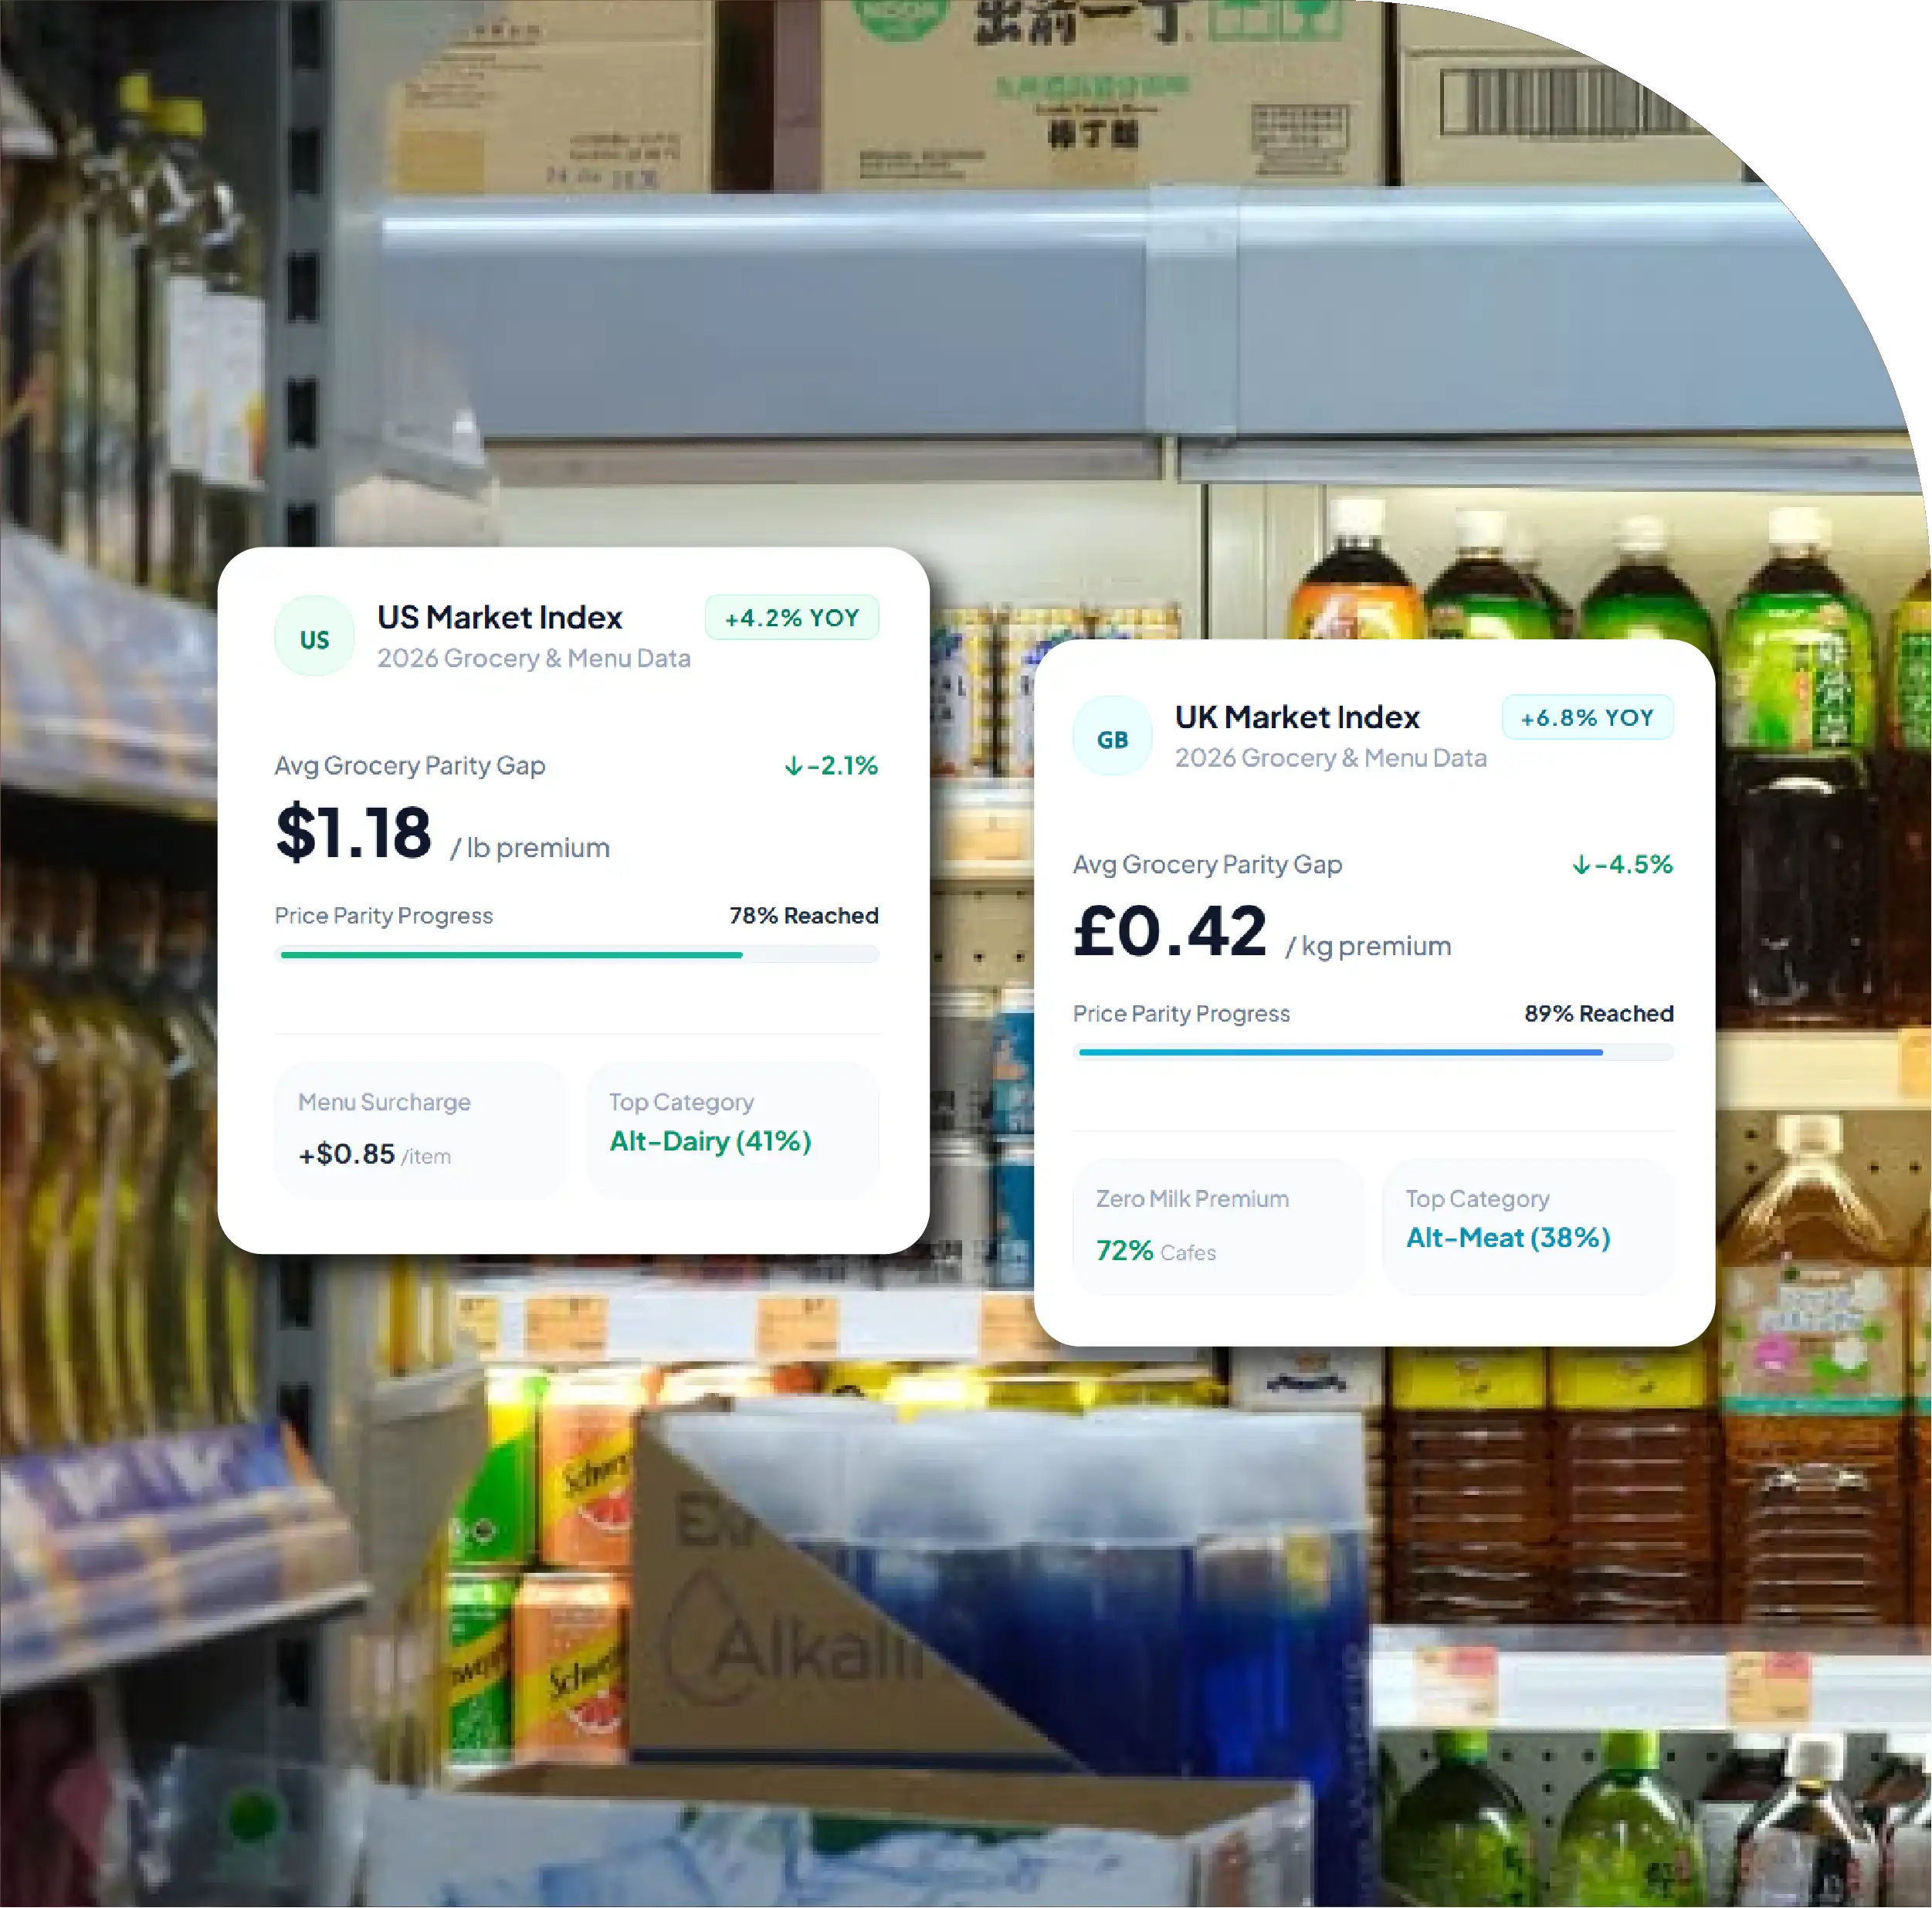
Market Size: US sales reached $7.9 billion in 2025.
UK Market: Sales declined 1.2% to £847.8 million.
Category Trends: Meat alternatives declined, while plant-based milk remained resilient.
Price Gap: UK plant-based meat cost 34% more per kg than conventional meat.
Data Insights: Track menu availability, pricing, promotions and private-label products.

Plant-based food market data in 2026 shows a market that is flat in value, but changing fast underneath. US plant-based retail sales held at about $7.9 billion in 2025. UK sales dipped 1.2% to £847.8 million. Meat alternatives are shrinking, while milk, tofu and drinks hold up. Prices, not demand, now set the pace.
On delivery apps, plant-based food market data means vegan menu items per restaurant, their share of the menu and their price against the matching meat dish. On grocery shelves, it means price per kg versus meat, promo depth, range counts and private label.
This report pulls together the latest public plant-based food market data from the Good Food Institute (GFI), GFI Europe and the Plant Based Foods Association (PBFA). Every figure below is cited. Where no public figure exists, the table says so and shows how a menu or grocery scrape measures it.
The early plant-based boom has given way to a slower, price-sensitive market. In the US, plant-based food retail sales were $3.9 billion in 2017 and reached $7.9 billion in 2025, according to the GFI 2026 State of the Industry report using SPINS data. But 2025 sales fell 2% in dollars and 3% in units against 2024.
Plant-based meat sales drove most of the decline. US plant-based meat and seafood sold $1 billion at retail in 2025, down 10% in dollars and 11% in units. Plant-based milk held at $2.7 billion, down 2%. Tofu, tempeh, seitan and ready-to-drink plant protein drinks grew instead.
The UK tells a similar story. GFI Europe's Circana-based analysis shows six-category plant-based sales of £847.8 million in 2025, down 1.2%. Plant-based meat fell 7.3% in value and 9.4% in volume. Plant-based milk was the one category to grow in value, up 0.5%.
For brands and retailers, this means plant-based food market data is now less about headline growth and more about where value is moving. Plant-based food market data tracked by category, retailer and price point separates a shrinking range from a growing one.
| Year | Market | Metric | Value | Source |
|---|---|---|---|---|
| 2017 | US | Plant-based food retail sales | $3.9 billion | GFI State of the Industry 2026 |
| 2024 | US | Plant-based food retail sales | $8.0 billion | PBFA / PBFI regional report |
| 2025 | US | Plant-based food retail sales | $7.9 billion (-2% dollars, -3% units) | GFI State of the Industry 2026 |
| 2025 | US | Plant-based meat and seafood retail sales | $1.0 billion (-10% dollars) | GFI State of the Industry 2026 |
| 2025 | UK | Plant-based retail sales, six categories | £847.8 million (-1.2%) | GFI Europe UK insights 2024–2025 |
| 2025 | UK | Plant-based meat retail sales | £294.6 million (-7.3%) | GFI Europe UK insights 2024–2025 |
Restaurant menus matter in plant-based food market data because 22% of plant-based meat consumers first tried it in a restaurant, says GFI's 2026 foodservice report. Yet menu coverage is thin.
GFI checked the menus and online ordering of the top 250 US chains by revenue in five zip codes. Only 8% of chains offered a plant-based meat analog dish. Another 7% offered only other plant-forward proteins such as tofu or veggie patties. 85% had no plant-based protein dish at all, even though the chains with one cover 28% of locations.
That is chain-level data. Delivery apps add item-level plant-based food market data: vegan menu items per restaurant, their share of the menu and tags such as "vegan", "plant-based" or "V". Weekly scrapes also show items that vanish, an early sign of range cuts.
For the UK, we found no current public plant-based food market data on menu share for Deliveroo, Uber Eats or Just Eat. A scraped dataset fills this gap.
| Menu metric | US (latest public figure) | UK (latest public figure) | Source / how it is measured |
|---|---|---|---|
| Top chains with a plant-based meat analog dish | 8% of top 250 chains (2025) | No chain-share figure published; all 5 major fast-food chains reviewed had meat-style plant-based items (Feb 2023) | GFI (via vegconomist); ProVeg UK Fast-Food Ranking 2023 |
| Chains with no plant-based protein dish | 85% (2025) | Not published | GFI (via Green Queen) |
| Restaurants offering plant-based dishes | 48.8% (PBFA and Menu Trends, 2023 report) | Not published | Vegan Food & Living |
| Vegan items per menu and share of menu items | Not published | Not published | Measured by tagging "vegan" / "plant-based" items on delivery-app menus |
Counting items is the start. The more useful signal in plant-based food market data is price, because diners notice when a vegan burger costs more than the beef one.
US foodservice data shows the gap clearly. GFI's analysis of Circana SupplyTrack distributor data shows plant-based meat analogs and milk are priced 60% to 70% higher per pound than conventional versions. The gap narrowed slightly in 2025, mainly because conventional meat got more expensive.
Distributor sales show where operators are leaning. Plant-based protein sales to US foodservice fell to $291 million in 2025, down 7%. Plant-based milk rose 16% to $288 million and now holds 13% of milk pound sales in broadline distribution. So plant-based menu trends are now led by milk and creamer, not meat analogs.
On delivery apps, the matching plant-based food market data point is the menu price premium: a plant-based dish against the closest meat dish from the same restaurant, such as a plant-based burger against the beef burger.
| US foodservice category | 2021 | 2022 | 2023 | 2024 | 2025 |
|---|---|---|---|---|---|
| Plant-based proteins ($ million) | 306 | 338 | 326 | 312 | 291 |
| Plant-based milk ($ million) | 176 | 188 | 226 | 248 | 288 |
| Plant-based creamer ($ million) | 121 | 141 | 174 | 182 | 189 |
| Plant-based cheese ($ million) | 33 | 36 | 34 | 31 | 27 |
Source: GFI, U.S. foodservice market insights for plant-based foods 2021–2025 (Circana SupplyTrack, broadline distributors).
For plant-based food market data on price, GFI puts the 2025 foodservice premium at about 65% per pound for plant-based meat and 46% for veggie burgers, while tofu and tempeh were 41% cheaper than meat (Green Queen). These are distributor prices, not menu prices. We found no public year-by-year series for menu or delivery-app price premiums in the US or UK.
The plant-based price premium is a major barrier for shoppers. The latest plant-based food market data shows it is narrowing, but not evenly.
In the UK, GFI Europe tracked 131 plant- and animal-based products on Tesco online from January to June 2026. Plant-based meat cost 34% more per kg on average at full price, and 28% more with loyalty prices. It averaged £12.49 per kg. Sausages and chicken alternatives carried the largest gaps, while beef alternatives were cheaper than beef.
An earlier GFI Europe check (published April 2026) found plant-based mince 29% cheaper than beef, lamb and pork mince at Tesco, and meatballs 41% cheaper. Burgers went the other way: beef burgers were 9% cheaper than plant-based ones.
In the US, plant-based beef carried an 8% premium over conventional beef in 2025, down from 14% in 2024, says GFI. But most other plant-based categories still cost two to four times as much per pound, gallon or dozen. In the UK, plant-based milk was 72% more expensive per litre than dairy milk in 2025.
| Category and market | Plant-based vs animal price | Period | Source |
|---|---|---|---|
| UK plant-based meat, overall (Tesco) | +34% per kg (+28% with loyalty price) | Jan–Jun 2026 | GFI Europe, via Protein Production Technology |
| UK sausages vs pork sausages | +40.7% (+33.3% loyalty) | Jan–Jun 2026 | GFI Europe, via Protein Production Technology |
| UK chicken alternatives vs chicken | +35.4% (+30.3% loyalty) | Jan–Jun 2026 | GFI Europe, via Protein Production Technology |
| UK beef alternatives vs beef | -8.4% (cheaper) | Jan–Jun 2026 | GFI Europe, via Protein Production Technology |
| UK plant-based mince vs meat mince (Tesco) | -29% (cheaper) | Q1 2026 | GFI Europe blog |
| UK plant-based milk vs dairy milk | +72% per litre | 2025 | GFI Europe UK insights |
| US plant-based beef vs conventional beef | +8% (14% in 2024) | 2025 | GFI State of the Industry 2026 |
| US plant-based meat vs conventional meat, all categories | +77% per lb (+65% in 2022) | 2023 | GFI and NIQ |
| UK own-label plant-based sausages vs meat sausages, six retailers | £5.60–10.80/kg vs £3.30–5.40/kg | Aug–Oct 2022 | Which? |
| UK plant-based protein vs meat, per calorie | +56% | 2026 | Food Foundation Broken Plate 2026, via Natural Newsdesk |
These figures come from different studies and methods, so treat them as direction, not a ranking. Weekly plant-based food market data across several grocers gives one consistent method for meat alternatives grocery prices.
Price premiums tell only half the story. Promotions, range size and own-label lines are the next layer of plant-based food market data.
Private label is a key lever in plant-based food market data. In the UK, own-label plant-based meat was 38% cheaper per kg than branded in 2025, yet its volume share fell from 13.1% to 12.2%, according to GFI Europe. Across all six categories, private label held 16.9% of volume but only 9.9% of value. In plant-based milk, the premium over dairy was 22% for branded products and 40% for private label.
Promotions are harder to find. The GFI Europe UK report has no promotion figures. A scraped grocery feed records shelf price, promo price, multibuy and loyalty price for each SKU, each week.
Range data matters too. Fewer plant-based meat SKUs on shelf can signal falling sales, and new tofu or protein-drink listings show where retailers shift space. Household reach is the outcome to watch: 31.2% of UK households bought plant-based meat in 2025, down from 35.4% in 2023, while just over 11% of US households bought it at retail.
| Shelf metric | UK | US | Data source |
|---|---|---|---|
| Private label share of plant-based meat volume | 12.2% (2025, down from 13.1%) | Not published (GFI added private label to its SPINS data in 2025 but gives no share) | GFI Europe UK insights; GFI |
| Own-label vs branded price, plant-based meat | 38% cheaper per kg | Not published | GFI Europe UK insights |
| Average plant-based meat price | £9.67/kg (2025) | Not published per kg | GFI Europe UK insights |
| Households buying plant-based meat | 31.2% (2025) | Just over 11% (2025) | GFI Europe / GFI SOTI |
| Effect of promotions on plant-based beef units | Not published | 10% discount: about +20% units; discount plus feature: about +80% | GFI and NIQ, Nov 2024 |
| Share of SKUs on promotion and promo depth | Not published | Not published | Measured by a weekly shelf scrape |
| Refrigerated meat-alternative items per store | Not published | 9.7 (Apr 2025), down 10.3% year on year and 31% since early 2021 | 210 Analytics / Circana, via AgFunderNews |
UK and US plant-based food market data share a direction but differ in detail. In both, meat alternatives lose ground while milk, tofu and drinks hold up, and meat inflation helps plant-based look better value.
The differences sit in channels and labelling. UK grocers lean on own-label and loyalty pricing, so Clubcard-style prices need tracking alongside shelf prices. US plant-based retail is spread across more channels, and the South takes 36% of US plant-based spend, says the PBFA regional report. In US restaurants, plant-based milk is growing far faster than meat alternatives.
For a brand in both markets, one dataset with matched categories, units (per kg and per lb) and currency makes comparison possible. It also helps allergen and specialty-diet teams, since vegan claims sit next to "contains soy" or "gluten-free" tags.
| Signal | UK (latest public figure) | US (latest public figure) |
|---|---|---|
| Total plant-based retail sales | £847.8m, 2025 (-1.2%) | $7.9bn, 2025 (-2%) |
| Plant-based meat trend | -7.3% value, 2025 | -10% dollars, 2025 |
| Plant-based milk trend | +0.5% value, 2025 | -2% dollars retail; +16% in foodservice, 2025 |
| Plant-based meat price vs meat | +34% per kg at Tesco, H1 2026 | Plant-based beef +8%, 2025 |
| Plant-based meat on restaurant menus | No chain-share figure published | 8% of top 250 chains, 2025 |
| Plant-based meat range on shelf | Not published | 9.7 refrigerated items per store, -10.3%, Apr 2025 |
1. Delivery-app menu tracking: We collect public menu data from apps such as Uber Eats, DoorDash, Deliveroo and Just Eat, then tag vegan menu items and plant-based dishes by keyword and label. This turns menus into plant-based food market data you can compare week by week. See our restaurant menu data scraping service.
2. Matched plant-based vs meat pricing: We pair each plant-based item with its closest meat equivalent, on menus and on shelves, and report the price premium per item, per kg and per lb. Our real-time price monitoring runs this on a daily or weekly schedule.
3. Promo, range and private label feeds: Weekly shelf scrapes add grocery-side plant-based food market data: shelf price, promo price, loyalty price, multibuy offers, SKU counts and own-label flags. Learn more about promo and discount monitoring.
4. Specialty-diet and allergen fields: We extract vegan, dairy-free and gluten-free claims plus allergen tags from product pages and menus. See health and specialty-diet data scraping and nutrition and allergen compliance.
5. Clean delivery and responsible collection: Data arrives as CSV, JSON, API or dashboard. We collect only public business data and respect robots.txt, site terms and rate limits. Restaurant sales volumes are not public, so we offer labelled proxies such as rating counts and "popular" badges.
The latest plant-based food market data shows a market that is no longer growing on hype. US and UK sales are roughly flat. Meat alternatives are shrinking, and plant-based milk, tofu and drinks are holding ground. The price gap is closing in some categories, such as mince, but stays wide in sausages, chicken alternatives and milk.
Public studies set the direction, but not what is on rivals' menus or shelves this week. Item-level plant-based food market data from menus and grocers does. Use the "Download Research Report" form on the right for a sample, or contact our data team to scope a free pilot for your categories and markets.
Questions
It covers how plant-based products sell and are priced: retail and foodservice sales, prices versus meat or dairy, promotions, SKU ranges, private label and menu listings. Sources include GFI and PBFA reports and scraped menu and grocery data.
The latest full-year figure is for 2025. US plant-based retail sales were $7.9 billion, down 2% in dollars from 2024, according to GFI's 2026 State of the Industry report using SPINS data.
On average, yes. GFI Europe found plant-based meat cost 34% more per kg than animal meat at Tesco from January to June 2026. Beef alternatives and mince were cheaper than the meat versions, while sausages and chicken alternatives cost more.
Plant-based meat sales fell 10% in US retail dollars and 7.3% in UK value in 2025. Price premiums and lower household reach are key factors, while tofu, tempeh and plant-based drinks grow.
Scrape public menus on a set schedule, tag items using labels and keywords such as "vegan" or "plant-based", and count them per restaurant. Then match each item to a similar meat dish to calculate the menu price premium.
Yes. Food Data Scrape can collect public shelf prices, promo prices and SKU details from UK and US grocers, normalised to price per kg and per lb, delivered weekly as CSV, API or dashboard.