
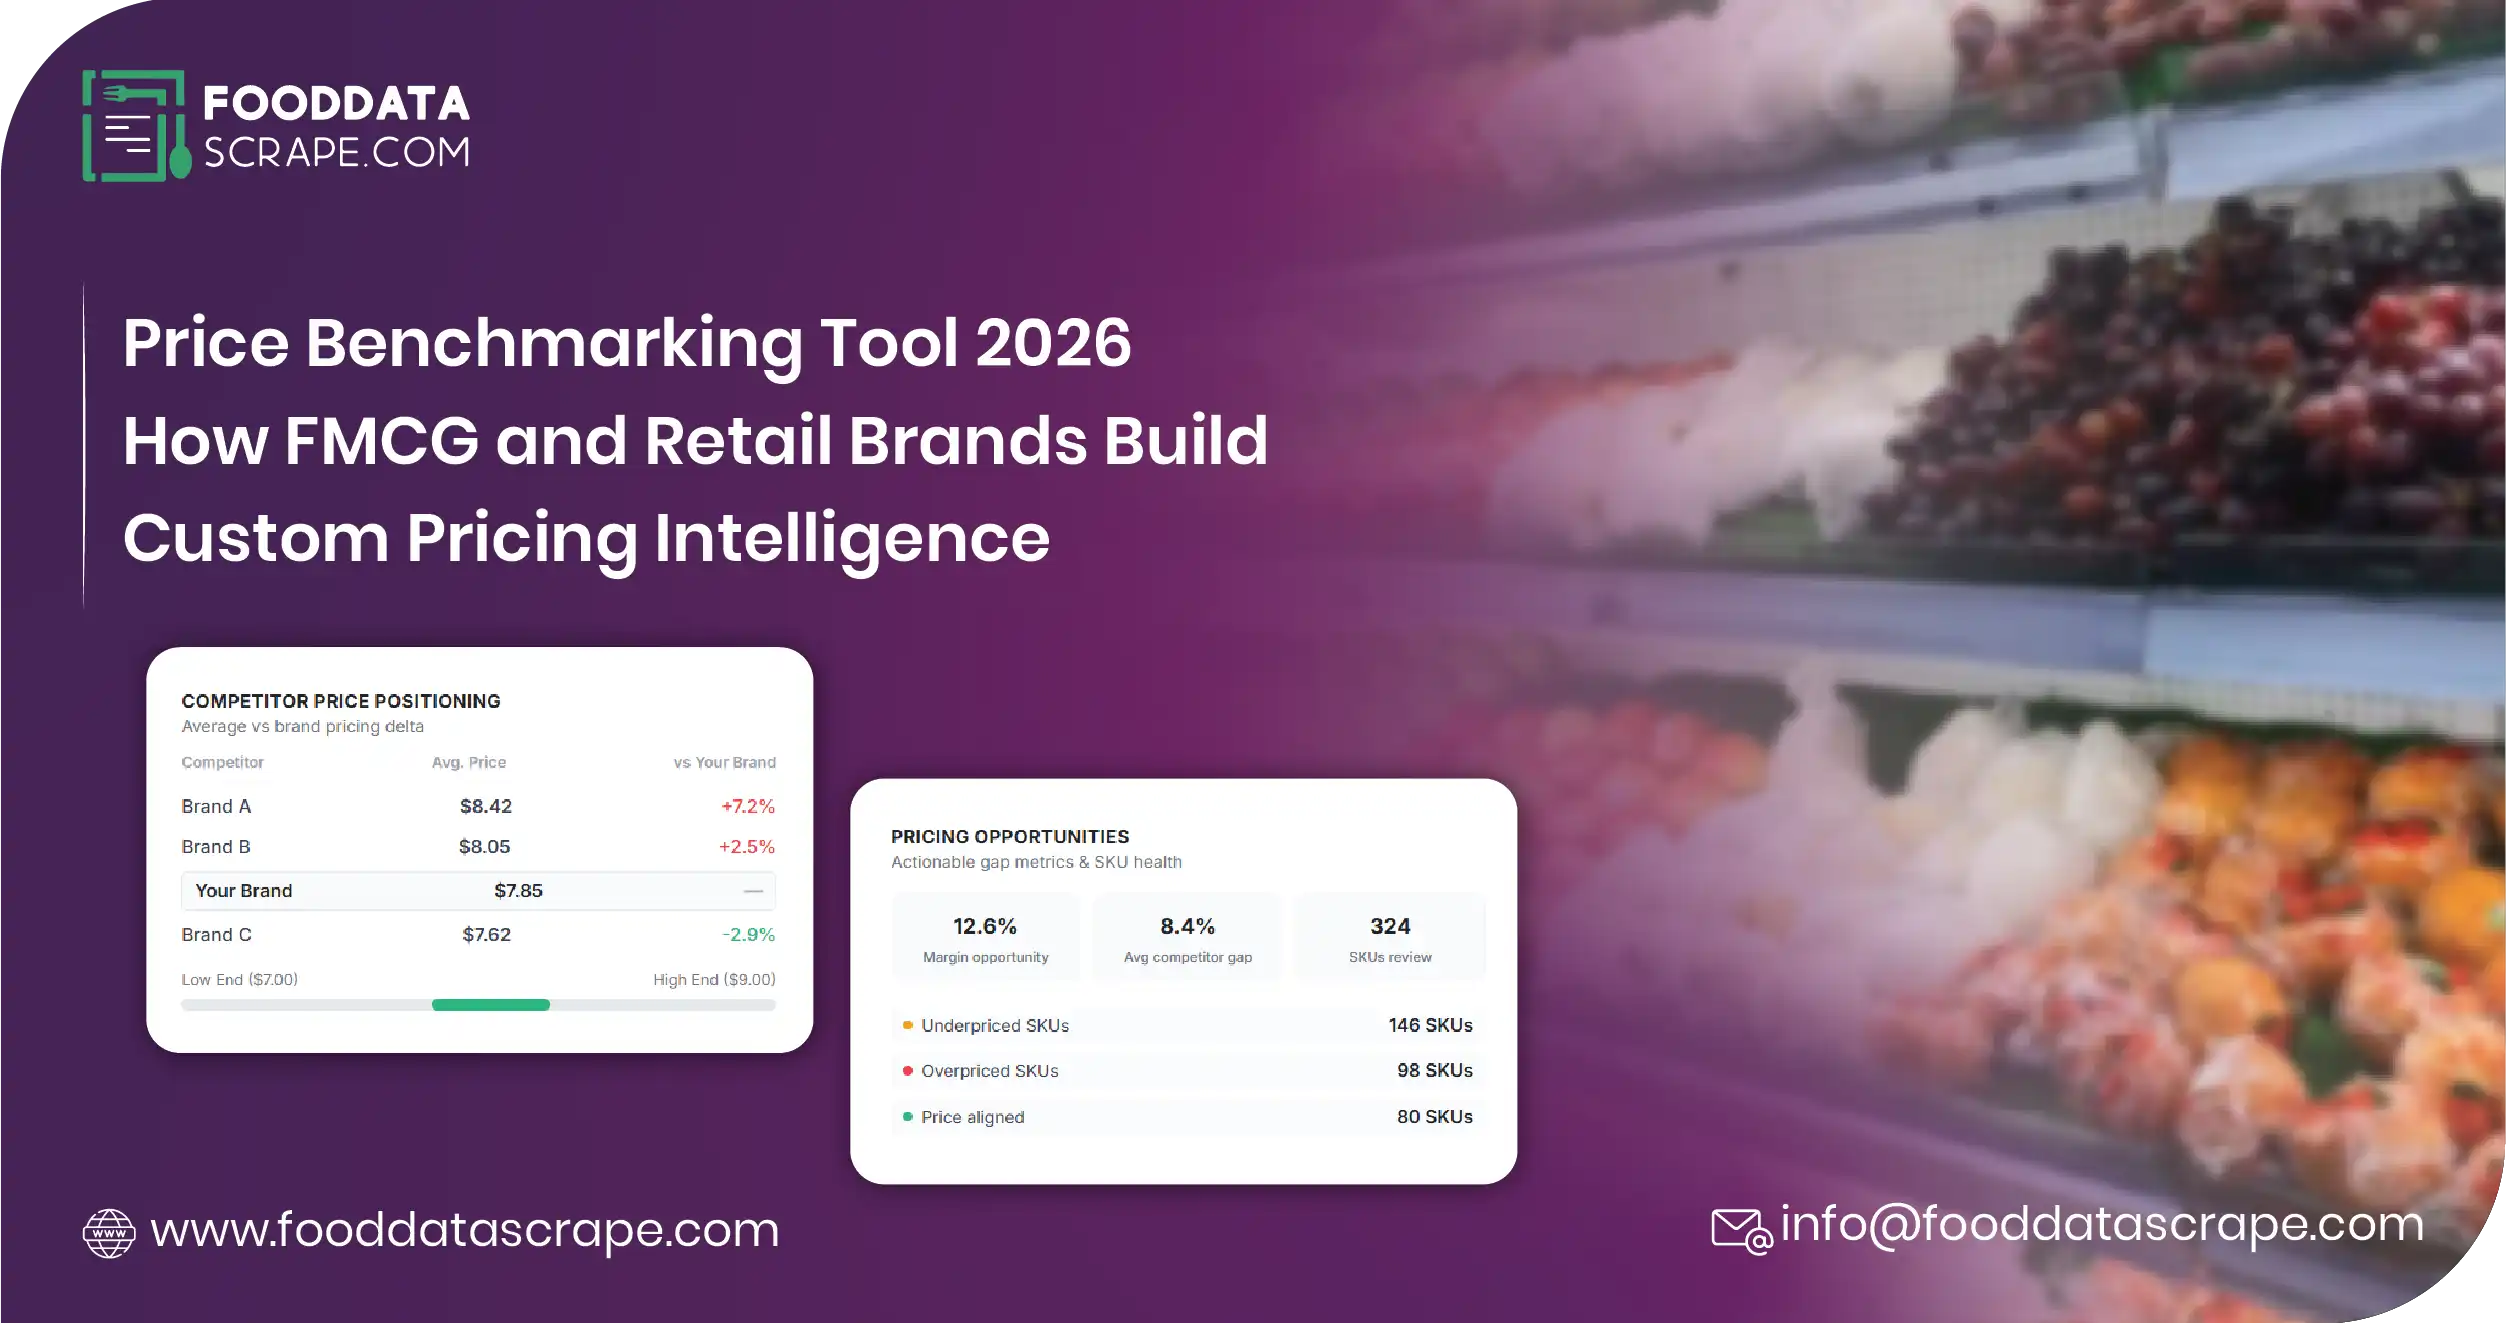
Introduction — Why a Price Benchmarking Tool Is a 2026 Commercial Imperative
FMCG and retail brands entered 2026 facing a fundamentally new pricing environment. Inflation-driven cost pressure has forced structural repricing across categories, private-label penetration has crossed 25% in most European grocery baskets, and shopper price sensitivity has hardened into a permanent behavioral shift rather than a cyclical response. In this environment, pricing decisions made with quarterly panel data or manual retail audits are no longer competitive — they are structurally disadvantaged.
This is exactly the problem that a modern retail benchmarking platform solves. When FMCG brands and retailers deploy custom pricing intelligence solution architectures, they gain the daily-refreshed, category-specific, channel-comparable competitive visibility their commercial teams need to protect margin while defending share against private-label and challenger brands.
This guide breaks down how pricing leaders at multinational FMCG brands, regional retailers, and specialty categories build a custom pricing benchmarking capability in 2026 — with the specific architecture, data scope, buyer archetypes, and rollout methodology that turns pricing intelligence from a monthly report into a live commercial capability. Examples throughout reference Finland and the broader Nordics as a representative advanced-market case, but the framework applies globally.
The 2026 Pricing Landscape — Three Structural Shifts
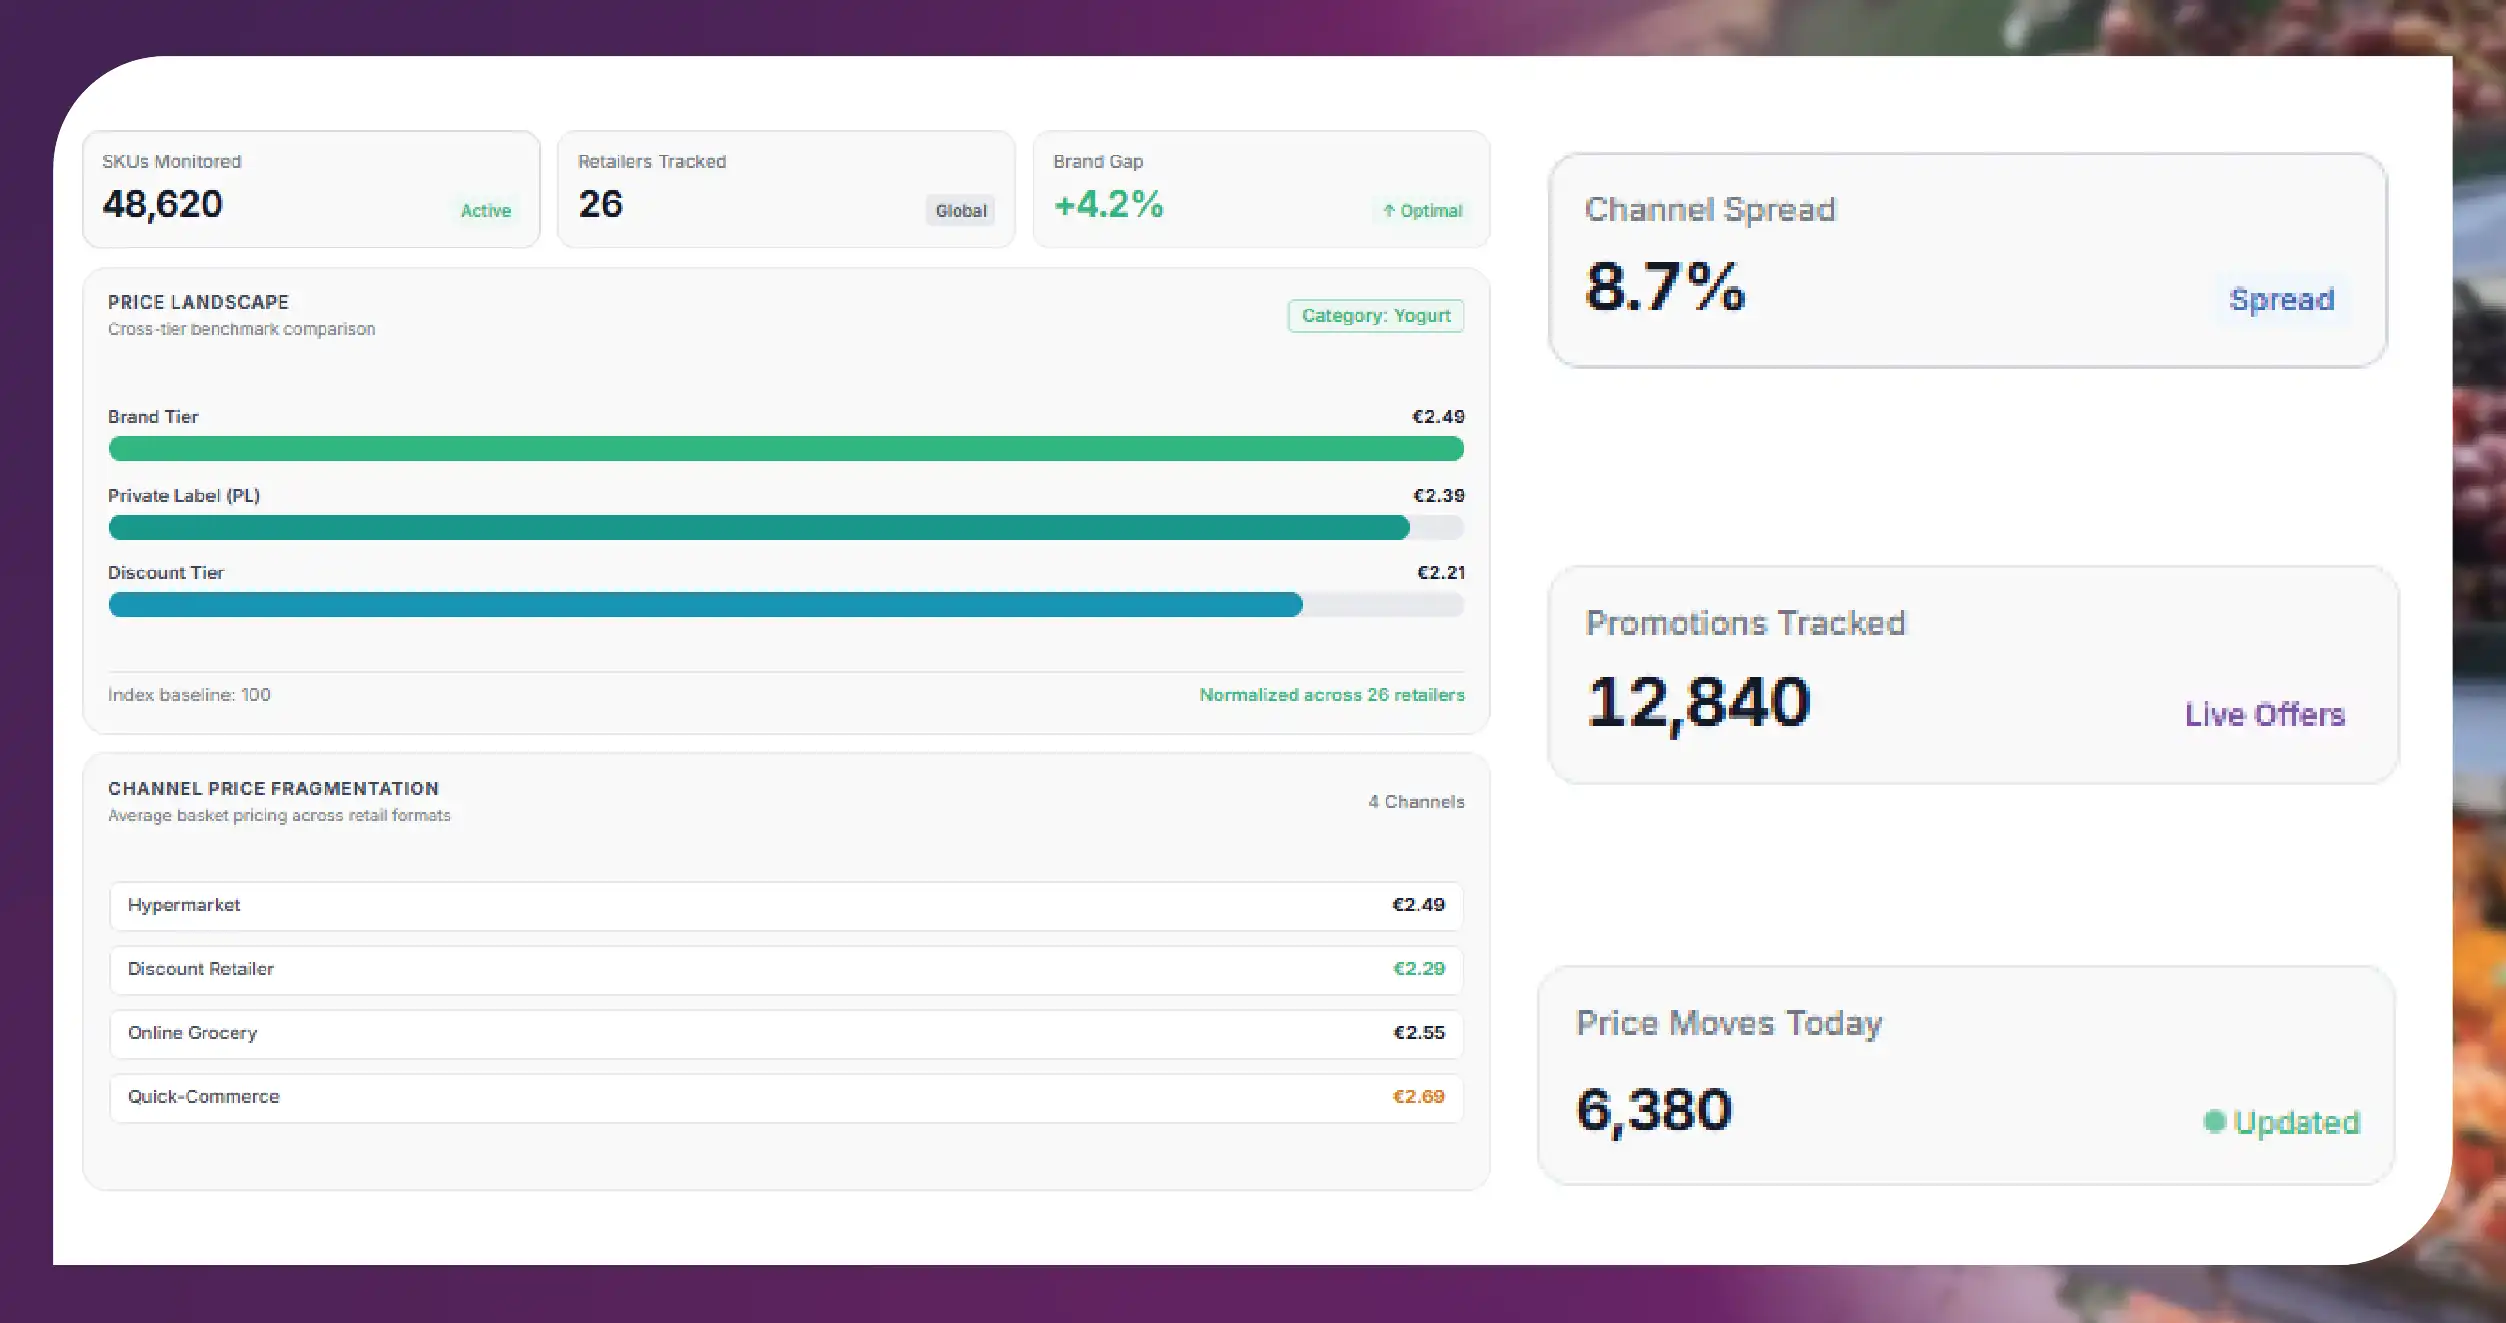
Three shifts have made continuous price benchmarking essential in 2026, and each one increases the return on a properly designed retail price benchmarking software platform.
1. Private-label has moved from tactical to strategic threat. In the Nordics — Finland's K-Group, S-Group, and Lidl chains, along with regional discount formats — private-label share now exceeds 30% in staple categories and 40% in ambient grocery. Branded FMCG teams competing against private-label without daily private-label price monitoring are guessing at price gaps that shift weekly. A 4% widening of the branded-vs-private-label price gap in yogurt can cost a branded manufacturer 8-12 share points within a quarter, and by the time it appears in Nielsen panel data 6-8 weeks later, the damage is already done.
2. Channel-specific pricing has fragmented the single price concept. The same branded pasta SKU can now sit at three different effective prices in the same city on the same day — one at the traditional hypermarket, one at the discount format, one at the online grocery pure-play — with promotional overlays adding a fourth variable. Comprehensive FMCG competitor price tracking must capture all channels simultaneously, not just the dominant one, or the pricing team is optimizing against an incomplete picture.
3. E-commerce and quick-commerce price transparency has compressed decision cycles. When shoppers can compare prices across platforms in seconds, brands can no longer rely on retail-partner opacity to hold pricing corridors. E-commerce price benchmarking API integration into commercial dashboards has become the operational standard for brands with any meaningful digital shelf presence — which in 2026 means essentially every FMCG category.
The FMCG brands and retailers winning in 2026 are not those with the biggest marketing budgets — they are those with the fastest, cleanest visibility into how their category is actually priced across every channel their shoppers use.
What a Custom Pricing Intelligence Platform Delivers
A modern custom pricing intelligence solution is a data pipeline plus analytics layer that continuously captures competitor and channel-partner pricing across every relevant retail touchpoint — and delivers structured, decision-ready output to the client's commercial team via API, dashboard, or direct system integration.
A well-designed FMCG price monitoring platform captures:
- Per-SKU shelf price across every monitored retailer and channel
- Private-label equivalents and price-gap calculations at category level
- Promotional overlays (loyalty prices, multi-buy offers, weekly ad prices)
- Availability and out-of-stock signals per store and per SKU
- Pack-size and unit-price normalization for like-for-like comparison
- Store-level, ZIP-level, or region-level attribution based on client scope
- Cross-channel views (hypermarket, discount, online, quick-commerce)
- 24-hour, 12-hour, or 4-hour refresh cadence based on category volatility
- Historical time-series depth for elasticity modeling and trend analysis
The output is a clean, deduplicated data stream that plugs directly into the client's pricing team's decision workflow — replacing quarterly panel reports, manual retail audits, and delayed distributor feedback with continuous competitor pricing data services.
Sample Data — What Custom Pricing Intelligence Delivers
Below is a sample of the structured output a properly designed retail price comparison platform produces for a Finnish FMCG brand tracking 12 SKUs across five major Nordic retailers.
Sample 1 — Daily Multi-Channel Price Snapshot
| SKU | Retailer | Format | Shelf € | Promo € | Priv-Label € | Gap % |
|---|---|---|---|---|---|---|
| Oat Milk 1L | K-Ruoka | Hyper | 2.45 | 2.19 | 1.79 | +22.3% |
| Oat Milk 1L | S-market | Super | 2.49 | — | 1.85 | +25.7% |
| Oat Milk 1L | Lidl | Discount | 2.29 | 1.99 | 1.59 | +25.2% |
| Oat Milk 1L | Foodie.fi | Online | 2.55 | 2.25 | 1.89 | +26.0% |
| Yogurt 500g | K-Ruoka | Hyper | 3.29 | 2.79 | 2.19 | +27.4% |
| Yogurt 500g | S-market | Super | 3.35 | — | 2.25 | +32.8% |
| Yogurt 500g | Lidl | Discount | 3.09 | 2.59 | 1.99 | +30.2% |
| Coffee 500g | K-Ruoka | Hyper | 8.95 | 7.95 | 6.49 | +22.5% |
The sample reveals immediate commercial signals: the branded yogurt is now priced 30%+ above private-label at three of four retailers, up from a 22% baseline six months ago — a widening gap the brand's pricing committee needs to address before category share erosion accelerates. The oat milk sits in a healthier 22-26% corridor that private-label has not yet compressed. Coffee shows a promotional pattern (weekly €1 discount) that appears consistent across the K-Group format but is absent at S-market — potentially a trade-spend allocation issue the commercial team should investigate.
Sample 2 — 12-Week Price-Gap Trend Panel
| Category | Wk 1 Gap | Wk 4 Gap | Wk 8 Gap | Wk 12 Gap | Direction |
|---|---|---|---|---|---|
| Oat milk | +22.3% | +23.1% | +23.8% | +24.5% | Slow widening |
| Yogurt | +22.1% | +25.4% | +28.9% | +30.2% | Rapid widening |
| Coffee | +21.5% | +21.8% | +22.1% | +22.5% | Stable |
| Pasta | +18.2% | +18.5% | +18.1% | +17.9% | Stable |
| Frozen pizza | +19.5% | +20.1% | +21.8% | +23.4% | Widening |
| Cereal | +24.5% | +24.2% | +23.9% | +23.5% | Slight narrowing |
Twelve weeks of price-gap trend data tells the commercial team exactly where to focus. Yogurt is the emergency — an 8-point widening in 12 weeks signals imminent share loss. Frozen pizza is on the same trajectory but earlier in the curve. Coffee, pasta, and cereal are stable enough to defer intervention. Without this kind of continuous benchmarking data scraping and structured trend visibility, the pricing team is making category-by-category decisions on 8-week-old Nielsen data instead of same-week evidence.
Four Buyer Archetypes for Custom Pricing Intelligence
Commercial teams building a custom pricing strategy tool typically fall into one of four archetypes, each with a distinct set of decisions the intelligence supports.
The Multinational FMCG Brand. Multinational FMCG brands operating across 20+ countries need consistent, cross-market pricing intelligence to inform global pricing corridors, transfer-pricing decisions, and regional commercial team performance benchmarking. For these brands, a custom pricing intelligence platform is not optional — it is the underlying data infrastructure that makes cross-market commercial governance possible. Nordics regional pricing decisions cannot happen in isolation from Central Europe or the UK; the tool provides the comparable view.
The National Retailer. National retailers building or refining their own pricing strategy need visibility into competitor retailers' pricing across their exact assortment. A Finnish national grocery retailer benchmarking against K-Group, S-Group, Lidl, and specialty formats uses the pipeline to inform weekly price-line decisions, private-label positioning, and promotional response strategy.
The Regional Specialty Brand. Regional specialty brands — organic, premium, health-focused — occupy narrow shelf positions that are highly sensitive to relative pricing versus mainstream alternatives. For these brands, retail pricing intelligence company support is defensive — daily visibility on whether competitors have entered the specialty premium corridor, and whether mainstream brands are launching premium extensions that compress the specialty differential.
The Private-Label Manufacturer. Private-label manufacturers producing for major retail chains need to inform their retail partners' pricing decisions with data on how their private-label lines are performing against branded alternatives at the shelf. A comprehensive price benchmarking data scraping deployment gives private-label manufacturers the intelligence to advise chain partners on pricing corridor optimization, promotional cadence, and category-share defense.
Nordics Case Focus — Why Finland Is an Advanced-Market Example
The Nordic retail market — Finland specifically — is an instructive case for global pricing teams because it combines high private-label penetration, high digital shelf maturity, high shopper price sensitivity, and a compact competitive set that makes pricing intelligence patterns exceptionally clear.
Finland's grocery market is dominated by two banner groups (K-Group with K-Citymarket, K-Supermarket, and K-Market formats; S-Group with Prisma, S-market, Sale, and Alepa formats), a fast-growing discount channel (Lidl), online pure-plays (Foodie.fi, Kauppahalli24), and specialty formats. A pricing team monitoring an FMCG brand's 12 SKUs across this competitive set gets a clean, comprehensive view of how their brand is positioned across every meaningful channel Finnish shoppers actually use.
The Nordics retail pricing data patterns visible in Finland — private-label price-gap dynamics, promotional cadence rhythms, discount-channel disruption — appear in similar forms across Sweden, Norway, Denmark, Estonia, and the broader Nordic-Baltic region. A pricing team that builds custom benchmarking capability in Finland typically expands the same architecture to cover the full Nordics region within 6-9 months.
Beyond the Nordics, the same pipeline architecture supports global FMCG pricing intelligence deployments in Western Europe, North America, GCC, India, Southeast Asia, and Latin America — the market-specific retailers change, but the underlying data model, cross-channel comparability, and trend-analysis output remain consistent.
How the Custom Price Benchmarking Pipeline Architecture Works
FoodDataScrape builds custom pricing benchmarking deployments on a five-layer architecture designed for FMCG pricing's specific data challenges — pipelines built specifically for price benchmarking tool custom retail fmcg 2026 requirements at production scale.
Layer 1: Retailer and Channel Mapping. For each client engagement, the team defines the exact set of retailers, channels (hypermarket, supermarket, discount, online, quick-commerce), and geographies to monitor. A Finland-focused engagement typically covers 5-8 retailers across 3 channel formats and multiple metro clusters.
Layer 2: Cross-Retailer SKU Matching. FMCG SKUs are notoriously hard to match across retailers — the same product can appear with different pack-size descriptions, different local-language product names, different private-label equivalents. An AI SKU matching layer pairs the client's SKUs to their competitor and private-label equivalents across every monitored retailer, producing a canonical SKU-family view that enables like-for-like price comparison.
Layer 3: Continuous Multi-Channel Scraping. Per-retailer, per-channel extractors pull shelf price, promotional overlays, availability, and metadata daily (or more frequently for high-volatility categories). Data is normalized into consistent schema, converted to local currency where relevant, and deduplicated before delivery.
Layer 4: Analytics and Gap-Calculation Layer. Raw pricing data is transformed into decision-ready outputs — per-SKU price-gap versus private-label, per-category price positioning versus competitive set, promotional cadence detection, and trend-direction flags. This is where competitor pricing data services become custom pricing intelligence rather than raw feed.
Layer 5: Delivery and Integration. The platform delivers structured JSON via REST API, optional CSV export, S3 or Azure Blob delivery, or direct integration with the client's BI stack (Power BI, Tableau, Snowflake, Databricks). Most pricing teams have live dashboards running within 48 hours of feed activation.
The build timeline from kickoff to production platform delivery is typically 5-8 weeks for a mid-scope engagement covering 100-500 SKUs across 5-8 retailers in a single market, including a free proof-of-concept sample delivered in the first week.
Why FMCG and Retail Brands Choose a Custom Approach
FMCG brands and retailers select a custom benchmarking approach over off-the-shelf pricing intelligence products for six specific reasons.
- Category-specific SKU matching depth. Off-the-shelf platforms treat all categories the same. A custom pipeline is tuned per category — dairy requires pack-size and format matching, wine requires vintage sensitivity, personal care requires variant matching, ambient grocery requires unit-price normalization. Match accuracy on category-tuned pipelines typically exceeds 95% versus 70-80% for generic platforms.
- Client-specific retailer scope. Off-the-shelf platforms cover a fixed retailer set. A custom deployment covers exactly the retailers the client competes with — including regional specialty chains, private-label banners, and emerging quick-commerce entrants that generic platforms miss.
- Analytics layer aligned to client's commercial model. Generic pricing dashboards produce generic outputs. Custom analytics align to the client's own KPI framework — their specific price-gap targets, their category-share benchmarks, their trade-spend attribution model.
- Direct BI stack integration. REST API, CSV, S3, Snowflake, or direct BI tool integration — the feed plugs into the client's existing analytics stack without middleware or manual reconciliation.
- Dedicated commercial-analytics expertise. Every engagement includes a dedicated analyst with FMCG and retail category expertise to help define scope, interpret trends, and refine tracking as the client's competitive landscape evolves.
- Scoped scale flexibility. Custom deployments start with a focused SKU set and expand as value is proven. A brand can begin with 50 SKUs in Finland and scale to 5,000+ SKUs across the Nordics or Europe on the same underlying pipeline.
Sample Use Cases — How Commercial Teams Actually Use the Data
Use Case 1: Weekly Price-Gap Committee Review. A Finnish FMCG brand's pricing committee reviews per-category private-label gap trends every Monday. Categories where the gap has widened >2 percentage points in 4 weeks trigger an intervention discussion — either a targeted price action, a promotional response, or an assortment adjustment. The custom pipeline replaces a 45-minute manual data compilation with a 5-minute dashboard review.
Use Case 2: New-Country Market Entry Pricing. A multinational FMCG brand preparing to enter the Norwegian market uses a custom pipeline to benchmark their planned SKU pricing against Rema 1000, Kiwi, Meny, and Coop Norway — 6 weeks before launch. Pre-launch pricing is calibrated against actual market corridors rather than headquarters assumptions.
Use Case 3: Trade Promotion ROI Analysis. A branded manufacturer measures whether a Q3 trade-spend allocation actually translated into shelf-price benefit for the shopper at K-Group formats — versus being absorbed into retailer margin. The 12-month historical time-series makes attribution possible.
Use Case 4: Private-Label Threat Response. A branded ambient-grocery manufacturer detects a new premium private-label launch at S-Group within 48 hours of shelf appearance — activating a defensive promotional response before category-share erosion begins rather than after quarterly panel data reveals the damage.
Use Case 5: Retail Partner Negotiation Prep. A brand's national account team prepares for a quarterly review with a major retailer using 90 days of documented pricing behavior — showing exactly where the retailer's pricing has diverged from agreed corridors, where promotional support has been under-delivered, and where competitive positioning needs to be renegotiated.
Getting Started — The 6-Week Roadmap
Getting a custom benchmarking platform live with FoodDataScrape follows a structured process designed to minimize risk and prove value before scope expansion.
Week 1: Scoping and proof-of-concept. The client defines the SKU list, target retailers, channels, geographies, refresh cadence, and required analytics outputs. A free proof-of-concept sample is delivered within 5 business days showing exact data structure and analytics format.
Weeks 2-5: Production build. Retailer-specific extractors are configured, cross-retailer SKU matching is tuned to the client's catalog, analytics layer is calibrated to the client's commercial KPIs, and API/BI integration is tested with the client's analytics team.
Week 6: Live production delivery. The platform goes live with daily data delivery and analytics dashboards. The client's pricing team begins receiving structured, decision-ready pricing intelligence.
Ongoing: Refinement and expansion. As the client's competitive landscape evolves — new SKUs, additional retailers, new markets, deeper analytics — the engagement expands continuously. Most clients grow scope 3-5x within the first 12 months of deployment.
Conclusion — Custom Pricing Intelligence Is the 2026 Commercial Standard
The FMCG and retail pricing environment in 2026 has become too fragmented, too fast-moving, and too competitive for quarterly panel data or off-the-shelf platforms to serve as the primary pricing intelligence input. Brands and retailers relying on legacy sources are structurally disadvantaged against competitors that have moved to continuous, custom, category-specific price benchmarking.
The Finnish market example — 12 SKUs, 5 retailers, 3 channels, weekly trend visibility — is an entry-point scope. Most FMCG brands and retailers expand within 6-12 months to 500-5,000 SKUs across multiple markets once they see the operational lift from real-time custom pricing intelligence.
FoodDataScrape builds the custom pipelines that deliver this intelligence — covering global retailers, private-label banners, discount channels, quick-commerce formats, and specialty categories with daily refresh, category-tuned SKU matching, and dedicated commercial-analytics support.
If you are an FMCG brand, a national or regional retailer, or a specialty manufacturer and pricing precision has become a commercial imperative in your 2026 strategy — a purpose-built Price Benchmarking Tool is the fastest path to closing the visibility gap.
Ready to See Sample Data for Your Category? Tell us your target SKUs, retailers, and markets. Get a free proof-of-concept sample of the custom pricing intelligence output on your actual product catalog within 5 business days — no commitment required.
Contact FoodDataScrape today for custom pricing intelligence that turns pricing complexity from a threat into a commercial advantage.
Questions
Frequently Asked Questions
A well-designed pipeline delivers per-SKU shelf pricing, promotional overlays, availability, pack-size and unit-price normalization, private-label price-gap calculations, cross-channel views, store-level or region-level attribution, and historical time-series across every monitored retailer and channel.
Any retailer with public shelf pricing on their digital properties — including hypermarkets, supermarkets, discount chains, online grocery pure-plays, quick-commerce operators, and specialty formats. Coverage is defined per client engagement based on the client's competitive set.
The AI SKU matching layer normalizes pack-size, unit-price, and local-language product name variations to produce canonical SKU families that enable like-for-like comparison across retailers. Category-specific tuning delivers 95%+ match accuracy on production catalogs.
The matching layer includes private-label detection logic that pairs each branded SKU to the closest private-label equivalent per retailer — enabling per-category branded-vs-private-label price-gap calculations that surface competitive threats before they appear in panel data.
Yes — the platform delivers via REST API, CSV export, S3 or Azure Blob delivery, or direct integration with Snowflake, Databricks, Power BI, Tableau, and other enterprise BI tools. Most clients have live dashboards running within 48 hours of feed activation.
Yes — sourcing is compliance-aware with respect to each market's applicable regulations, and only compliantly-collected retail price data is delivered.
Get a Free Food Data Sample in 48 Hours.
Tell us your platforms, target markets and required fields — we'll map exactly what's possible with food data scraping, recommend the right approach, and send a working sample so you can verify quality before any commitment.
Request a strategy call
Thanks — our data team will reach out within 48 hours with your sample.



