
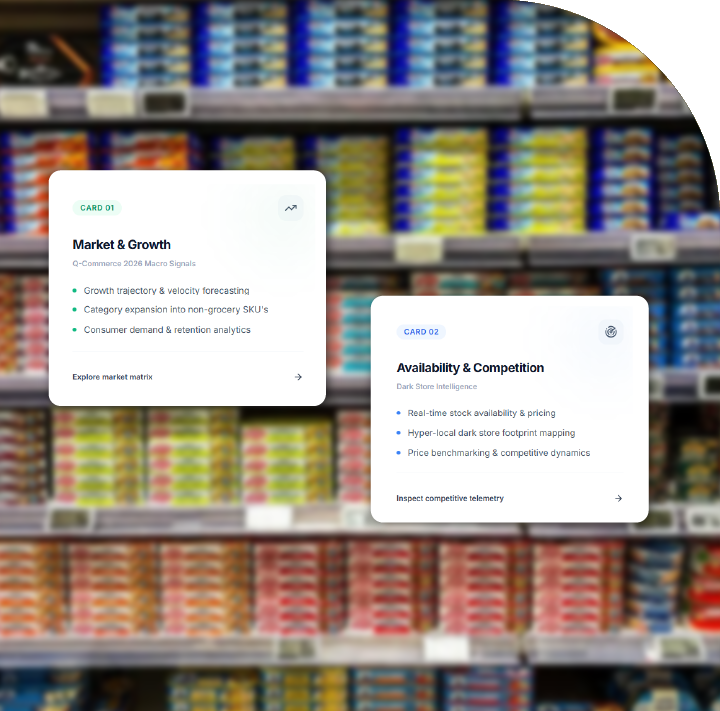
Market Growth: Q-commerce networks continue expanding across urban markets rapidly.
Store Intelligence: Dark stores reveal localized competitive retail dynamics.
Price Monitoring: Dynamic prices create continuous competitive benchmarking opportunities.
Availability Tracking: Stock-outs expose critical inventory performance gaps.
Strategic Expansion: Location intelligence identifies profitable underserved market opportunities.

Q-commerce & dark store intelligence 2026 has become an increasingly important source of competitive insight as ultra-fast delivery platforms move beyond simple grocery convenience toward a highly localized retail infrastructure. Quick-commerce companies are competing through delivery speed, assortment depth, product availability, pricing, promotions, geographic coverage, and increasingly sophisticated dark-store networks.
India provides a particularly strong example of this transformation. An industry mapping study published in July 2026 identified 5,625 dark stores across five major platforms—Blinkit, Zepto, Swiggy Instamart, Flipkart Minutes, and BigBasket—covering 408 cities and 26 states.
Dark store market intelligence is therefore moving from a supplementary analytics function to a core strategic capability. Businesses can analyze where dark stores are located, which neighborhoods they serve, how competitors structure their assortments, which products disappear from availability, and how prices change throughout the day.
Dark store stock-out monitoring is especially valuable because a product being listed does not necessarily mean it is available for immediate delivery. Monitoring product-level availability across locations can reveal recurring stock-outs, supply gaps, assortment differences, and potential lost-sales opportunities.
The scale of the opportunity is substantial. An Equirus report cited by Business Standard estimated India's quick-commerce market at approximately ₹1.08 lakh crore in 2026, while the combined dark-store network of Blinkit, Zepto, and Instamart reached 5,026 locations by May 2026, compared with 3,405 a year earlier.
Dark stores are the physical backbone of q-commerce. Unlike conventional supermarkets, they are designed primarily for online order fulfillment. Their success depends on proximity to customers, SKU availability, picking efficiency, rider access, inventory turnover, and order density.
The competitive landscape is expanding rapidly. Publicly mapped July 2026 data showed Blinkit with 1,955 dark stores, Zepto with 1,088, Swiggy Instamart with 1,038, Flipkart Minutes with 880, and BigBasket with 664. These figures represent a mapped public-data snapshot rather than audited corporate disclosures.
| Platform | Dark Stores | Network Share % | Cities Covered | States Covered | Avg. Stores/City | Approx. Stores/State | Rank | Store Gap vs Leader | Market Position | Expansion Signal | Primary Competitive Strength |
|---|---|---|---|---|---|---|---|---|---|---|---|
| Blinkit | 1,955 | 34.8% | 200+ | 26 | 9.8 | 75.2 | 1 | 0 | Leader | Very High | Largest footprint |
| Zepto | 1,088 | 19.3% | 150+ | 20+ | 7.3 | 54.4 | 2 | 867 | Challenger | High | Urban density |
| Swiggy Instamart | 1,038 | 18.5% | 129+ | 20+ | 8.0 | 51.9 | 3 | 917 | Challenger | High | Delivery ecosystem |
| Flipkart Minutes | 880 | 15.6% | 100+ | 15+ | 8.8 | 58.7 | 4 | 1,075 | Emerging | High | Retail ecosystem |
| BigBasket | 664 | 11.8% | 100+ | 15+ | 6.6 | 44.3 | 5 | 1,291 | Established | Moderate | Grocery expertise |
| Total | 5,625 | 100% | 408 | 26 | 13.8 | 216.3 | --- | --- | Five-platform market | High | Dense urban network |
| Top 2 Platforms | 3,043 | 54.1% | --- | --- | --- | --- | --- | --- | Concentrated | --- | Leader + challenger |
| Top 3 Platforms | 4,081 | 72.5% | --- | --- | --- | --- | --- | --- | Highly concentrated | --- | Core market |
| Top 4 Platforms | 4,961 | 88.2% | --- | --- | --- | --- | --- | --- | Very concentrated | --- | National scale |
| Top 15 Cities | ~3,431 | ~61.0% | 15 | --- | ~228.7 | --- | --- | --- | Metro-heavy | --- | High demand density |
Source: July 2026 public-data mapping; platform counts and the reported 5,625-store total are based on a public mapping snapshot. Derived percentages and ratios are calculated from those counts.
The concentration is also important. The 2026 mapping study reported that the top 15 cities accounted for roughly 61% of mapped dark stores, demonstrating that q-commerce remains heavily concentrated around major urban demand centers even as platforms push into smaller markets.
Quick commerce product availability scraping allows businesses to observe whether specific SKUs are available, unavailable, temporarily out of stock, restricted to certain locations, or substituted by another product.
For FMCG manufacturers, this creates a powerful retail-execution dataset. A brand can track its own products against competitors across multiple micro-markets and identify patterns such as:
Stock-out intelligence becomes even more valuable when combined with timestamps. Instead of recording a simple "available/not available" status, an intelligence system can calculate availability percentages by SKU, store, city, hour, day, and platform.
For example, if a beverage brand has 96% availability in the morning but only 71% between 6 p.m. and 9 p.m., the problem may be demand forecasting rather than weak consumer interest. Such patterns can support replenishment planning and improve retailer discussions.
Quick commerce pricing intelligence provides another layer of visibility. Q-commerce prices can change frequently because platforms use discounts, coupons, bundles, platform-funded promotions, seller-funded promotions, and localized pricing strategies.
A useful monitoring framework should capture the regular price, selling price, discount percentage, promotional label, pack size, unit price, availability, and timestamp.
| Intelligence Metric | Baseline / Example Value | Unit | Platform Comparison | Measurement Frequency | Competitive Signal | Business Interpretation | Recommended Action | Priority /10 | Potential Use |
|---|---|---|---|---|---|---|---|---|---|
| Average SKU price | ₹184 | Per SKU | Cross-platform | Daily | Medium | Market price benchmark | Reprice strategically | 8 | Pricing |
| Median SKU price | ₹149 | Per SKU | Cross-platform | Daily | Medium | Reduces premium-SKU distortion | Track category median | 7 | Benchmarking |
| Average discount | 13.8% | Percentage | Cross-platform | Daily | High | Promotional intensity | Optimize promotions | 9 | Promotions |
| Maximum observed discount | 42% | Percentage | SKU level | Hourly | Very High | Aggressive campaign | Investigate campaign | 9 | Competitive monitoring |
| Average availability | 91.6% | Percentage | Store/SKU | Hourly | Very High | Supply reliability | Protect inventory | 10 | Inventory |
| Average stock-out rate | 8.4% | Percentage | Store/SKU | Hourly | Very High | Potential lost sales | Improve replenishment | 10 | Stock monitoring |
| Peak-hour availability | 84.2% | Percentage | 6–9 PM | 30–60 min | Very High | Evening demand pressure | Increase replenishment | 10 | Demand planning |
| Morning availability | 95.4% | Percentage | 6–11 AM | Hourly | Medium | Strong initial inventory | Maintain stock | 6 | Operations |
| Availability decline | 11.2 pts | Percentage points | Peak vs morning | Daily | Very High | Peak supply weakness | Adjust allocation | 10 | Supply planning |
| Price changes/SKU | 7.2 | Changes/month | Cross-platform | Daily | High | Dynamic pricing activity | Increase monitoring | 8 | Pricing intelligence |
| Competitor price gap | ₹16 | Per SKU | Brand vs competitor | Daily | High | Positioning difference | Review pricing | 8 | Competitive pricing |
| Promo participation | 28.5% | % of SKUs | Platform | Daily | High | Promotional intensity | Assess campaign ROI | 8 | Promotion |
| SKUs/store | 2,840 | SKUs | Store level | Weekly | High | Assortment breadth | Compare category depth | 8 | Assortment |
| New SKU introduction | 5.6% | Monthly % | Store/platform | Monthly | Medium | Assortment innovation | Track launches | 7 | Product intelligence |
| SKU delisting rate | 3.7% | Monthly % | Store/platform | Monthly | High | Portfolio rationalization | Track disappearing SKUs | 8 | Assortment intelligence |
| Brand availability | 88.9% | Percentage | Brand/store | Daily | Very High | Retail execution | Improve distribution | 10 | Brand monitoring |
| Competitor availability | 94.3% | Percentage | Competitor benchmark | Daily | Very High | Competitor supply advantage | Investigate gap | 10 | Competitor analysis |
| Average delivery radius | 2.7 km | Kilometers | Dark store | Daily | High | Service-area efficiency | Optimize footprint | 8 | Location intelligence |
| Store density | 13.8 | Stores/city | Five platforms | Monthly | High | Infrastructure intensity | Identify saturation | 9 | Expansion |
| Dark-store overlap | 42.6% | Percentage | Geographic | Monthly | Very High | Competitive clustering | Find white spaces | 9 | Location strategy |
| New store openings | 8.5% | Monthly growth | Platform | Monthly | Very High | Expansion velocity | Track expansion | 10 | Market intelligence |
| Store closure/relocation | 1.9% | Monthly | Platform | Monthly | High | Network optimization | Monitor weak markets | 8 | Network strategy |
| Category availability | 93.2% | Percentage | Category | Daily | High | Category health | Replenish weak categories | 9 | Category management |
| Private-label share | 11.4% | Percentage | Platform | Monthly | Medium | Own-brand pressure | Monitor private labels | 7 | Retail strategy |
| Promotional SKU share | 31.7% | Percentage | Category | Daily | High | Campaign pressure | Adjust calendar | 8 | Campaign intelligence |
| Average MRP | ₹213 | Per SKU | Cross-platform | Daily | Medium | Reference price | Compare discount depth | 7 | Price analytics |
| Average selling price | ₹184 | Per SKU | Cross-platform | Daily | High | Actual consumer price | Monitor net pricing | 9 | Revenue analytics |
| Average price gap | 8.4% | Percentage | Platform-to-platform | Daily | High | Price competitiveness | Trigger alerts | 9 | Price monitoring |
| Stock-out duration | 3.6 | Hours/event | SKU/store | Hourly | Very High | Lost-sales window | Prioritize replenishment | 10 | Inventory intelligence |
| Replenishment frequency | 2.8 | Cycles/day | Store | Daily | High | Inventory velocity | Optimize replenishment | 9 | Operations |
| Peak-demand SKU growth | 17.4% | Monthly | SKU/category | Weekly | Very High | Emerging demand | Increase stock | 10 | Forecasting |
| Competitor assortment overlap | 68.5% | Percentage | Platform pair | Weekly | High | Direct competition | Differentiate assortment | 9 | Competitor analysis |
| Assortment gap | 14.7% | Percentage | Platform comparison | Weekly | High | Untapped opportunity | Expand assortment | 9 | Growth strategy |
| Serviceable population | 1.2M | Consumers | City cluster | Monthly | Very High | Addressable market | Evaluate expansion | 10 | Market sizing |
| Dark-store white-space score | 7.8 | /10 Score | Locality | Monthly | Very High | Expansion opportunity | Prioritize location | 10 | Site selection |
These figures are illustrative analytical benchmarks showing how a q-commerce intelligence dataset can be structured; they are not presented as audited platform disclosures.
Quick commerce competitor analysis allows businesses to compare platforms at the SKU, category, store, neighborhood, and city levels rather than relying solely on headline market figures.
For example, two platforms may have similar city-level coverage but very different dark-store densities. One may concentrate stores around premium residential neighborhoods while another may pursue broader geographic coverage. That difference can influence delivery times, product availability, customer acquisition costs, and order economics.
Quick commerce market share analysis should therefore consider multiple dimensions. GMV share alone may not fully describe competitive strength. Store count, serviceable population, assortment depth, order frequency, average basket size, delivery speed, availability rate, and promotional intensity can all provide additional market signals.
A 2026 industry analysis estimated platform GMV shares among major players at approximately 46% for Blinkit, 29% for Zepto, and 22% for Swiggy Instamart, although such estimates vary by methodology and source.
This highlights why a multidimensional intelligence model is necessary. A company with fewer stores may still be highly competitive if its stores generate greater order density or serve higher-value neighborhoods.
Q-Commerce Dark Store Location Data Scraping can help identify where competitors are establishing fulfillment infrastructure and where underserved demand may exist.
Location intelligence can include store coordinates, locality, postal code, city, service radius, operating status, platform, estimated coverage area, neighboring competitor stores, and changes in location status over time.
Geospatial analysis can then reveal clusters and white spaces. A retailer may discover that three competitors have dense coverage within a two-kilometer radius while a nearby residential zone has limited coverage. This can support decisions about new dark-store locations, delivery partnerships, warehouse placement, or targeted promotions.
Dark Store Data Scraping can also support longitudinal analysis. Tracking locations over several months makes it possible to identify newly opened stores, relocated facilities, inactive locations, expanding service zones, and areas where multiple competitors are converging.
The trend is moving beyond metropolitan markets. Recent industry reporting suggests that Tier-2 and Tier-3 cities represent an increasingly important growth opportunity, but platforms may need localized strategies rather than simply replicating metro operating models.
The rapid expansion of dark stores is also creating operational and regulatory challenges. In August 2026, Maharashtra authorities suspended food-related licenses associated with 14 establishments linked to quick-commerce operations following inspections involving hygiene, storage, temperature-control, pest-management, and food-safety concerns.
This development demonstrates why dark-store intelligence should not focus exclusively on prices and availability. Businesses can increasingly monitor operational indicators such as assortment removals, recurring availability changes, store closures, delivery-area adjustments, and category-level disruptions.
Regulatory clarity is another emerging issue. FMCG distributors have been calling for clearer rules that distinguish dark stores from traditional retail outlets, particularly regarding space requirements, zoning, and licensing.
A robust q-commerce intelligence system can combine scheduled data collection, location intelligence, product matching, historical databases, and automated analytics.
A typical dataset may contain platform name, store ID, store coordinates, product ID, SKU, brand, category, product title, pack size, MRP, selling price, discount, availability, promotional status, rating, review count, delivery estimate, timestamp, and geographic service area.
Historical snapshots are particularly important. A single scrape provides a market snapshot; repeated collection produces a competitive intelligence system.
Businesses can use these datasets for assortment optimization, price benchmarking, promotional analysis, demand forecasting, inventory planning, competitor tracking, market expansion, and retailer negotiations.
The next phase of q-commerce competition is likely to be less about simply promising faster delivery and more about improving the economics behind that promise. Dense store networks, intelligent inventory allocation, category optimization, localized pricing, and predictive replenishment will increasingly determine which platforms can scale profitably.
Blinkit's operating-level profitability in the June 2026 quarter illustrates the sector's movement toward improving unit economics while competition remains intense. At the same time, competitors are expanding into additional categories, including plans to deliver larger electronics and appliances through rapid-commerce networks.
For brands, retailers, investors, and technology companies, the competitive advantage will come from transforming fragmented observations into continuous market intelligence.
Q-commerce in 2026 is evolving into a sophisticated, geographically distributed retail ecosystem in which every dark store can function as a micro-market. Monitoring locations, products, prices, promotions, availability, and competitive movements provides a granular view of how this ecosystem is changing.
A well-designed Q-Commerce Dark Store DB can consolidate store locations, product catalogs, pricing histories, availability records, category structures, and competitive observations into one analytical environment.
Web Scraping Quick Commerce Data can further convert frequently changing public digital signals into structured historical datasets that support pricing, assortment, availability, market expansion, and competitive intelligence.
Ultimately, the method to Scrape Quick Commerce Data is not simply about collecting product listings. It is about creating a continuously updated intelligence layer that explains where q-commerce demand is developing, how competitors are responding, and where the next opportunities for growth may emerge.
Are you in need of high-class scraping services? Food Data Scrape should be your first point of call. We are undoubtedly the best in Food Data Aggregator and Mobile Grocery App Scraping service and we render impeccable data insights and analytics for strategic decision-making. With a legacy of excellence as our backbone, we help companies become data-driven, fueling their development. Please take advantage of our tailored solutions that will add value to your business. Contact us today to unlock the value of your data.