
Introduction
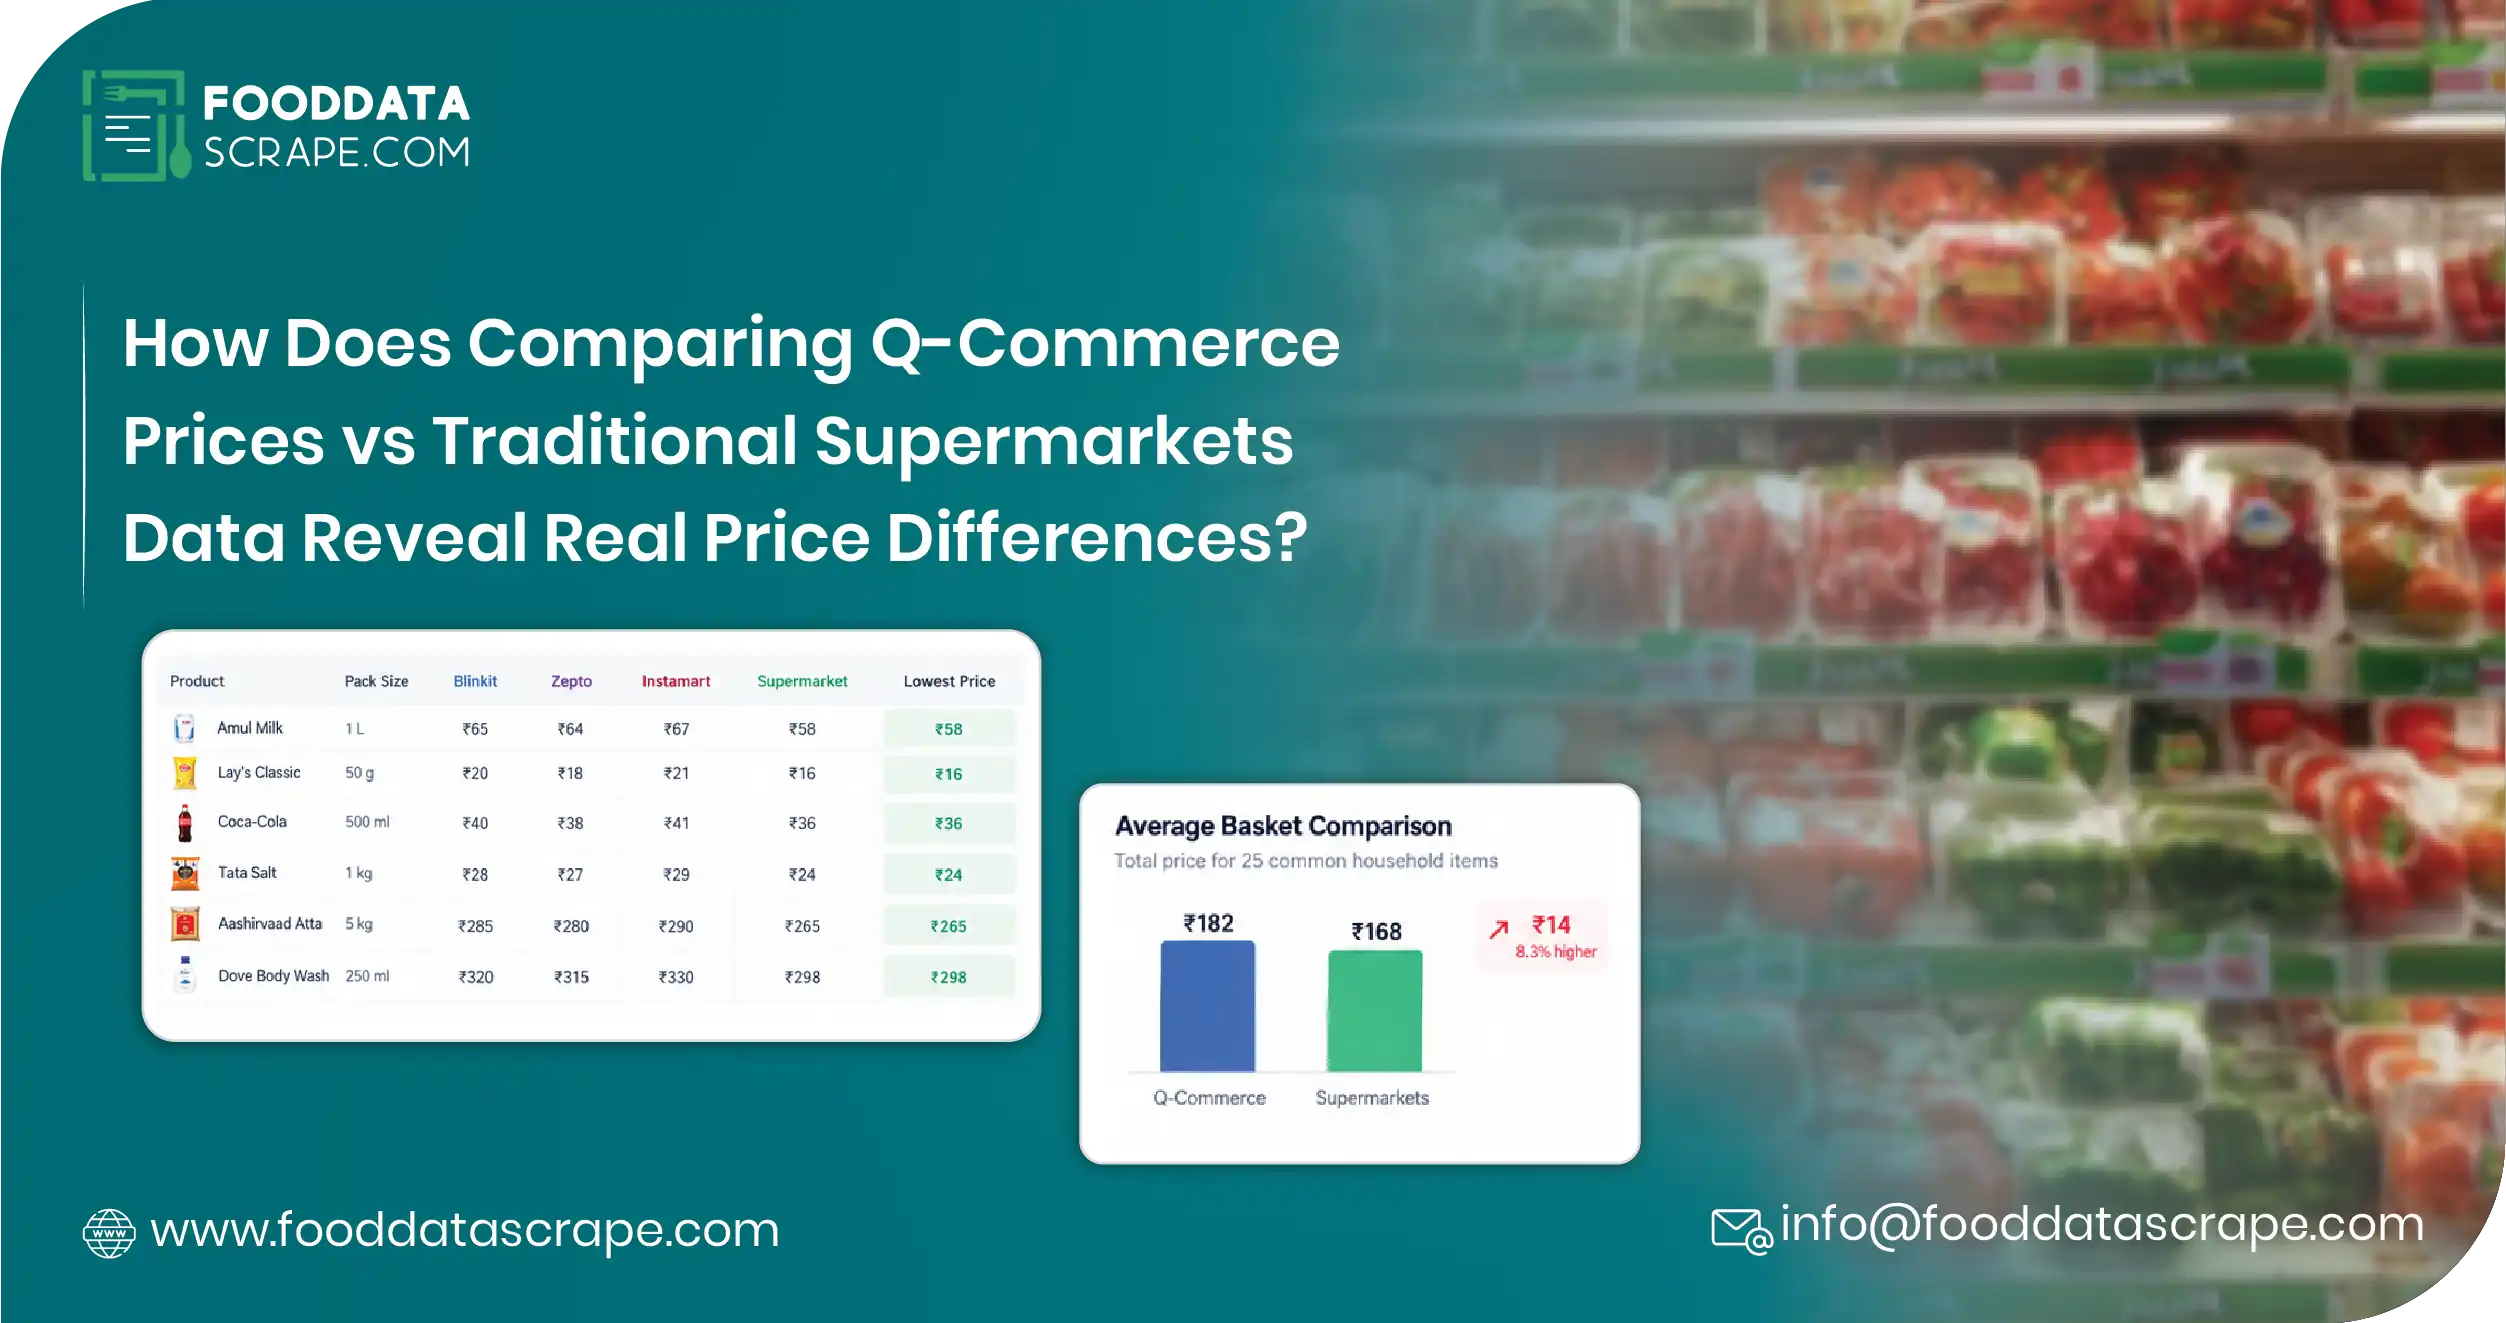
The grocery industry is changing rapidly as consumers increasingly choose between instant delivery and traditional supermarket shopping. Comparing Q-Commerce Prices vs Traditional Supermarkets data gives retailers, brands, analysts, and pricing teams a practical way to understand how convenience, promotions, location, and shopping missions influence the final price consumers see.
Quick-commerce platforms promise groceries in minutes, while supermarkets compete through wider assortments, loyalty programs, weekly promotions, private-label products, and physical-store convenience. These differences make direct price comparison surprisingly complex. A product may cost more on a quick-commerce application because of convenience, yet aggressive app-only discounts can sometimes make it cheaper than a nearby supermarket.
Modern quick commerce vs supermarket prices scraping enables businesses to collect product-level information across both channels and transform fragmented pricing observations into structured competitive intelligence. Similarly, supermarket vs q-commerce promotional pricing scrape helps identify whether discounts are genuinely competitive or simply different expressions of channel-specific promotional strategies.
Why Compare Q-Commerce and Traditional Supermarket Prices?
At first glance, comparing prices seems straightforward: find the same product on two platforms and compare the displayed price. In practice, several variables can make this comparison misleading.
Pack sizes may differ. A supermarket may sell a 1-liter bottle while a quick-commerce platform lists a 900 ml alternative. Promotions may be conditional on minimum basket values, memberships, payment methods, or limited-time campaigns. Delivery fees and service charges can also affect the customer's effective purchase cost.
A robust comparison therefore requires more than collecting product prices. It requires matching products accurately, recording pack sizes, tracking promotions, capturing timestamps, and normalizing prices into comparable units.
For example, a ₹120 product on a supermarket website and a ₹130 product on a quick-commerce application do not necessarily represent a ₹10 competitive gap if the first listing is 500 grams and the second is 750 grams.
Unit economics matter.
Building Quick-Commerce vs Supermarket Data Intelligence
Effective quick commerce vs supermarkets data intelligence begins with a standardized data collection framework.
A typical dataset can capture product name, brand, SKU, category, pack size, listed price, discounted price, original price, promotion type, availability, store location, timestamp, seller, and product URL.
For quick-commerce platforms, additional fields can include estimated delivery time, dark-store availability, app-exclusive offers, surge-related charges, and membership benefits.
For traditional supermarkets, data can include store-level pricing, loyalty discounts, weekly promotions, online-store prices, private-label alternatives, and regional availability.
This creates a unified dataset capable of answering questions that simple price checks cannot.
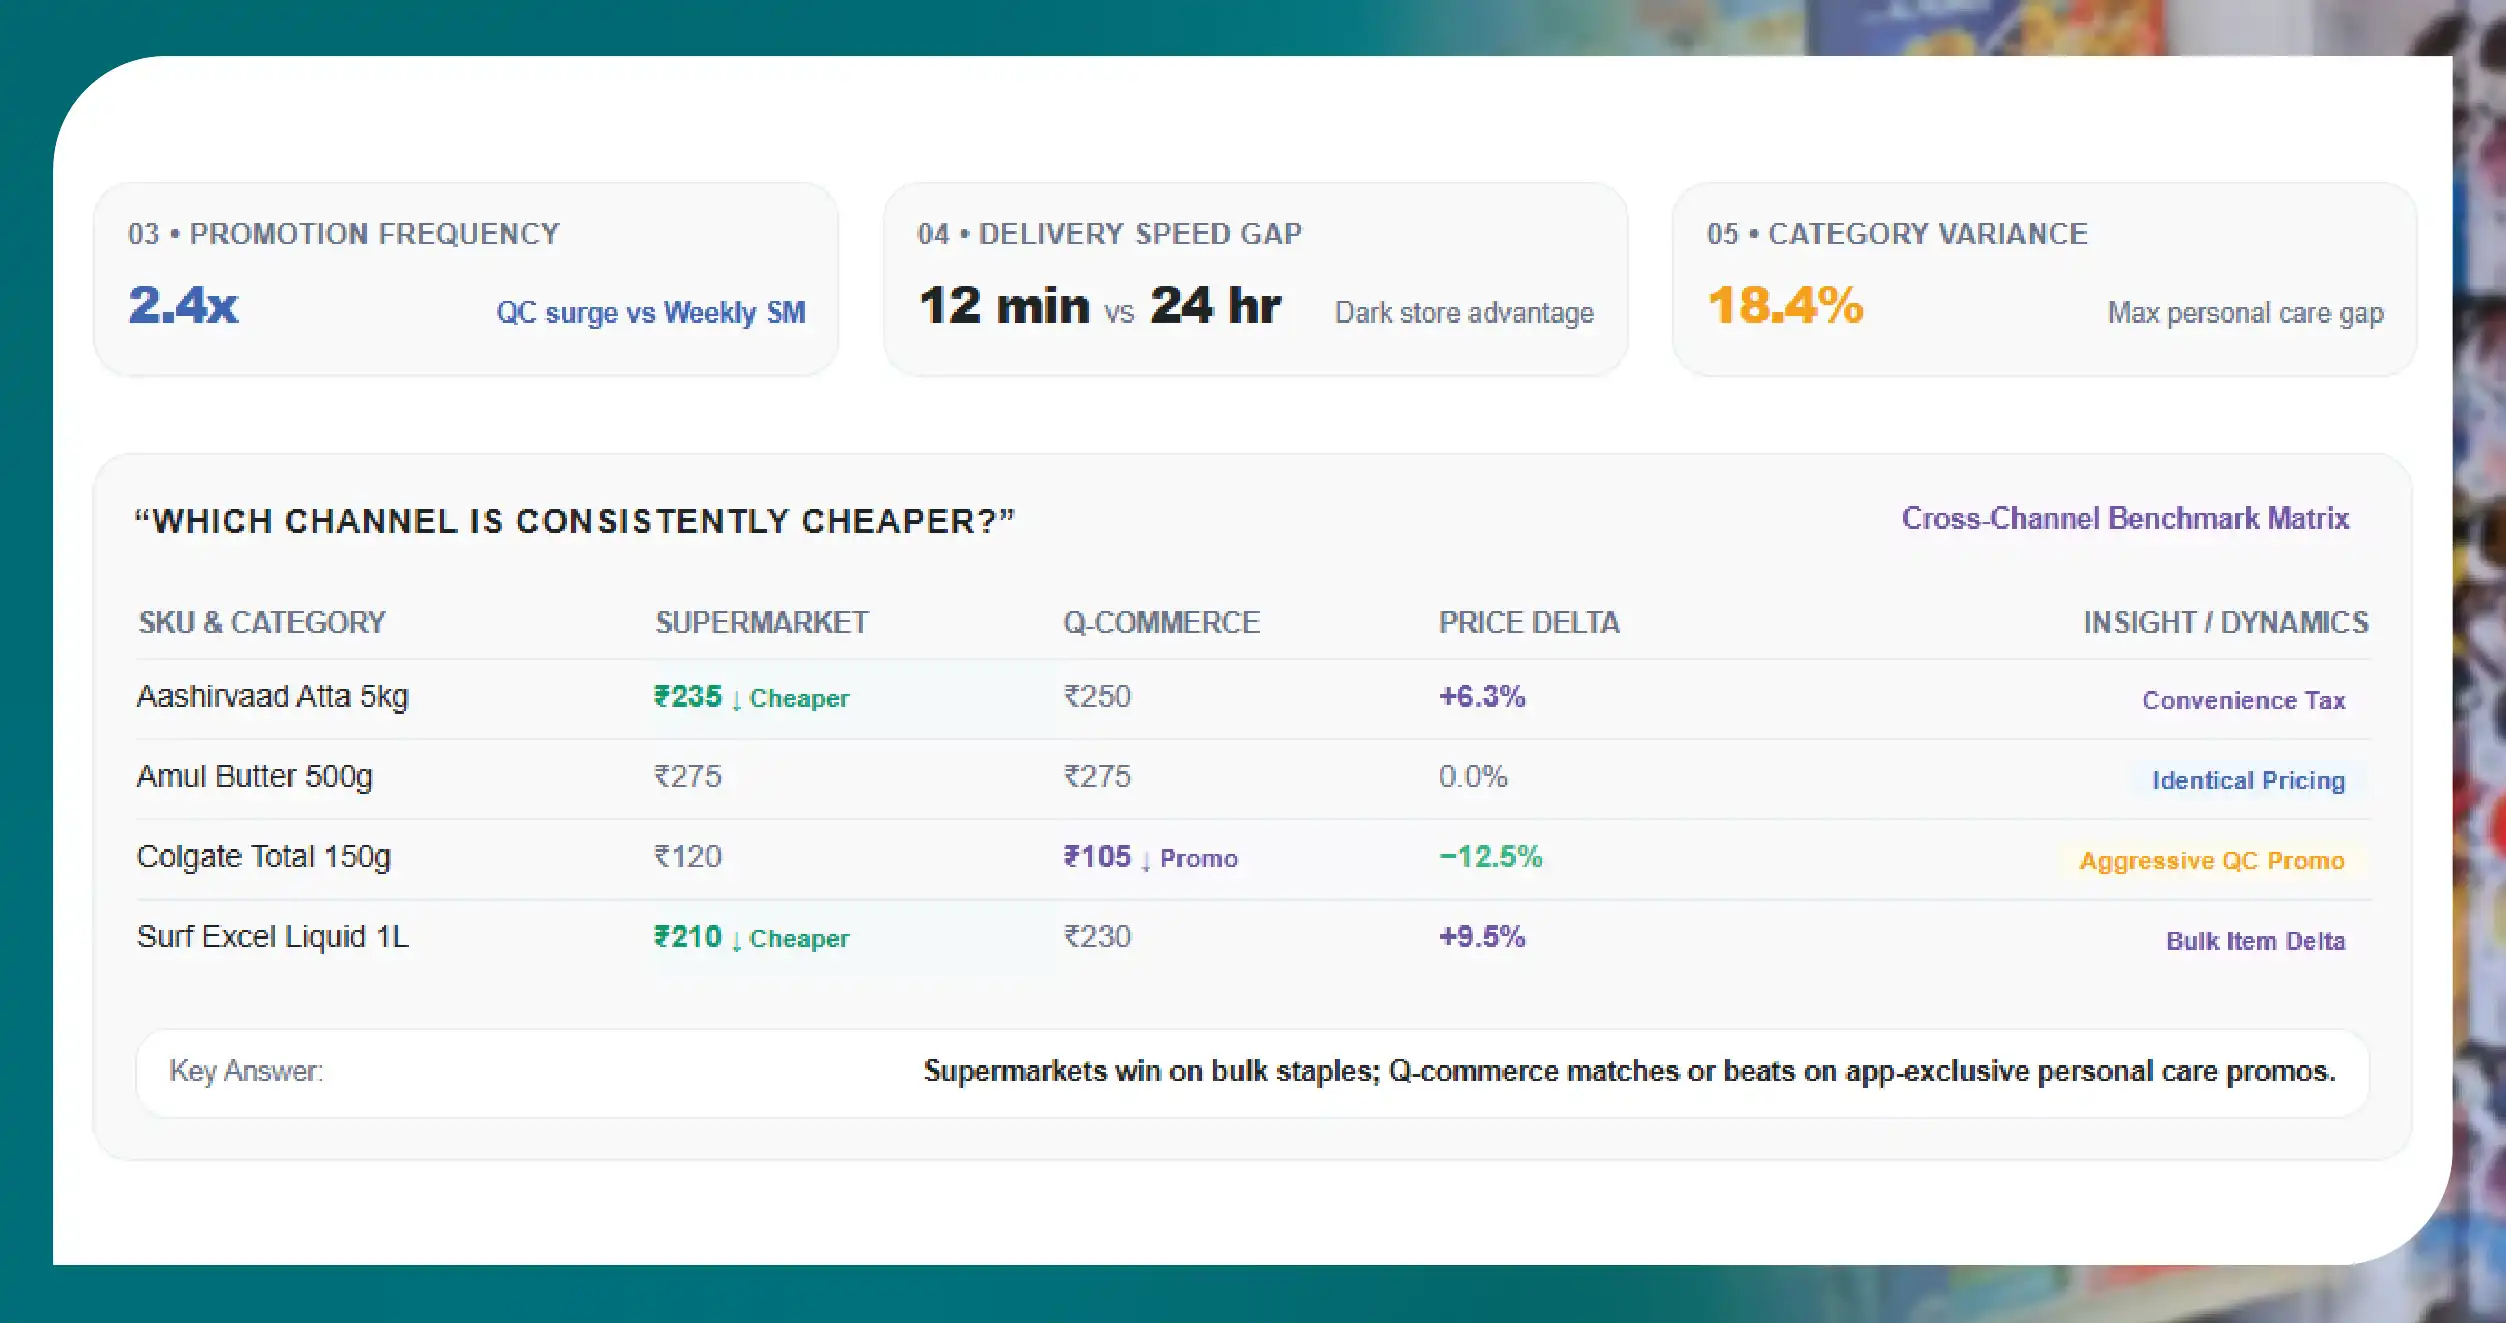
- Which channel is consistently cheaper?
- Which categories show the largest price differences?
- When do quick-commerce promotions become more aggressive?
- Are supermarket discounts concentrated around weekends?
- Do certain brands maintain identical prices across channels?
- Do location-specific prices create meaningful differences between neighborhoods?
These insights become especially valuable when tracked continuously rather than collected as a one-time snapshot.
Understanding Q-Commerce Convenience Premiums
One of the most interesting outcomes of comparative pricing research is identifying the convenience premium.
Consumers may willingly pay more for immediate delivery because the value proposition is not simply the product itself. It includes speed, accessibility, saved travel time, and convenience.
Suppose a supermarket lists a product at ₹95 while a quick-commerce platform lists it at ₹105. The ₹10 difference could represent a convenience premium. However, if the quick-commerce platform applies a ₹15 promotional discount, the final price becomes ₹90.
This demonstrates why q-commerce vs traditional supermarket prices monitoring needs to capture both regular and promotional prices.
Businesses can calculate:
Convenience Premium = Q-Commerce Effective Price − Supermarket Comparable Price
They can also calculate percentage differences:
Price Difference % = ((Q-Commerce Price − Supermarket Price) / Supermarket Price) × 100
These calculations become much more meaningful when performed across thousands of products and multiple time periods.
The Role of Promotional Pricing
Promotions can completely change the competitive landscape.
Quick-commerce businesses frequently use targeted discounts, app-exclusive coupons, first-order incentives, basket promotions, flash offers, and category-specific campaigns. Supermarkets may rely more heavily on weekly promotions, loyalty pricing, multi-buy offers, and seasonal campaigns.
A comparative dataset should therefore distinguish between regular price and effective promotional price.
For example:
| Product Category | Supermarket Regular | Supermarket Promo | Q-Commerce Regular | Q-Commerce Promo |
|---|---|---|---|---|
| Milk | ₹64 | ₹60 | ₹68 | ₹61 |
| Bread | ₹45 | ₹40 | ₹48 | ₹42 |
| Biscuits | ₹35 | ₹30 | ₹38 | ₹29 |
| Cooking Oil | ₹155 | ₹145 | ₹162 | ₹149 |
| Detergent | ₹210 | ₹185 | ₹225 | ₹179 |
| Snacks | ₹60 | ₹52 | ₹65 | ₹49 |
| Soft Drinks | ₹45 | ₹39 | ₹48 | ₹40 |
| Breakfast Cereal | ₹320 | ₹279 | ₹335 | ₹289 |
The table illustrates an important point: the channel with the higher regular price may occasionally become the cheaper option after promotions.
Measuring Price Differences at Scale
Businesses conducting quick commerce price comparison scraping can create price indices that summarize competitive movements across categories.
A simple Quick Commerce Price Index can be calculated by selecting a consistent basket of products and comparing its average normalized price over time.
For instance, if a representative grocery basket costs ₹2,000 in the baseline period and rises to ₹2,080, the index moves from 100 to 104.
This makes it possible to monitor inflation, channel pricing pressure, promotional intensity, and competitive shifts without focusing on individual SKUs alone.
The Quick Commerce Price Index can also be segmented by city, category, brand, store, weekday, weekend, and promotional status.
Why Time-Based Monitoring Matters?
Price comparison becomes more powerful when time is included.
A product may show a small difference on Monday but a significant difference on Friday because of weekend promotions. Similarly, quick-commerce platforms may adjust prices during high-demand periods, while supermarkets may maintain stable shelf pricing throughout the week.
This makes quick commerce and supermarket price difference scraping valuable for identifying temporal pricing patterns.
A dataset can track prices hourly, daily, or at customized intervals depending on business requirements.
For example:
| Day | Supermarket Avg. Basket | Q-Commerce Avg. Basket | Difference |
|---|---|---|---|
| Monday | ₹1,850 | ₹1,925 | +4.1% |
| Tuesday | ₹1,855 | ₹1,915 | +3.2% |
| Wednesday | ₹1,860 | ₹1,905 | +2.4% |
| Thursday | ₹1,875 | ₹1,910 | +1.9% |
| Friday | ₹1,890 | ₹1,875 | -0.8% |
| Saturday | ₹1,920 | ₹1,850 | -3.6% |
| Sunday | ₹1,915 | ₹1,865 | -2.6% |
The hypothetical pattern shows how promotions can reverse normal channel pricing relationships.
Scraping Price Drop Data from Quick Commerce
Price drops deserve separate analysis because they reveal competitive reactions and promotional strategies.
Businesses can Scrape Price Drop Data from Quick Commerce platforms to identify when products move below their historical price, how deep the discount becomes, how long it lasts, and whether competing supermarkets respond.
Price-drop intelligence can support automated alerts such as:
- Product price falls more than 10%.
- Competitor undercuts the supermarket price.
- Promotional price expires.
- High-value SKU enters a discount campaign.
- Competitor launches a multi-buy offer.
- Previously unavailable product returns with a new price.
This allows pricing teams to react based on measurable market movements instead of manual observations.
Category-Level Competitive Analysis
Not every grocery category behaves the same way.
Fresh produce can experience frequent price changes because of supply conditions. Packaged foods may have relatively stable list prices but frequent promotions. Household products often experience deep promotional discounts. Beverages may show seasonal price competition.
A comparative dataset can therefore classify products into pricing-behavior groups.
For example, analysts may discover that quick-commerce platforms are most competitive in snacks and beverages, while supermarkets maintain stronger pricing advantages in bulk household products.
This insight can influence assortment, promotions, private-label strategy, and customer acquisition campaigns.
Location-Level Price Intelligence
Pricing also varies by geography.
Two customers in different neighborhoods may see different product prices because they are served by different dark stores, supermarket branches, warehouses, or fulfillment centers.
Location-aware datasets allow businesses to compare:
- City-level pricing
- Neighborhood-level pricing
- Store-level pricing
- Dark-store pricing
- Delivery zones
- Product availability
- Promotion penetration
- Regional price gaps
This can reveal local competitive opportunities that national averages hide.
For brands, location-level monitoring can also reveal where products are consistently discounted or priced above recommended market levels.
How Food Data Scrape Can Help You?
1. Build a Unified Competitive Pricing Dataset
Food data scraping combines quick-commerce and supermarket information into standardized datasets, making product matching, price comparison, promotion analysis, and historical benchmarking easier across multiple markets.
2. Detect Competitive Price Changes Faster
Automated monitoring identifies price increases, discounts, promotional launches, and competitor undercutting quickly, helping pricing teams respond before temporary competitive advantages become persistent market disadvantages.
3. Analyze Promotional Strategies More Accurately
Scraped historical pricing reveals which retailers rely on discounts, multi-buy offers, loyalty promotions, or flash campaigns, helping businesses understand promotional intensity and customer acquisition strategies.
4. Improve Product-Level Pricing Decisions
Normalized product data allows businesses to compare equivalent SKUs, pack sizes, brands, and categories, supporting better pricing decisions while reducing errors caused by inconsistent product comparisons.
5. Create Actionable Pricing Dashboards
Structured data can feed dashboards showing price indices, channel gaps, promotional trends, availability, and regional differences, giving decision-makers a continuously updated view of grocery competition.
Conclusion
Comparing quick-commerce and traditional supermarket pricing is no longer simply about checking which retailer displays the lower number. True competitive intelligence requires historical data, product normalization, promotion tracking, location-level analysis, and continuous monitoring.
Businesses that combine Scrape Real-Time Quick Commerce Pricing with comprehensive pricing datasets can build a stronger understanding of channel-specific pricing behavior.
With Scrape Product Prices from Supermarket, retailers and brands can compare product-level pricing across different grocery channels.
Through Supermarket Data Scraping, businesses can measure competitive gaps, identify promotional opportunities, monitor price movements, and understand where convenience-driven pricing creates or eliminates competitive advantages.
As grocery shopping continues moving between physical stores, supermarket websites, and instant-delivery applications, structured pricing intelligence is becoming increasingly important. Organizations that continuously compare channels can move beyond reactive price checking toward proactive pricing strategy, smarter promotions, and stronger market positioning.
Ready to turn grocery pricing changes into actionable competitive intelligence? Start collecting structured quick-commerce and supermarket pricing data to benchmark competitors, identify price gaps, and optimize your pricing strategy today.
Are you in need of high-class scraping services? Food Data Scrape should be your first point of call. We are undoubtedly the best in Food Data Aggregator and Mobile Grocery App Scraping service and we render impeccable insights and analytics for strategic decision-making. With a legacy of excellence as our backbone, we help companies become data-driven, fueling their development. Please take advantage of our tailored solutions that will add value to your business. Contact us today to unlock the value of your data.



