
Introduction
Brands and analysts keep asking the same question: which quick commerce best selling products are winning on Blinkit and Swiggy Instamart, in my city, this month? The honest starting point is that neither app publishes units sold for any product.
Short answer: You cannot see real sales of quick commerce best selling products, but you can rank them reliably with public demand proxies. Track search rank for category keywords, listing position, "bestseller" tags, rating counts, stock-out and restock speed by pincode, discount depth, and assortment breadth. Combine them into a weighted demand score.
This guide explains each proxy, its limits, a sample scoring method, a city and pincode sampling plan, and the compliance rules to follow. It covers food and grocery only: staples, snacks, beverages, dairy, frozen and fresh.
Why quick commerce best selling products matter in 2026
Quick commerce is no longer a side channel for packaged food. Redseer estimates India's quick commerce GMV at about $13–14 billion in FY26, growing around 120% year on year, and says quick commerce now makes up roughly 70% of online grocery (Redseer, May 2026).
The store networks behind that growth are large and local:
- Blinkit: 2,443 stores at the end of the June 2026 quarter, with 200 net stores added in the quarter, and net order value of ₹17,132 crore, per Eternal's Q1 FY27 shareholder letter as reported by Outlook Business.
- Swiggy Instamart: 1,171 dark stores across 131 cities and gross order value of ₹7,907 crore in Q1 FY27 (Inc42; primary source: Swiggy shareholder letter).
Every one of those stores carries its own range and stock. So any list of quick commerce best selling products is a pincode-level answer, not a national one. A snack that leads in Gurugram Sector 56 may be absent in Noida.
Who uses a demand ranking?
- FMCG and D2C brands checking whether their SKUs are winning or losing shelf share.
- Category managers using quick commerce best selling products lists to plan range, launches and promotions by city.
- Investors and analysts comparing category momentum across apps.
- New entrants deciding which categories to enter first.
What the apps show, and what they never show
Blinkit, Instamart and Zepto all show price, MRP, discount, pack size, stock status and the delivery estimate for a given location. Some listings show ratings or labels such as "bestseller", depending on app version and category.
What they do not show is units sold, revenue per SKU or sell-through rate. Any page or vendor that promises "exact sales volumes" scraped from these apps is overstating what is public. Treat such numbers as estimates and ask how they were built.
The good news: quick commerce best selling products leave visible traces. Fast sellers rank higher in search, sell out more often, restock faster and spread to more dark stores. Those traces are what you measure.
The 9 public demand proxies (and their limits)
Each signal below is a proxy for quick commerce best selling products, not a sales figure. Use several together so that no single noisy signal drives the ranking.
| Proxy signal | What it shows | Limitation |
|---|---|---|
| Search-result rank for category keywords (e.g. "chips", "paneer") | How the app's own ranking, partly driven by sales and conversion, orders products | Sponsored slots and personalisation distort rank; record ad labels and use a clean session |
| Category / listing position | Placement on category and sub-category pages | Merchandising deals can buy position |
| "Bestseller" or similar tags (where shown) | The platform's own signal of high sales | Not shown on every app or category; criteria are not published |
| Rating count (where shown) | Cumulative purchase-linked engagement | Lags behind current demand; favours older SKUs |
| Stock-out frequency per dark store / pincode | How often demand exceeds stock | Can also mean poor supply, not high demand |
| Restock speed | How quickly an out-of-stock SKU returns | Depends on replenishment cycles and brand supply |
| Discount depth and duration | Whether a product needs promotion to move | Deep discounts can mean weak demand or a push for share |
| New-listing velocity | How fast new SKUs or variants appear in a category | Shows brand investment, not shopper uptake |
| Assortment breadth across pincodes | Share of sampled dark stores that list the SKU | Platforms widen range for strategic reasons too |
Price changes add context to all of these. A SKU that holds a higher price while staying near the top of search and selling out often is showing strong underlying demand.
How to build a demand score for quick commerce best selling products
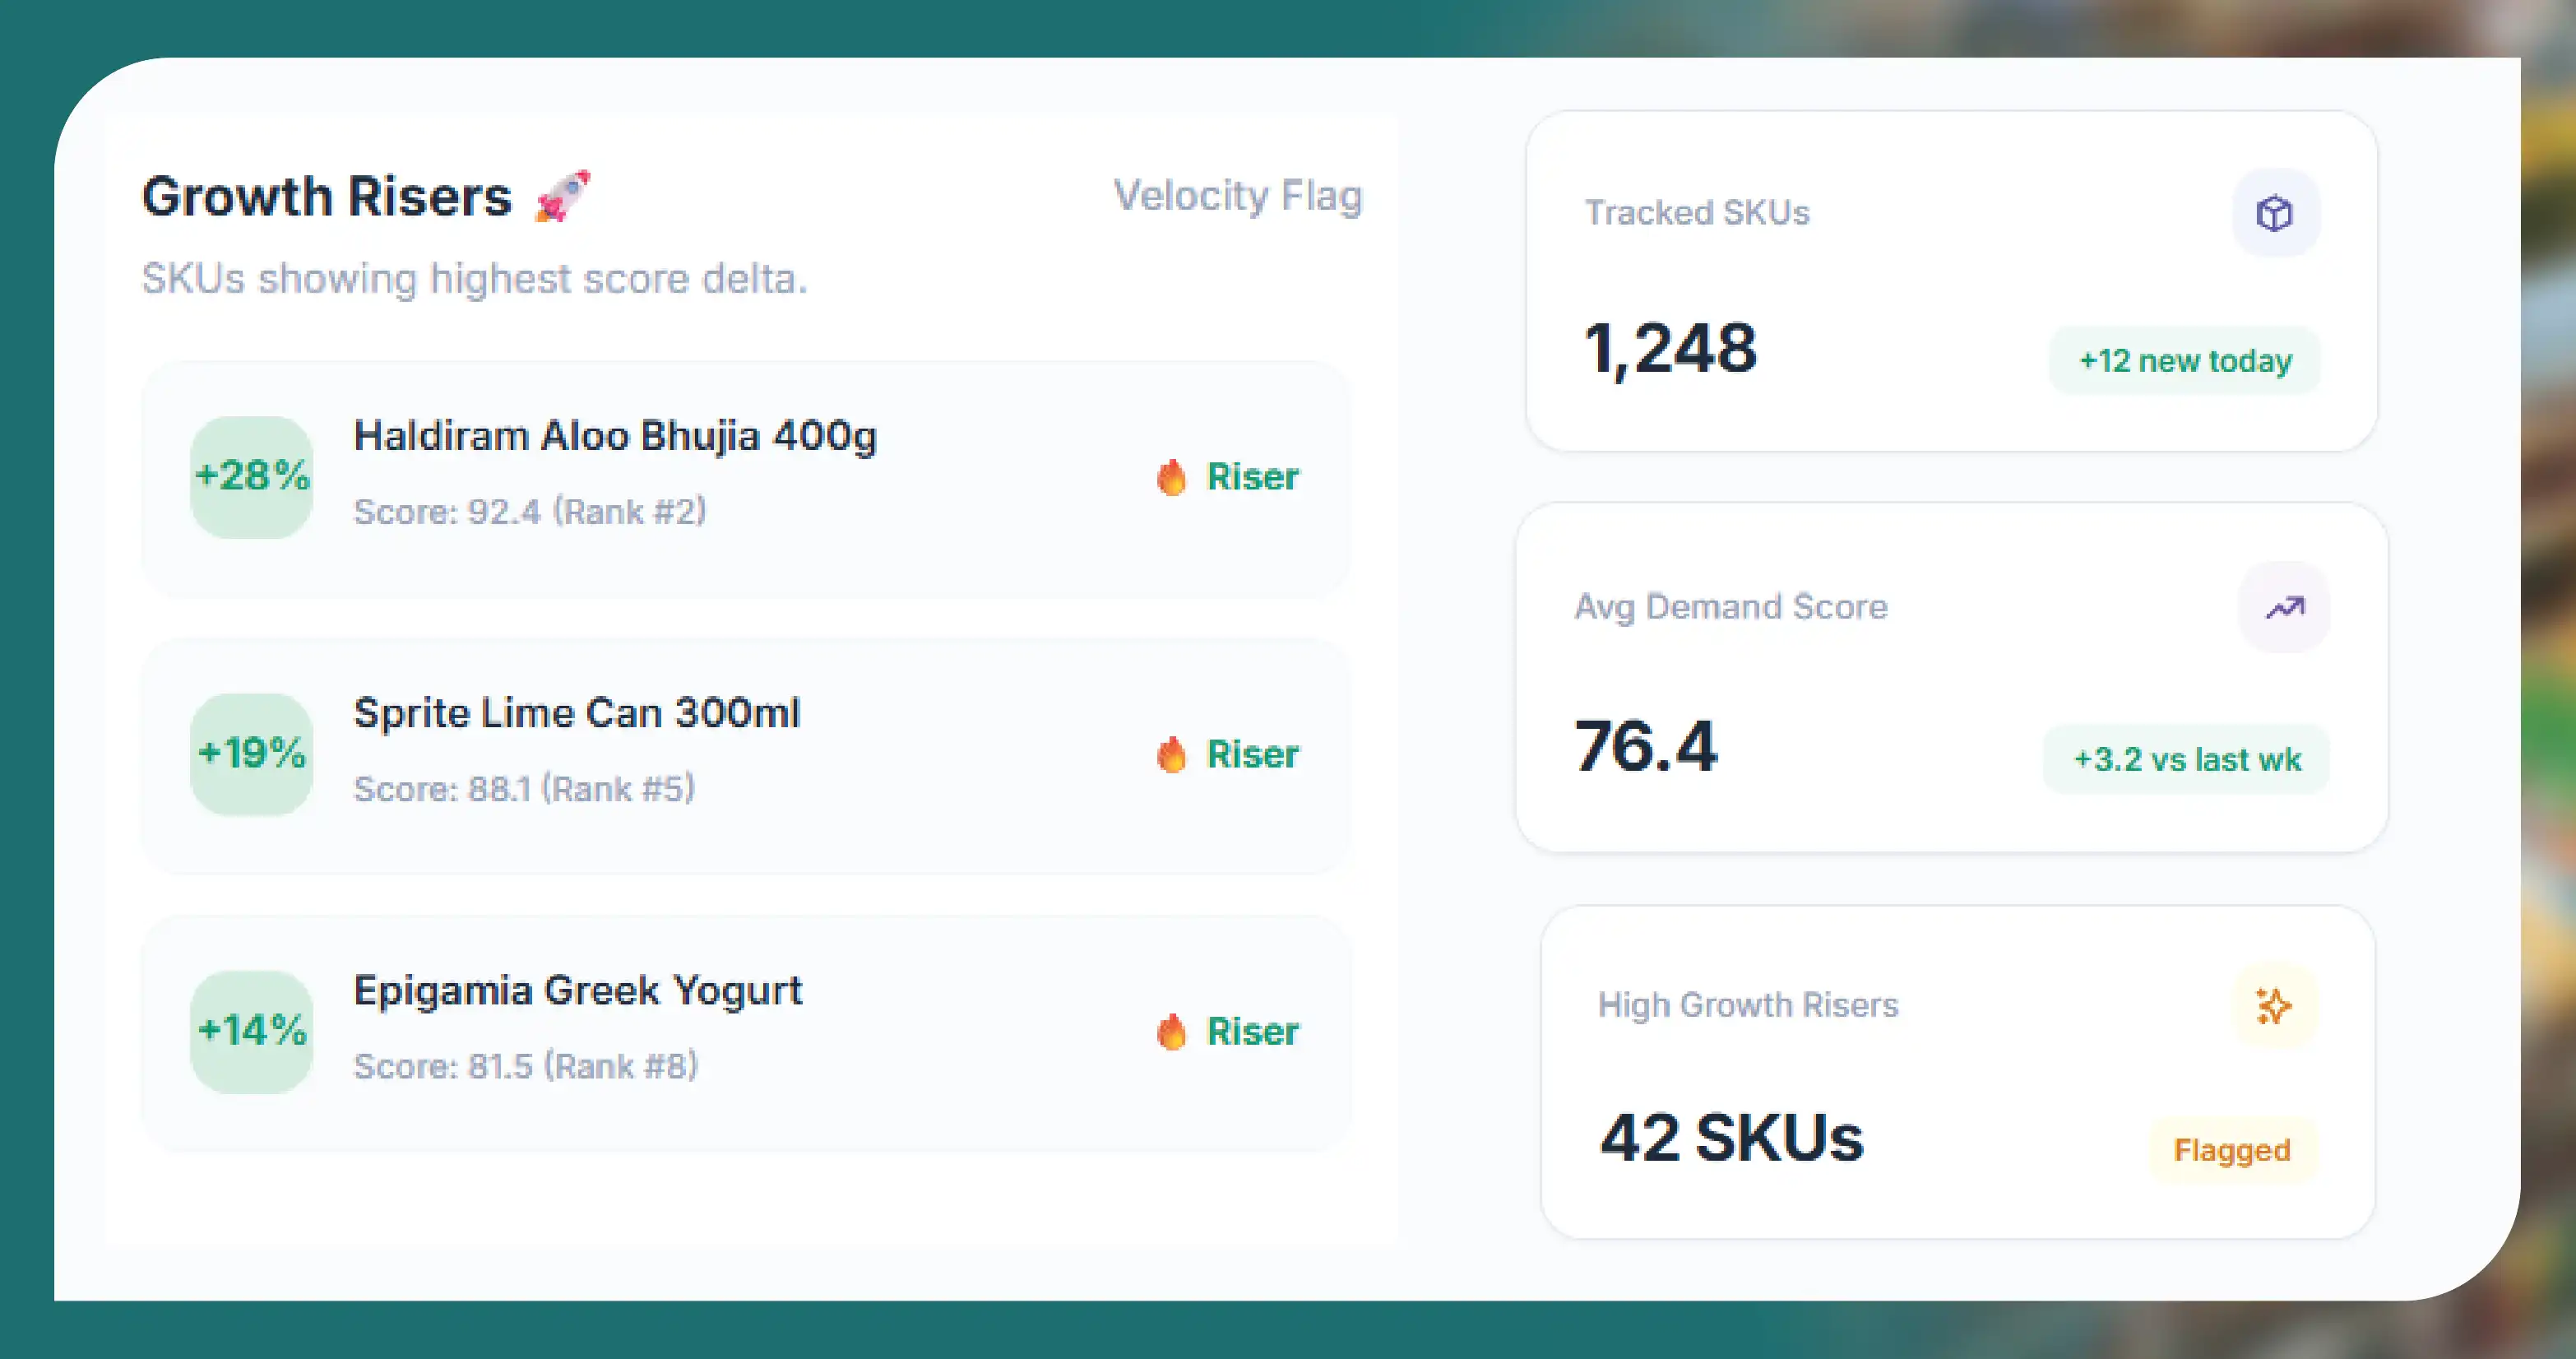
A demand score turns many proxies into one comparable number per SKU, per pincode, per week, so you can rank quick commerce best selling products consistently. Here is a simple method you can adapt.
- Define the shelf. Pick categories (for example, chips and namkeen, soft drinks, curd, frozen snacks) and 10–20 shopper keywords per category.
- Collect daily snapshots. For each sampled pincode, record search rank, listing position, tags, rating count, price, MRP, discount and stock status at fixed times of day.
- Normalise each signal to 0–100. For example, rank 1 scores 100 and rank 50 scores 0; a SKU in stock in every sampled store scores 100 on breadth.
- Apply weights. Use the example weights below as a starting point, then adjust after review.
- Average over time. Use a 7-day or 14-day rolling score so one-off promotions do not dominate.
- Rank and flag growth. Sort by score, then compare with the previous period to find risers.
Example weights (illustrative, not a recommendation for every category):
| Signal | Example weight | Note |
|---|---|---|
| Organic search rank (ads removed) | 25% | Strongest single proxy in most food categories |
| Stock-out frequency + restock speed | 20% | Use together; read alongside supply notes |
| Assortment breadth across pincodes | 15% | Wider listing usually follows proven demand |
| Category listing position | 10% | Lower weight because position can be bought |
| Bestseller / similar tag | 10% | Only where the app shows it |
| Rating count growth (week on week) | 10% | Use the change, not the total |
| Discount depth (inverse) | 10% | A high rank at a low discount scores higher |
The output is a ranked list such as "top 50 SKUs by demand score, Gurugram, snacks, last 14 days", with a growth column. Every value in that list should be labelled a demand score, never "units sold". Sample output values: [Insert Food Data Scrape dataset value].
Brands that have their own sell-in or retail sales data can calibrate the weights against it. That turns the score into a stronger estimate, but it still stays an estimate.
Category notes: staples, snacks, beverages, dairy, frozen and fresh
Quick commerce best selling products look different in each category, and proxies behave differently too. Adjust weights rather than using one formula everywhere.
| Category | Strongest proxies | Watch out for |
|---|---|---|
| Staples (atta, rice, dal, oil) | Breadth across pincodes, organic search rank | Few SKUs per keyword; private labels and bulk packs |
| Snacks (chips, namkeen, biscuits) | Search rank, new-listing velocity, discount depth | Heavy sponsored placement and frequent launches |
| Beverages (soft drinks, juices, energy drinks) | Stock-outs and restock speed, seasonal rank changes | Summer and festival spikes; weather effects |
| Dairy (milk, curd, paneer) | Stock-out timing by time of day, breadth | Daily replenishment makes stock-outs short-lived |
| Frozen (ice cream, frozen snacks) | Stock-outs, breadth by store | Cold-chain capacity limits listing, not demand |
| Fresh (fruit, vegetables) | Breadth, price changes, stock status | Loose items and variable weights are hard to match |
City and pincode sampling plan
Because every dark store is different, sampling decides how reliable your quick commerce best selling products list will be. A Gurugram-style project might look like this.
| Sampling layer | Example choice | Why |
|---|---|---|
| City | Gurugram (add Delhi and Noida for NCR comparison) | Matches the business question |
| Pincode tiers | Premium residential, mid-market residential, office-heavy, new sectors | Demand differs sharply by neighbourhood |
| Pincodes per city | 15–30, spread across tiers | Enough to cover different dark store catchments |
| Platforms | Blinkit, Swiggy Instamart (Zepto optional) | Same keywords on each app for fair comparison |
| Time slots | Morning, afternoon, late evening | Stock-outs cluster at peak hours |
| Frequency | Daily for 2–4 weeks, then weekly | Builds a baseline before reading growth |
| Keyword set | 10–20 shopper terms per category | Mirrors how people actually search |
Map each pincode to the store that serves it where the app reveals this. Two nearby pincodes served by the same dark store should be counted once.
How to collect, clean and match the data
- Collect from the public storefront. Set the delivery location to each sampled pincode and record what any shopper would see.
- Separate sponsored results. Store an "ad" flag and calculate organic rank without them.
- Match SKUs across apps. Use brand, product name, pack size and unit. The same chips pack may have different names on Blinkit and Instamart.
- Normalise pack sizes. Compare price per 100 g or per litre, and treat multipacks separately.
- Keep timestamps. Every row needs a capture time, pincode and platform.
- Run quality checks. Flag sudden jumps, missing stores and duplicate listings before scoring.
The Blinkit, Swiggy Instamart and Zepto scraping API and the Blinkit dataset show the kind of SKU-level fields involved, such as price, MRP, discount, stock status and city.
Use cases
- Top-50 lists by city: A ranked list of quick commerce best selling products, i.e. high-demand, high-growth food SKUs per category for a city like Gurugram, refreshed weekly.
- Share-of-shelf tracking: How often a brand appears in the top 10 organic results for its key search terms.
- Launch tracking: Whether a new flavour spreads across dark stores and climbs search rank after launch.
- Promotion review: Whether discounts lift rank and breadth, or only move price.
- Cross-app comparison: Where a SKU ranks on Blinkit versus Instamart in the same pincodes.
Legal and compliance basics
- Public data only: Collect only what any shopper can see on the public storefront for a chosen location.
- No login or OTP bypass: Do not create fake accounts, bypass OTP verification, CAPTCHAs or other security controls.
- Respect terms and robots.txt: Review each platform's terms of service and robots.txt before collecting.
- Rate limits: Keep request rates low and spread over time so you do not burden the service.
- No personal data: Do not collect customer, delivery partner or reviewer personal details.
- Label outputs honestly: Call a list of quick commerce best selling products a demand-score ranking, not sales.
[Compliance: legal team to confirm current Blinkit, Instamart and Zepto terms before any client project.]
Build vs buy
Building in-house works for a few keywords in one city. It gets harder as you add pincodes, time slots, apps and SKU matching. Location handling, layout changes and ad detection need regular maintenance.
A managed provider should be able to show sample data, explain its scoring method, label proxies clearly and state its compliance approach. Ask any vendor how they define quick commerce best selling products before you buy a list.
Get a free sample dataset: a demand-score ranking for one food category in one city, built from public Blinkit and Instamart signals.
Questions
Frequently Asked Questions
No. The apps do not publish units sold or revenue per product. Only the brand selling the product receives its own sales reports. Public data supports demand proxies and estimates.
Organic search rank for common shopper keywords is usually the strongest single signal. It works best when combined with stock-out frequency and breadth across pincodes.
Not always. It can mean high demand or weak supply. Restock speed and repeated stock-outs across many stores make the signal more reliable.
For a large city, 15–30 pincodes across different neighbourhood types is a practical start. Add more if results vary widely between stores.
Daily collection with a 7-day or 14-day rolling score suits most food categories. Fast-moving categories like beverages in summer may need more frequent snapshots.
Collecting publicly visible business data is common, but you must follow each platform's terms of service, robots.txt and local law, avoid personal data and never bypass access controls. Get legal advice for your specific use.
Get a Free Food Data Sample in 48 Hours.
Tell us your platforms, target markets and required fields — we'll map exactly what's possible with food data scraping, recommend the right approach, and send a working sample so you can verify quality before any commitment.
Request a strategy call
Thanks — our data team will reach out within 48 hours with your sample.



