

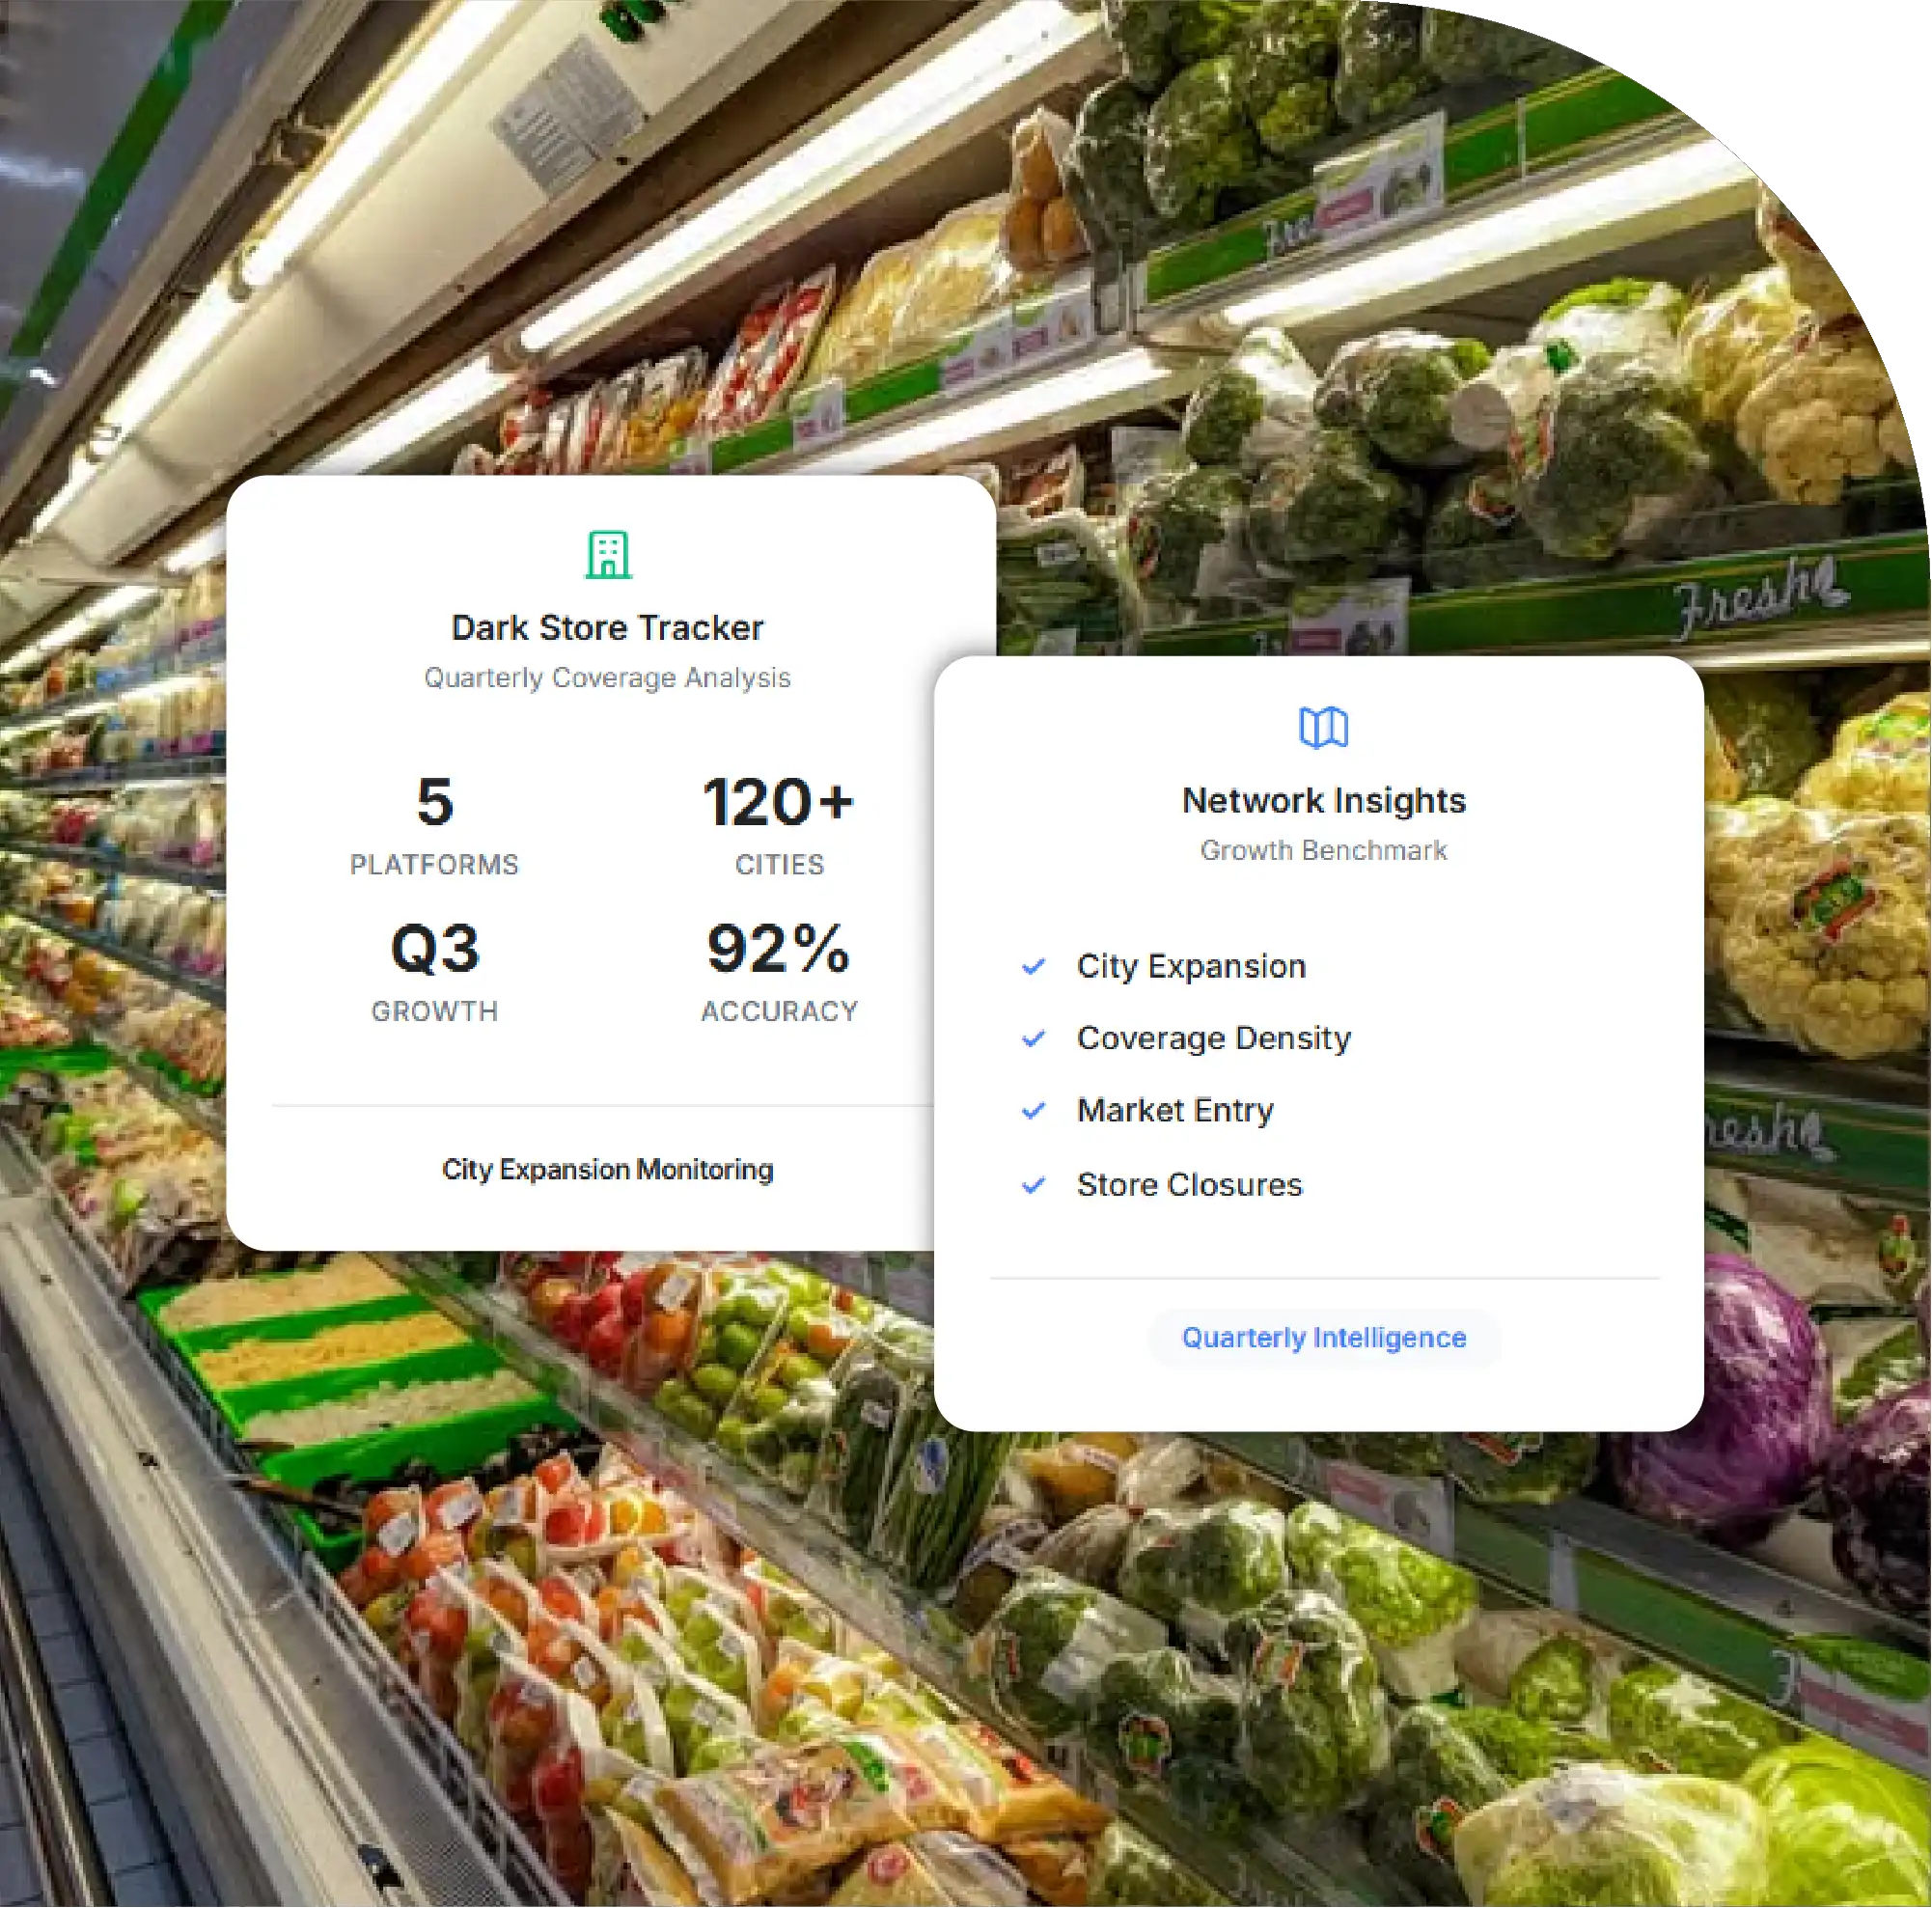
Coverage Expansion
Measures tracked delivery zones by platform and city each quarter on a consistent counting basis, making growth comparable over time.
Closures and Consolidation
Tracks zones that go dark and where they cluster, surfacing overlap pruning long before it appears in company reporting.
New Entrant Footprint
Maps how new platforms build coverage against incumbents, and whether that expansion opens new markets or contests served ones.
Tier-2 and Tier-3 Growth
Quantifies the share of new openings landing outside metros, indicating where the next phase of demand is being built.
Prediction Scorecard
Publishes measurable forecasts each quarter and grades the previous quarter's calls, keeping the outlook accountable and auditable.

Quarterly count of quick-commerce dark store zones across Blinkit, Zepto, Swiggy Instamart, Flipkart Minutes and Amazon Now — openings, closures, city-level growth and what each platform's footprint says about its strategy.
5,146
Total tracked zones across 78 cities and 5 platforms
+412
Net change QoQ (+8.7%)
96
Zones that went dark this quarter
41%
Tier-2 share of new openings
Every number in this summary is public and quotable with attribution. The gated PDF adds full city tables, per-city maps and platform strategy detail — not the headline figures.
Growth continued, but for the first time the closure count is large enough to read as strategy rather than noise.
Tracked zones reached 5,146 across 78 cities, a net gain of 412 (+8.7%) on Q2. The headline number hides the more interesting one: 96 zones went dark — nearly triple last quarter's 34 — concentrated in metros where three or more platforms already overlapped. Lucknow was the fastest-growing city and Flipkart Minutes the fastest-growing platform off a small base.
Zone counts per city, all platforms combined, with net change on Q2.
| City | Q3 Zones | Q2 Zones | Net Change | Platforms Present |
|---|---|---|---|---|
| Delhi NCR | 742 | 710 | +32 | 5 |
| Bengaluru | 631 | 604 | +27 | 5 |
| Mumbai | 598 | 586 | +12 | 5 |
| Hyderabad | 412 | 389 | +23 | 5 |
| Pune | 346 | 324 | +22 | 5 |
| Chennai | 318 | 302 | +16 | 4 |
| Kolkata | 264 | 259 | +5 | 4 |
| Ahmedabad | 221 | 198 | +23 | 4 |
| Jaipur | 164 | 140 | +24 | 4 |
| Lucknow | 149 | 112 | +37 | 4 |
| Chandigarh | 118 | 101 | +17 | 3 |
| Indore | 106 | 84 | +22 | 3 |
| Coimbatore | 92 | 71 | +21 | 3 |
| Kochi | 88 | 69 | +19 | 3 |
| Nagpur | 81 | 62 | +19 | 3 |
Flipkart Minutes and Amazon Now are now large enough to change the coverage map in specific cities.
The two new entrants added 218 zones between them — 53% of all net additions this quarter — but 71% of that expansion landed in cities where incumbents already had coverage, not in unserved ones. This is a share fight, not a market-expansion story.
The number nobody publishes, and the one that reads best in a headline.
96 zones went dark in Q3, up from 34 in Q2. Three quarters of them sat in areas served by three or more platforms, and 22 were zones opened within the last two quarters — short-lived launches being pulled back rather than legacy sites closing. Read alongside slowing metro growth (Kolkata added just 5 net zones), Q3 looks like the first quarter where platforms actively pruned overlap.
Same framework as our dark store strategy analysis, run on fresh Q3 data.
Density play: Two platforms added most zones inside cities they already served — pushing delivery times down rather than reaching new customers.
Coverage play: One platform put 61% of its additions in tier-2 and tier-3 cities, accepting slower times for first-mover position.
Entry play: The new entrants concentrated in high-overlap metros — buying share where demand is proven, at the cost of the most contested zones.
We publish predictions each quarter and grade them the next. Here's last quarter's scorecard.
| Q2 Prediction | What Happened | Grade |
|---|---|---|
| Tier-2 will pass 35% of new openings | Landed at 41% | Hit |
| New entrants will cross 400 total zones | Reached 368 — close, but short | Partial |
| Closures will stay under 50 | 96 closures — nearly double the ceiling we set | Miss |
Measurable, so next quarter's report can grade them the same way.
Closures will exceed 120 zones. Overlap pruning started in Q3 and the pattern is concentrated, not scattered.
Net additions will slow to under +350. Metro saturation plus festive-season operational focus over expansion.
New entrants will hold a combined 8%+ share of tracked zones. They reached 7.2% in Q3 with additions still accelerating.
What we count: serviceable delivery zones inferred from public app serviceability checks — not company-confirmed store counts. One physical store may serve more than one tracked zone, so treat these as coverage figures.
Basis: identical counting basis as our dark store strategy analysis, so figures are comparable across quarters.
Snapshot dates: 1 July 2026 and 30 September 2026. A zone is counted as closed when it fails serviceability checks on the closing snapshot after passing on the opening one.
Platforms: Blinkit, Zepto, Swiggy Instamart, Flipkart Minutes, Amazon Now.
Coverage gaps: [list any cities or dates with incomplete checks — disclose rather than estimate].
Limitations: temporary outages can read as closures at a snapshot boundary; zone boundaries shift as platforms re-tile cities; new-entrant footprints move fast enough that a quarterly snapshot understates them.
Cadence: quarterly on this URL. Q4 refresh lands early January 2027.
Questions
We tracked 5,146 serviceable quick-commerce zones across 78 cities and 5 platforms as of 30 September 2026. This counts delivery zones inferred from public serviceability data, not company-confirmed store counts — one store can serve multiple zones, so the physical store count is lower.
By percentage growth, Flipkart Minutes grew fastest off a small base. By absolute zones added, Blinkit led with 118 net additions in Q3.
Yes. 96 tracked zones went dark in Q3, up from 34 in Q2. Three quarters of them were in areas already served by three or more platforms, which points to platforms pruning overlap rather than retreating from markets.
From public serviceability data — we check whether each platform delivers to sampled locations across 78 cities, then aggregate into zone counts. Refreshed quarterly, with snapshot dates stated in the methodology.



