Introduction
Quick commerce has transformed how consumers purchase groceries, beverages, personal care products, packaged foods, and everyday household essentials. Customers expect products to be available within minutes, prices to remain competitive, and promotions to be visible whenever they open a delivery application. For brands operating in this fast-moving environment, understanding digital shelf performance is essential for protecting market share, improving product visibility, and identifying sales opportunities.
Quick Commerce Digital Shelf Analytics Data helps brands evaluate how their products perform across platforms such as Blinkit, Zepto, Instamart, and other quick commerce marketplaces. By examining product listings, search visibility, prices, ratings, promotions, and stock availability, businesses can understand what customers see when they shop online.
Brands can Scrape Quick Commerce Digital Shelf Data to collect structured information about product listings, competitor offerings, category rankings, and promotional placements. This information supports consistent weekly evaluations and helps teams identify changes that require immediate attention.
Similarly, Quick Commerce Price Monitoring Data enables brands to compare listed prices, discounts, promotional offers, and price differences across platforms and locations. Instead of relying on occasional manual checks, businesses can establish repeatable monitoring processes that reveal emerging trends and competitive movements.
Digital shelf analytics is not simply about collecting information. Its real value comes from converting marketplace observations into measurable key performance indicators (KPIs), actionable insights, and informed commercial decisions. A weekly measurement framework allows brands to identify performance gaps, evaluate strategic changes, and respond quickly to shifting consumer demand.
What Is Digital Shelf Analytics in Quick Commerce?
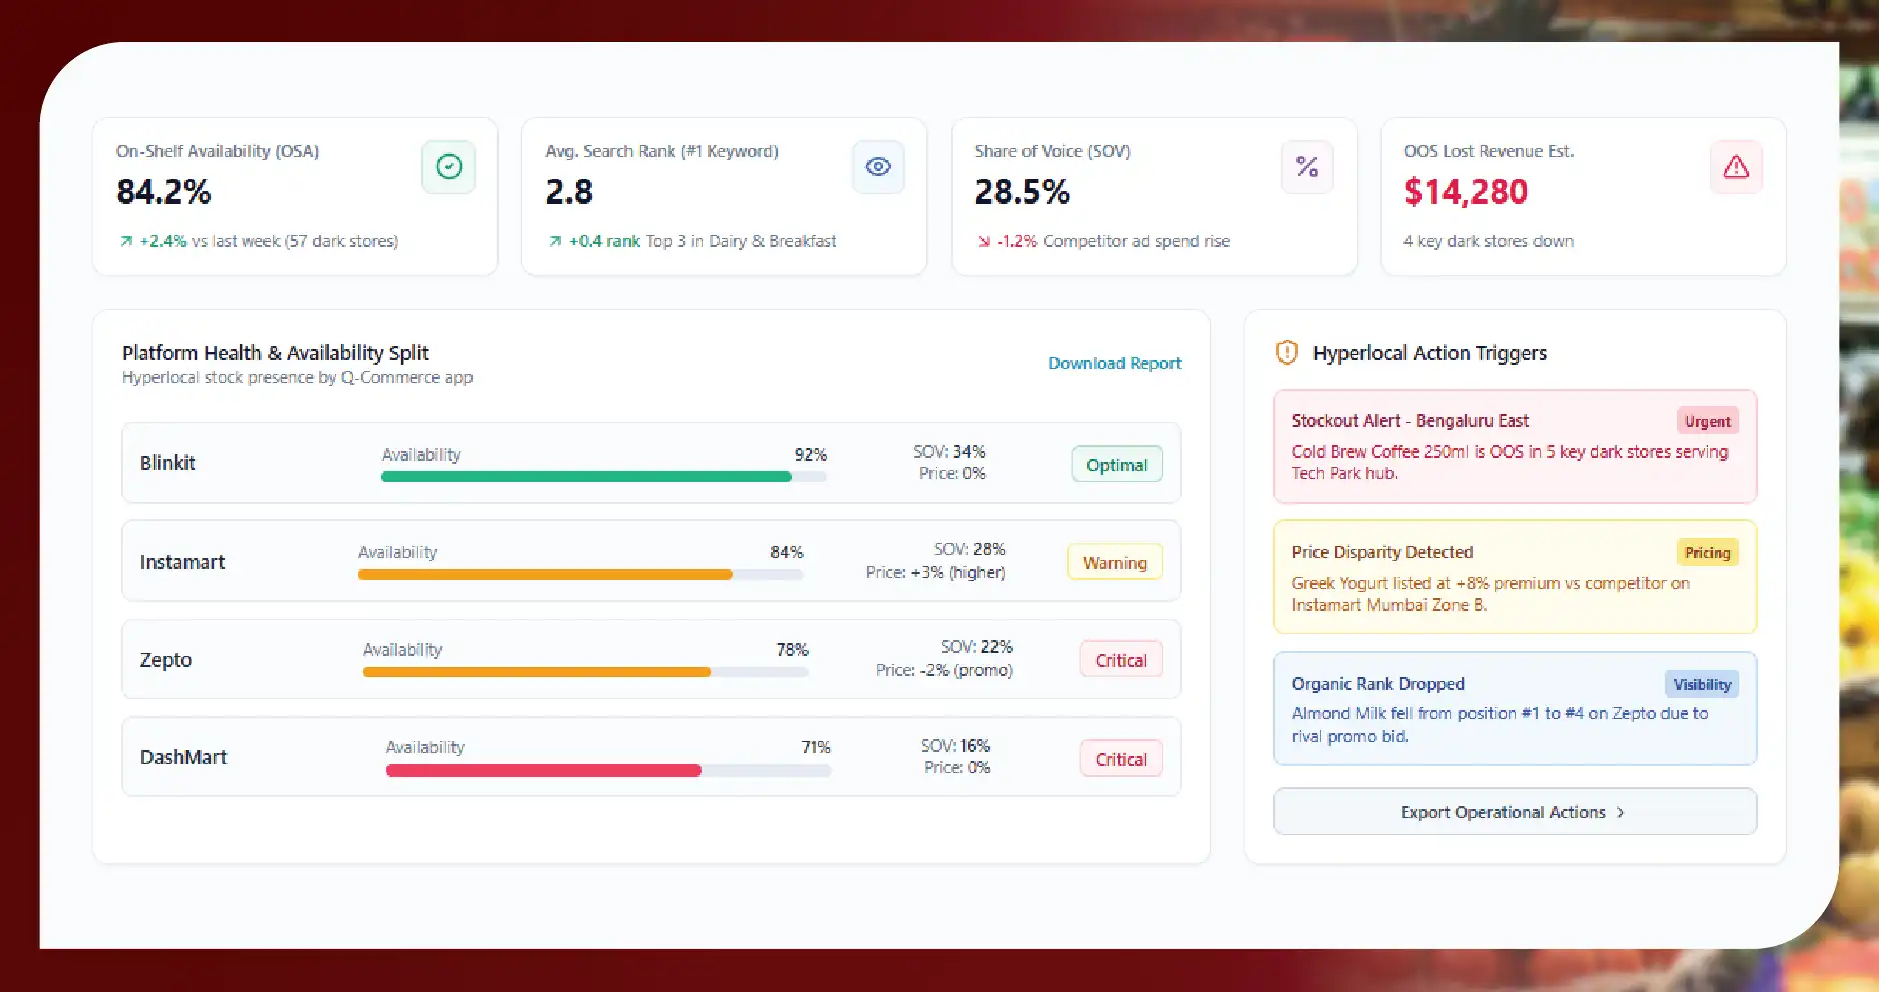
Digital shelf analytics measures how products appear, compete, and perform across online retail environments. In quick commerce, this includes evaluating product discoverability, listing accuracy, pricing, stock availability, promotions, ratings, and competitive positioning.
Unlike traditional e-commerce, quick commerce introduces additional complexity through hyperlocal inventory, dark-store networks, rapidly changing availability, and location-specific pricing. A product may be visible in one neighbourhood but unavailable in another. Its price or promotional offer may also vary across delivery zones.
Consequently, brands need to evaluate their digital shelf at multiple levels, including platform, city, neighbourhood, product category, and individual stock-keeping unit (SKU).
A structured analytics programme connects these observations with weekly business objectives. Marketing teams can measure visibility, sales teams can identify distribution gaps, category managers can compare competitors, and supply chain teams can investigate recurring stockouts.
The most effective programmes combine reliable data collection with clearly defined KPIs, consistent reporting periods, and practical performance thresholds.
10 Weekly KPIs Brands Should Track
1. Product Availability Rate
Product availability measures the percentage of monitored product-location combinations where an item is listed as available for purchase.
For example, if a brand monitors 200 SKU-location combinations and 170 are available during a defined observation period, its observed availability rate is 85%.
Formula:
Availability Rate = (Available SKU-Location Observations ÷ Total Valid Observations) × 100
Tracking Quick Commerce Stock Availability Data helps brands identify distribution gaps, recurring stockouts, and differences between locations. A weekly report should highlight unavailable products, affected delivery zones, and the duration or frequency of observed stockouts.
Brands should distinguish genuine stockouts from unavailable listings, discontinued products, and temporary application errors. Repeated observations throughout the week provide a more reliable picture than a single daily snapshot.
2. Search Visibility and Share of Search
Search visibility measures how frequently a brand's products appear when customers search for relevant keywords, categories, or product types.
Brands should monitor priority terms such as product names, ingredients, pack sizes, and category keywords. They can record whether their products appear in the first visible results, their average ranking, and the competitors appearing alongside them.
A useful KPI is share of search visibility, calculated as the percentage of relevant observed search results occupied by the brand's products.
For instance, if 20 of 100 tracked product appearances belong to a brand, its observed share is 20%.
However, this measure should use a consistent definition of eligible results. Search rankings can change according to location, availability, advertising, and personalization. Weekly tracking helps distinguish sustained visibility improvements from temporary fluctuations.
3. Price Competitiveness Index
Price competitiveness measures how a brand's listed price compares with equivalent competitor products.
A weekly review should capture selling price, displayed discount, effective promotional price, pack size, and unit price wherever available. Comparing equivalent pack sizes or calculating price per gram, litre, or unit prevents misleading comparisons.
Formula:
Price Index = (Brand Price ÷ Competitor Benchmark Price) × 100
An index of 100 indicates price parity with the benchmark. An index above 100 means the brand is more expensive, while a value below 100 indicates a lower price.
Digital Shelf Pricing Analytics allows brands to identify platforms where their products appear overpriced, competitors introducing aggressive discounts, and differences in promotional positioning. Teams should investigate significant price changes before making adjustments because displayed prices may reflect temporary campaigns or location-specific offers.
4. Promotional Visibility and Discount Effectiveness
Promotions can improve product discovery and encourage purchases, but discounts are useful only when customers can see and access the offer.
Brands should track the percentage of eligible SKUs displaying an active promotion, discount depth, promotional duration, and visibility of offer labels. They should also compare promotional activity against competitor campaigns.
For example, if 40 of 100 eligible SKUs display a promotional offer, the observed promotion coverage is 40%.
Weekly reporting should identify products with missing promotional badges, expired offers that remain displayed, inconsistent discount information, and competitors offering deeper reductions.
Where sales and advertising data are available, brands can evaluate whether promotions coincide with improvements in conversion, revenue, or units sold. Listing observations alone cannot establish that a discount caused higher sales, so performance analysis should incorporate actual transaction data.
5. Product Content Completeness and Accuracy
Accurate product information helps customers make confident purchasing decisions. Incorrect pack sizes, missing images, incomplete descriptions, and inconsistent product attributes can reduce clarity and create avoidable complaints.
Brands should track the percentage of listings with complete and accurate product titles, images, descriptions, ingredients, net quantities, brand names, and other relevant attributes.
A practical content completeness score can assign a predefined weight to each required attribute. For example, product titles and pack sizes might receive greater importance than optional descriptive fields.
Weekly monitoring should identify listings with missing images, incorrect variants, outdated information, or inconsistent specifications across platforms.
This KPI is particularly valuable when brands introduce new SKUs, modify packaging, launch seasonal products, or update nutritional and ingredient information. Fixing content errors helps improve the shopping experience while supporting more consistent product representation.
6. Product Rating and Review Trends
Ratings and reviews reveal how customers perceive product quality, packaging, freshness, value, and consistency.
Brands should monitor average ratings, review counts, changes in rating distribution, and newly emerging complaint themes. Where platforms provide review timestamps, weekly comparisons can identify whether customer sentiment is improving or deteriorating.
For example, a product whose average rating declines from 4.4 to 4.1 over several weeks may warrant investigation, particularly if recent reviews mention damaged packaging or inconsistent quality.
Brands should not rely exclusively on average ratings because the same score can conceal different customer experiences. Review text analysis can classify feedback into themes such as taste, quantity, delivery condition, freshness, and value for money.
These observations help product, quality assurance, and customer experience teams prioritize investigations. Ratings should be interpreted alongside review volume because small samples can produce substantial fluctuations.
7. Competitor Assortment and SKU Coverage
Assortment coverage measures how effectively a brand's product range is represented relative to its relevant competitors.
A brand may have strong availability for its leading SKU but lack several variants that competitors offer. These gaps can limit its ability to serve different customer needs, price preferences, and consumption occasions.
Weekly monitoring should compare the number of listed SKUs, available variants, pack sizes, category presence, and newly introduced competitor products.
Quick Commerce KPI Data Scraping helps businesses maintain structured SKU-level observations across multiple platforms and delivery zones.
Teams can identify missing flavours, unavailable pack sizes, discontinued listings, and competitors expanding into adjacent categories. Before interpreting a missing SKU as an assortment gap, they should verify whether it is genuinely absent rather than temporarily unavailable or hidden by search limitations.
This KPI supports assortment planning, distribution discussions, and product launch prioritization.
8. Share of Shelf and Placement Quality
Share of shelf evaluates how much visible digital shelf space a brand occupies within a defined category, search query, or product listing environment.
Depending on the platform's available information, brands can measure the proportion of visible results occupied by their products, their representation in top search positions, and the frequency of premium placements.
The calculation should define its denominator clearly. For example, a brand appearing in six of 30 eligible product positions has an observed placement share of 20%.
Weekly reporting can reveal whether competitors are gaining visibility, whether newly launched products are receiving sufficient exposure, and whether the brand's leading SKUs remain prominent.
Paid placements should be distinguished from organic rankings whenever the platform provides sufficient information. This distinction helps marketing teams understand the different contributions of advertising investment, organic discoverability, and assortment availability.
9. Listing Consistency Across Platforms
Brands frequently distribute products across several quick commerce applications, but their product information may not remain consistent everywhere.
Weekly checks should compare product names, pack sizes, images, descriptions, displayed prices, promotional information, and availability across platforms and locations.
Quick Commerce Market Intelligence Data helps commercial teams detect discrepancies that may otherwise remain unnoticed in separate marketplace reports.
For example, one platform may display a 500-gram pack while another incorrectly lists the same SKU as 450 grams. Another marketplace may continue showing an outdated image following a packaging refresh.
A consistency score can measure the percentage of checked attributes matching approved product information. Exceptions should be recorded with platform, SKU, location, observation time, and expected value.
This KPI supports catalogue governance, reduces confusion, and helps brands coordinate corrective actions with their marketplace partners.
10. Data Freshness and Monitoring Coverage
Even a detailed analytics report can mislead decision-makers when its observations are outdated or its monitoring coverage is incomplete.
Brands should therefore track the percentage of scheduled observations successfully collected, the time since the last successful observation, missing records, and the proportion of priority SKUs covered.
Real-Time Online Shelf Monitoring can help teams identify important changes between scheduled reporting cycles, although the actual refresh frequency depends on collection infrastructure, platform access, and technical limitations.
A weekly report should distinguish between confirmed marketplace conditions and missing or stale observations. For example, a product should not automatically be classified as unavailable simply because its latest status could not be retrieved.
Monitoring coverage and data freshness are essential quality KPIs because they determine whether business teams can confidently interpret the remaining metrics.
Building a Practical Weekly Digital Shelf Scorecard
A weekly scorecard brings individual KPIs into a single operational view. Rather than reporting dozens of disconnected numbers, brands should organize indicators into categories that align with business responsibilities.
| KPI category | Weekly metric | Illustrative target | Review priority |
|---|---|---|---|
| Availability | In-stock observation rate | 95% or higher | High |
| Search visibility | Priority keyword top-result presence | 80% or higher | High |
| Pricing | Price parity against benchmark | Within 5% | High |
| Promotions | Correct active promotion coverage | 98% or higher | Medium |
| Content quality | Required attributes complete | 98% or higher | Medium |
| Customer sentiment | Average product rating | 4.2 or higher | Medium |
| Assortment | Priority SKU coverage | 95% or higher | High |
| Shelf placement | Share of eligible visible results | Establish baseline | Medium |
| Consistency | Approved attributes matching | 98% or higher | Medium |
| Data quality | Successful scheduled observations | 98% or higher | High |
Note: These are illustrative planning targets, not industry-wide benchmarks. Brands should establish realistic thresholds using historical performance, category conditions, commercial priorities, and platform-specific requirements.
Each KPI should include the current week's value, previous week's value, percentage-point change where appropriate, affected SKUs, responsible team, and recommended action.
For example, a decline in availability combined with stable pricing may indicate a replenishment issue. A drop in search visibility alongside strong availability may suggest a discoverability problem. Combining related indicators helps teams identify possible causes rather than treating every change as an isolated event.
How Brands Can Turn Weekly KPIs Into Action
An effective monitoring process begins with a defined list of priority SKUs, competitor products, platforms, and delivery locations. Brands should then establish consistent observation schedules and standardize product identifiers so the same item can be compared across reporting periods.
Data collection should capture timestamps, location information, source platform, product identifiers, prices, availability, promotional details, and relevant listing attributes. Historical records are important because they reveal recurring patterns that a single snapshot cannot show.
The next step is to validate observations. Unexpected price movements, missing products, and sudden ranking changes should be checked against subsequent observations where feasible. This helps separate genuine marketplace changes from transient errors.
Finally, teams should assign responsibility for corrective actions. Supply chain teams may investigate availability problems, marketing teams may address visibility gaps, catalogue managers may correct product information, and commercial teams may review pricing differences.
A consistent weekly meeting can examine the largest deviations, their business implications, and the actions required before the next reporting cycle. Over time, this process creates a repeatable feedback loop between digital shelf measurement and commercial execution.
How Food Data Scrape Can Help You?
1. Structured Marketplace Data Collection
Food Data Scrape can help brands collect structured product listings, prices, ratings, promotions, and availability observations across supported quick commerce platforms, creating consistent datasets for weekly KPI evaluation and comparison.
2. Competitor Pricing Intelligence
By organizing competitor prices, pack sizes, and promotional information, Food Data Scrape can help businesses identify pricing gaps, compare equivalent products, monitor discount movements, and support informed commercial decisions.
3. Availability and Distribution Monitoring
Brands can use recurring product availability observations to identify potential stockouts, location-specific gaps, and assortment inconsistencies, helping supply chain teams prioritize investigations and coordinate corrective action with relevant marketplace partners.
4. Product Visibility and Content Analysis
Structured digital shelf information helps businesses evaluate search placement, listing completeness, image availability, and product information consistency, enabling marketing and catalogue teams to identify weaknesses and improve online product presentation.
5. Customized Analytics and Reporting
Food Data Scrape can support tailored datasets and reporting workflows that organize marketplace observations by SKU, category, platform, and location, helping stakeholders review weekly performance and prioritize measurable improvement opportunities.
Conclusion
Digital shelf analytics has become an important capability for brands competing in the fast-paced quick commerce environment. Tracking product availability, search visibility, pricing, promotions, content quality, customer sentiment, assortment, shelf placement, listing consistency, and data freshness gives businesses a more comprehensive view of their online performance.
The greatest value comes from measuring these KPIs consistently, comparing current results with historical observations, and translating significant deviations into practical action. Brands should begin with their highest-priority products and locations, establish reliable baselines, and expand monitoring as their analytical capabilities mature.
A well-designed Quick Commerce Analytics Dashboard can bring weekly KPIs, historical trends, competitor comparisons, and performance exceptions together in one reporting environment. Supported by a Quick Commerce Data Scraping API, businesses can integrate structured observations into existing analytics systems, reporting pipelines, and internal applications.
Maintaining a reliable Quick Commerce Dataset also allows brands to investigate recurring patterns, evaluate strategic changes, and improve decisions over time. With a disciplined measurement framework and dependable data collection, businesses can strengthen product visibility, improve digital shelf execution, and respond more effectively to changing marketplace conditions.
Are you in need of high-class scraping services? Food Data Scrape should be your first point of call. We are undoubtedly the best in Food Data Aggregator and Mobile Grocery App Scraping service and we render impeccable data insights and analytics for strategic decision-making. With a legacy of excellence as our backbone, we help companies become data-driven, fueling their development. Please take advantage of our tailored solutions that will add value to your business. Contact us today to unlock the value of your data.