
On a 10-minute app there is no aisle to browse. The search bar is the shelf, and rank in a keyword result — which changes by pin code and by hour — decides whether a shopper ever sees your product.
Why the search bar is the new shelf
In a supermarket, a shopper walks an aisle and sees forty products whether they intended to or not. On a quick-commerce app, they type a category word and see six. Everything below that is a scroll most shoppers never make.
That changes what "out of stock" means. If a competitor outranks you for your category head term in a given zone, you are functionally out of stock there — your inventory is sitting in the dark store, and no one browsing that keyword will find it. The shelf didn't shrink; it moved into the ranking.
What exactly gets tracked
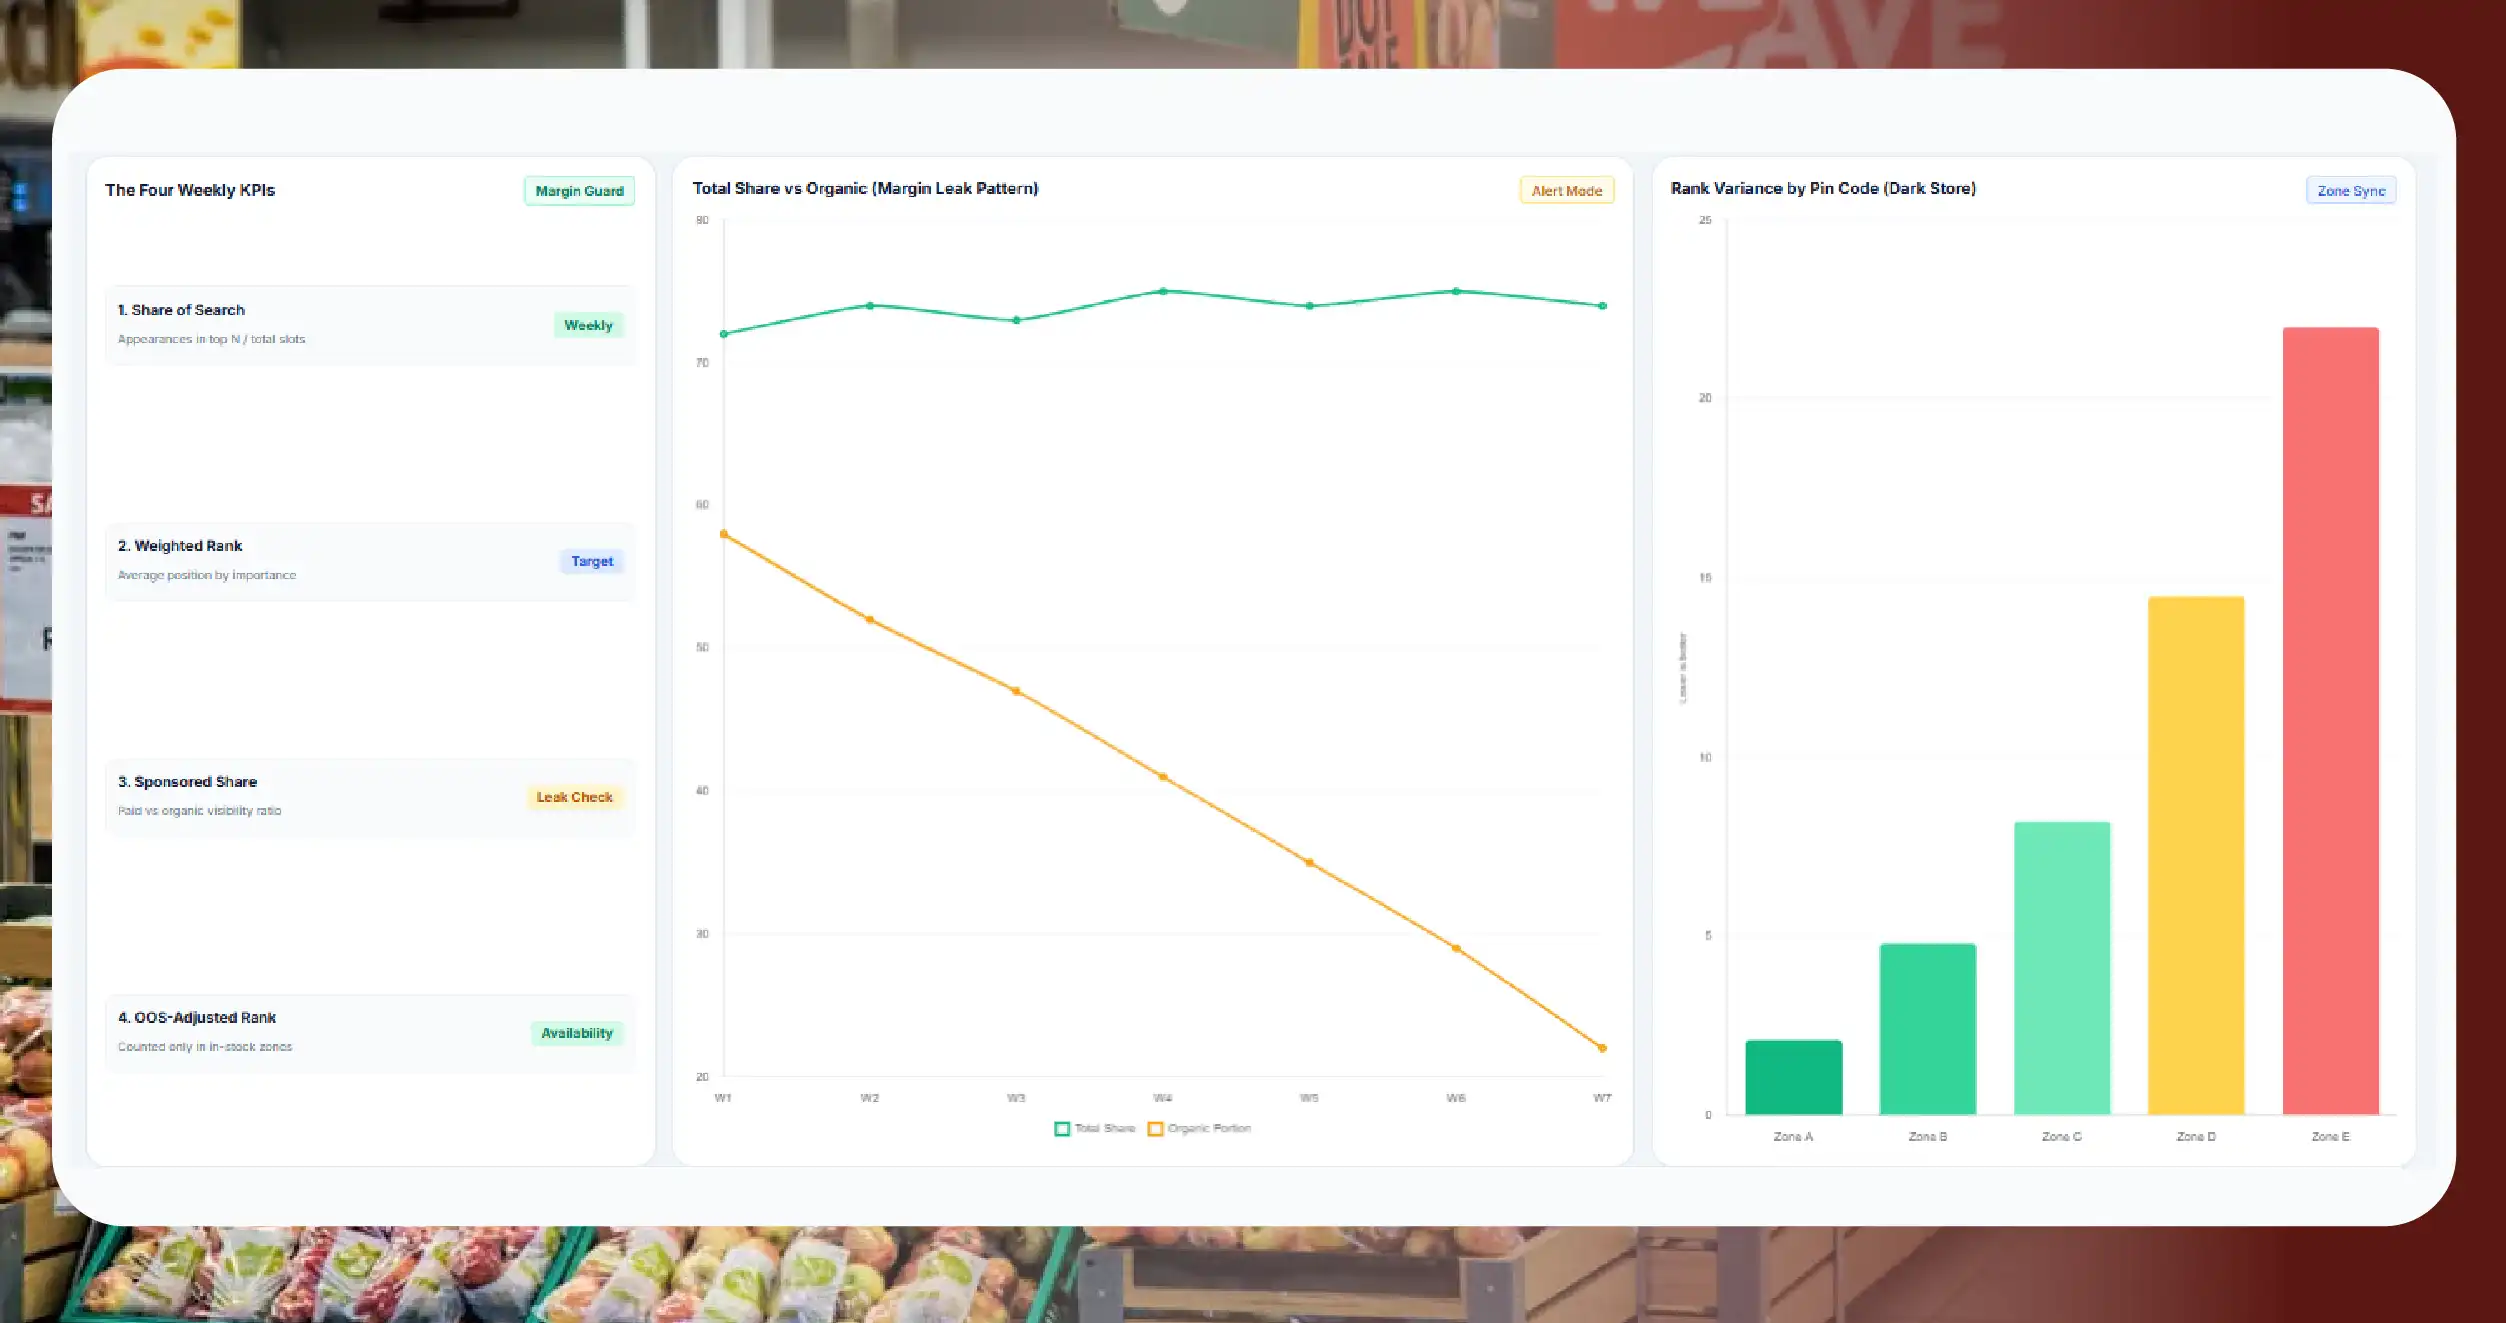
Four data layers, collected together. Any one on its own gives a misleading picture.
Keyword set
20–100 terms per category: head terms ("namkeen"), brand terms (yours and your rivals'), and occasion or attribute terms ("diet chips", "party pack").
Rank per zone
The same keyword returns different results by pin code, because results reflect dark-store inventory and local signals. City averages hide this entirely.
Competitor visibility
Who occupies positions 1–10 for each keyword in each zone — and whether they got there organically or through sponsored placement. Track the two separately.
Content drift
Title, image and description changes on your listings and your rivals'. Content edits usually arrive shortly before rank moves.
The four metrics that turn this into a KPI
Tracking without a number your category team reviews weekly is just monitoring.
Share of search
Your SKUs' appearances in the top N across the keyword set, divided by total available slots. Track weekly, per platform, per city.
Weighted rank
Average position weighted by keyword importance, so a slip on your head term doesn't get averaged away by a long tail you don't care about.
Sponsored share
What percentage of your visibility is paid. Rising paid share against flat organic rank is margin leak, not growth — this is the metric that catches it.
OOS-adjusted rank
Rank counted only in zones where you are actually in stock. This is what connects search data to availability tracking.
The pattern to watch is the one drawn above: total share holding steady while the organic portion of it shrinks. Share of search looks flat in the weekly review, and the cost of holding it quietly rises.
What brands actually do with it
Three plays, in the order most teams find them.
The content play
Align listing titles and attributes with how shoppers actually search the category, then measure rank movement across the affected term set rather than SKU by SKU.
The availability play
Rank collapses zone by zone when a stock-out persists, and it doesn't come back the moment stock does. Catching the first step prevents the third.
The paid play
Bid where organic rank sits between 4 and 10 — winnable positions. Bidding at 1–3 pays for visibility you already have; above 20 you have a content problem that spending won't fix.
How the data is collected
The same public-data method as pricing tracking: scheduled keyword queries per pin code, parsed result sets, organic and sponsored listings separated, refreshed daily.
Competitor visibility needs no seller-account access, because none of it is private — it is all on the public result page a shopper sees. That is also the honest limit of the method: it captures the logged-out result set, not personalised results or anyone's internal sales data.
Questions
Frequently Asked Questions
The percentage of top-visible result slots your products occupy across a defined keyword set on Blinkit, Zepto or Instamart — the quick-commerce equivalent of share of shelf, measured per pin code rather than per store.
Results reflect dark-store-level inventory and local demand signals, so the same keyword shows different products in different zones of the same city. A city-average rank can look stable while half your zones have slipped.
Yes — result pages mark promoted listings, and separating them is essential. Paid visibility masking organic decline is the most common hidden problem we see in brand tracking.
Most start with 20–50 per category — head terms, brand terms, rival brand terms and attribute terms — across their top cities, then expand once a weekly review cadence has actually stuck.



