
Introduction
Most restaurant demand forecasting is an exercise in staring at your own past.
A chain feeds two years of its own transaction history into a model, adds day-of-week and seasonality, and produces a forecast. The model is technically competent. It is also structurally blind, because it can only ever learn from what already happened inside the four walls of the business.
It does not know that a competitor opened three hundred metres away last Tuesday. It does not know that the same competitor is running a 40% delivery promotion this weekend. It does not know that a stadium event will displace fifteen thousand people into the catchment on Saturday evening. It does not know that a viral dish has driven a 300% surge in demand for a category it has never carried. It does not know that a rival's kitchen went dark yesterday and their demand is now yours.
Every one of those facts is knowable. None of them is in your point-of-sale data.
The chains reporting 96.7% forecast accuracy and 30%-plus reductions in food waste are not running better algorithms than everyone else. They are feeding better inputs. Specifically, they are feeding their models external demand signals that internal data cannot contain.
Restaurant Demand Forecasting Data is that external layer. At FoodDataScrape, we crawl 220M+ pages of food data every week and turn it into structured demand signals — competitor activity, promotional intensity, menu trend velocity, delivery platform behaviour and catchment dynamics — that plug directly into a chain's forecasting stack. This article is the playbook.
Why Internal Data Alone Hits a Ceiling
There is a hard accuracy ceiling on any model trained exclusively on internal history, and it is easy to explain.
Your sales are the product of your offer and the market's state. Internal data captures the first perfectly and the second not at all. Every fluctuation caused by the market — a competitor's promotion, a new entrant, a trend shift, a closure — arrives in your model as unexplained noise. The model learns to treat it as randomness, because from its perspective, it is randomness.
This produces three characteristic failure patterns:
The model is excellent on ordinary days and useless on the days that matter. Tuesdays are predictable. The Saturday when a competitor launches a promotion is not — and that is the day your forecast error costs you money.
Forecast error is asymmetric and expensive in both directions. Under-forecast and you stock out, lose the sale, and lose the customer. Over-forecast and you produce food that goes in the bin. Food waste in foodservice is a direct, unrecoverable margin loss.
New sites and new items are unforecastable. A model trained on your history has no history for a store that opened last month or an item launched last week. External catchment and category data can forecast both from day one.
The External Signals That Move the Needle
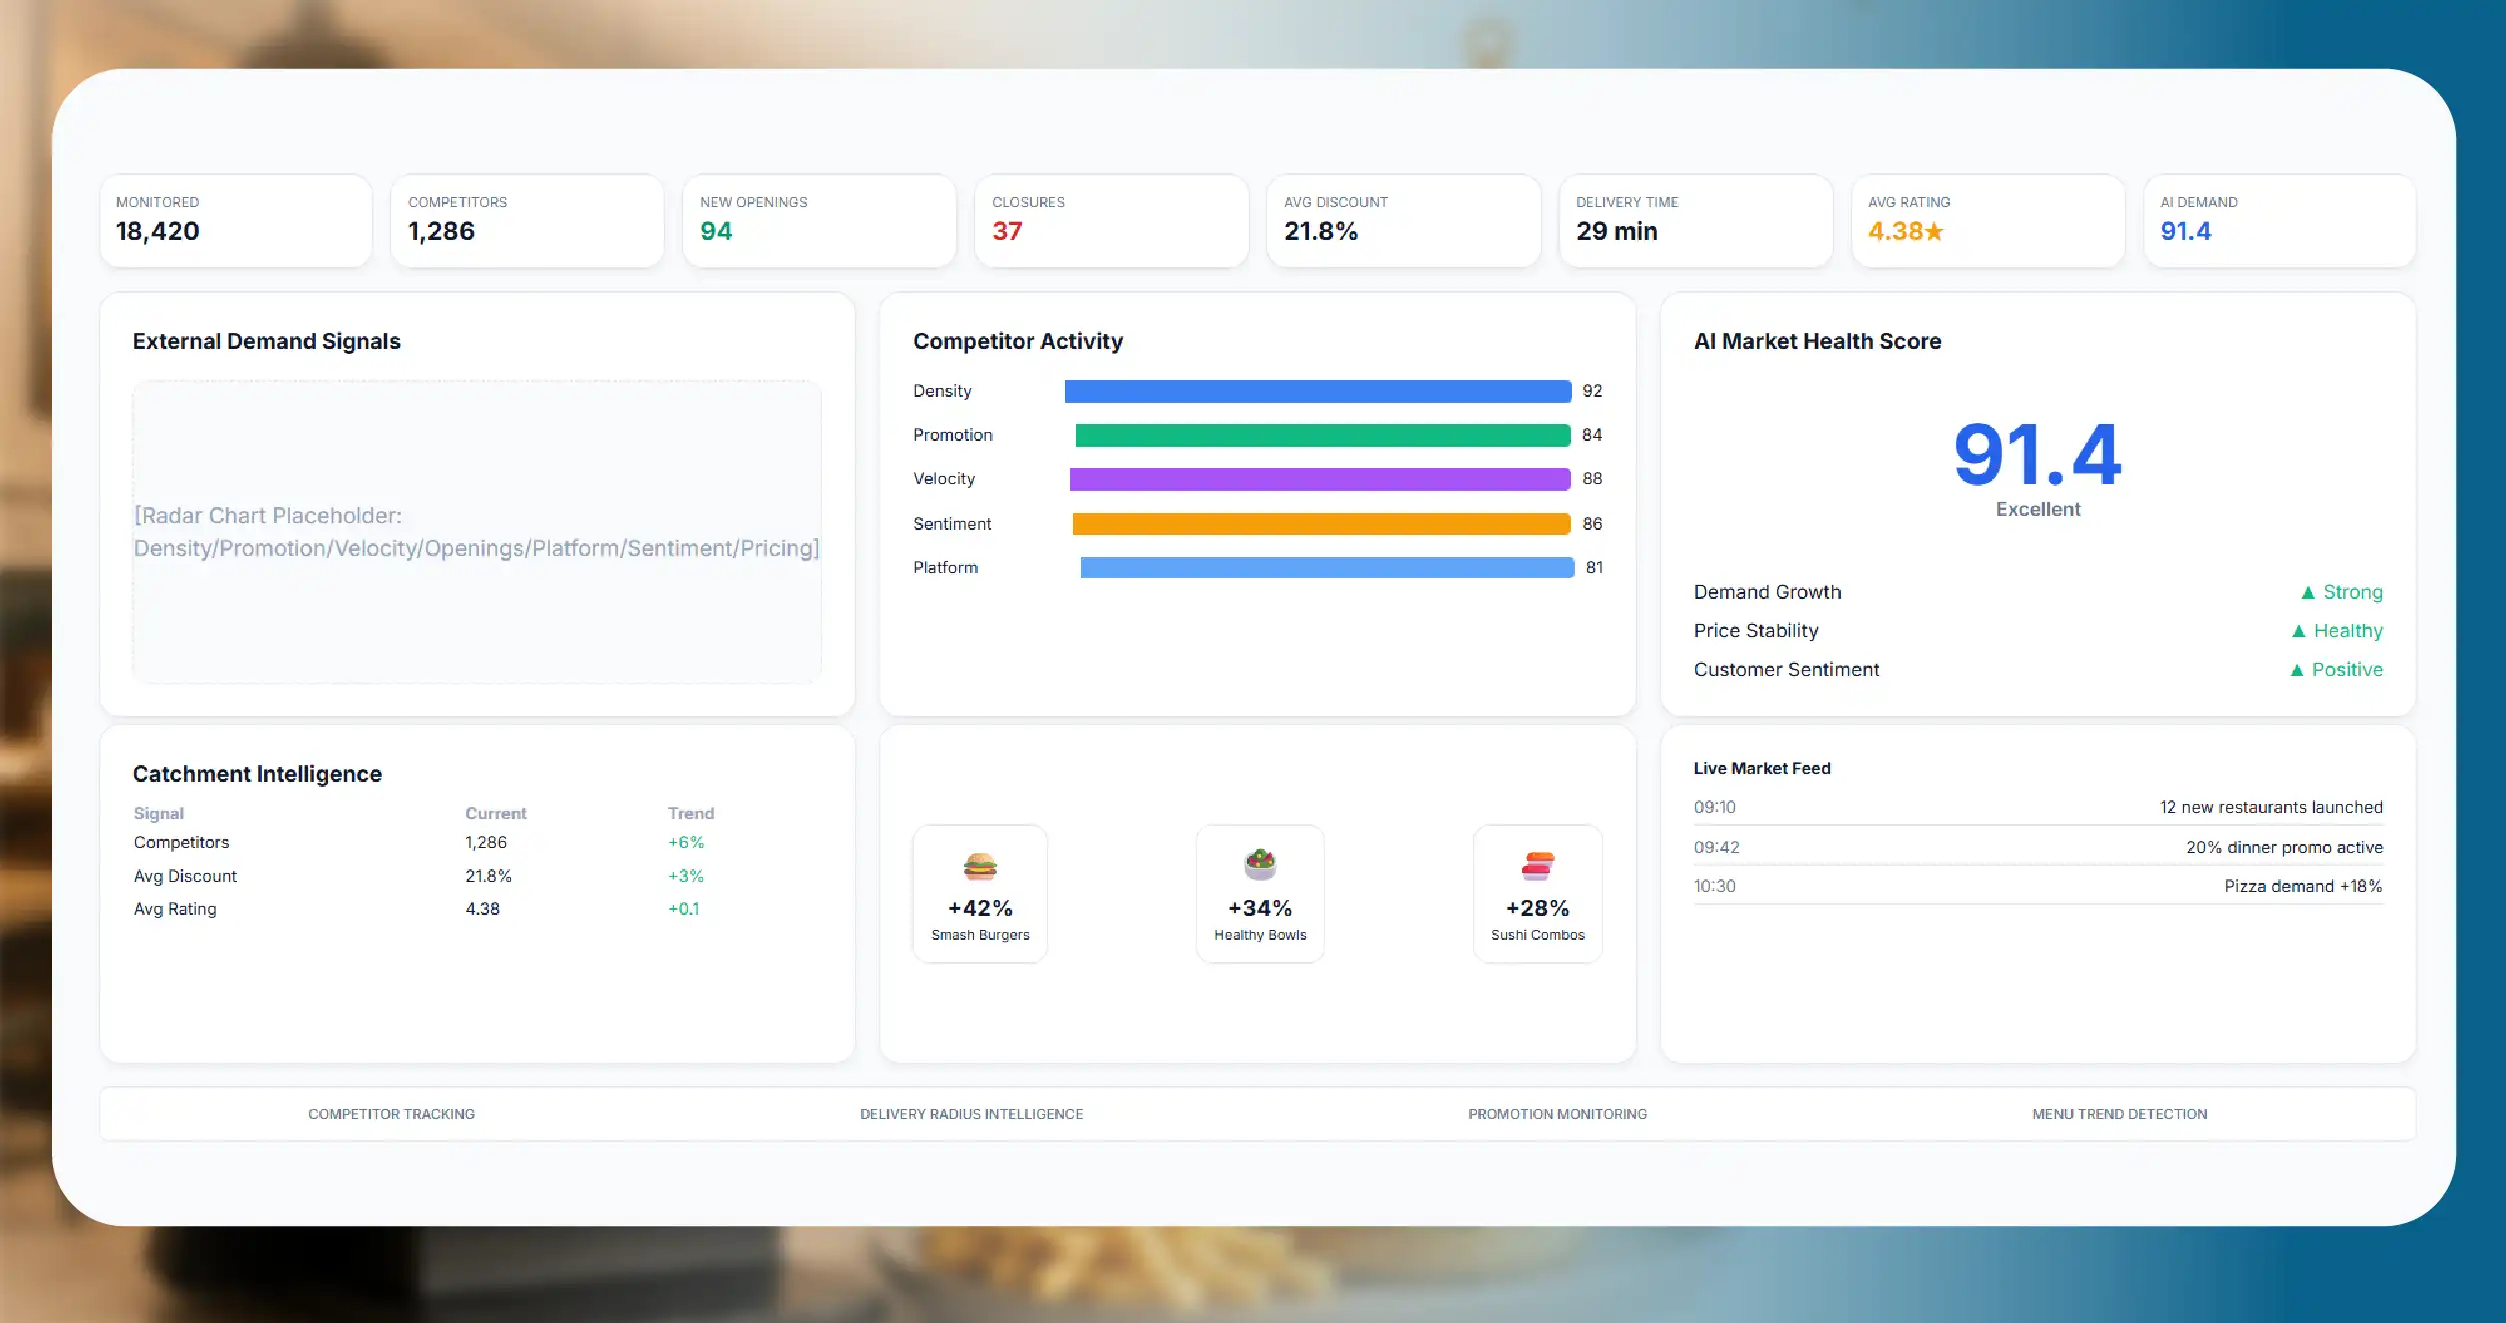
Competitor density and activity. How many comparable restaurants operate within your delivery radius, what they charge, what they promote, when they promote, and whether they are open. A competitor's temporary closure is a measurable demand transfer to you.
Promotional intensity in the catchment. Aggregate discount depth across competitors in your radius, by day and by hour. This is one of the strongest single predictors of your own delivery volume, and it is entirely external.
Menu trend velocity. The rate at which a dish or category is being added to menus across the market. A category adding menus at pace is a category where demand is running ahead of supply — and where your existing items in that category will over-perform your historical baseline.
New openings and closures. Every new competitor in the catchment is a demand dilution event with a measurable magnitude. Every closure is a demand transfer. Both are visible on delivery platforms within days.
Delivery platform behaviour. Delivery promise times, platform-level promotional pushes, and rank position all shift volume independently of anything you do.
Review velocity and sentiment. A competitor's rating collapse is a leading indicator of demand moving to you. A rise in complaints about wait times in the catchment is a demand signal.
Category price levels. If the average price of your category in the catchment falls, your volume at an unchanged price will fall too — before any of your internal data shows it.
Sample Data: A Catchment Demand Signal Record
The structure below reflects a FoodDataScrape forecasting signal feed. Values are illustrative.
{
    "site_id": "CHAIN-QSR-0421",
    "location": "Pune — Baner",
    "catchment_radius_km": 4,
    "forecast_date": "2026-07-18",
    "competitor_signals": {
        "competitors_in_radius": 47,
        "new_openings_last_30d": 3,
        "closures_last_30d": 1,
        "competitors_promoting_on_date": 19,
        "avg_competitor_discount_pct": 22.4,
        "promotional_intensity_index": 78
    },
    "category_signals": {
        "category_avg_price_inr": 289,
        "category_price_change_30d_pct": -4.2,
        "menu_trend_velocity_index": 61,
        "trending_items_in_category": ["Korean Fried Chicken", "Loaded Fries"]
    },
    "platform_signals": {
        "avg_delivery_promise_min": 31,
        "platform_promo_active": true,
        "your_category_rank": 6
    },
    "demand_modifiers": {
        "competitor_promo_pressure": -0.08,
        "closure_demand_transfer": 0.03,
        "category_price_deflation": -0.02,
        "trend_tailwind": 0.05,
        "net_demand_modifier": -0.02
    },
    "recommended_forecast_adjustment": "-2% vs internal baseline"
}
The demand_modifiers block is the entire product. Each line is a named, quantified, external force acting on your demand on a specific date — and the net modifier is a single number your existing forecasting model can consume without being rebuilt.
That last point matters more than anything else in this article. You do not need to replace your forecasting system. You need to give it the inputs it is missing.
Sample Data: Forecast Accuracy Improvement
| Model Configuration | MAPE | Forecast Accuracy | Food Waste vs Baseline |
|---|---|---|---|
| Internal POS history only | 12.8% | 87.2% | Baseline |
| + Day-of-week & seasonality | 9.4% | 90.6% | −7% |
| + Weather signals | 7.9% | 92.1% | −13% |
| + Competitor & promotional signals | 4.6% | 95.4% | −26% |
| + Menu trend & category signals | 3.3% | 96.7% | −31% |
MAPE is mean absolute percentage error — the lower the better.
Two observations. First, the jump from 92.1% to 95.4% comes entirely from external competitor and promotional data — signals a chain cannot generate internally at any price. Second, the waste reduction tracks accuracy almost linearly, which is exactly what you would expect: waste is largely a function of over-forecasting, and over-forecasting is largely a function of not knowing what the market was about to do.
The 96.7% figure is not a marketing number. It is what happens when a competent model finally gets to see the market it operates in.
Sample Data: Menu-Level Prep Forecast
Site: CHAIN-QSR-0421 — Saturday, 18 July 2026
| Item | Internal Baseline | External Adjustment | Adjusted Forecast | Driver |
|---|---|---|---|---|
| Classic Burger | 340 units | −9% | 309 | 3 competitors promoting burgers at 30%+ |
| Korean Fried Chicken | 95 units | +24% | 118 | Category trend velocity high; 2 competitors OOS |
| Loaded Fries | 210 units | +11% | 233 | Trending item; low competitor coverage |
| Veg Wrap | 140 units | −3% | 136 | Category price deflation in catchment |
| Cold Coffee | 260 units | +6% | 276 | Nearest competitor closed 12 July |
| Desserts (all) | 180 units | −1% | 178 | Neutral |
This table is where forecasting stops being a finance exercise and becomes an operations one. The kitchen preps 309 burger patties instead of 340 — saving 31 units of waste — and preps 118 portions of Korean fried chicken instead of 95, capturing 23 sales that would otherwise have been lost to a stock-out.
The chain did not build a better model. It gave its existing model eyes.
Implementation: How Chains Actually Roll This Out
The chains that succeed with external signals follow a consistent path. The ones that fail try to do everything at once.
Step 1 — Backfill and validate before you trust anything. Take twelve months of historical external signals for a subset of sites and re-run your existing model with them included. Compare against your actuals. You now have a measured accuracy improvement on your own data, not a vendor's claim. If the improvement is not material, you have learned that cheaply.
Step 2 — Start with one signal family. Competitor promotional intensity is usually the highest-yield starting point, because it is the strongest single external predictor and the easiest to interpret. Adding six signal families simultaneously makes it impossible to attribute improvement.
Step 3 — Pilot on high-waste sites, not average ones. The return is largest where the error is largest. Sites with volatile demand and high waste show the improvement fastest and build the internal case.
Step 4 — Push forecasts to prep level, not just to the P&L. A forecast that improves a finance number but never reaches the kitchen changes nothing. The waste reduction happens when a shift manager preps 309 patties instead of 340.
Step 5 — Keep the override. Operations managers know things the data does not — a road closure, a local event, a staffing gap. Named, traceable demand modifiers let them see why the forecast moved and override it with reason. A black-box forecast that cannot be interrogated will be ignored within a month, no matter how accurate it is.
The chains that treat this as a data science project usually stall. The ones that treat it as an operations project usually succeed.
Who Uses Restaurant Demand Forecasting Data
QSR and restaurant chains. Improve prep-level forecasting, reduce food waste, cut stock-outs on high-demand items, and forecast new site performance before opening.
Cloud kitchen operators. Forecast at the brand-and-kitchen level across catchments where internal history is thin or nonexistent.
Contract caterers and institutional foodservice. Forecast demand across sites with volatile, event-driven footfall.
Food distributors and suppliers. Forecast downstream customer demand to optimise their own inventory and delivery scheduling.
Restaurant technology and forecasting platforms. Enrich their own products with external market signals they cannot collect themselves.
Private equity and operator groups. Model site-level performance across a portfolio using external catchment data rather than relying on operator-supplied projections.
The FoodDataScrape Forecasting Signal Data Model
- Catchment definition: site coordinates, radius, delivery polygon, competitor universe within radius
- Competitor signals: competitor count, cuisine and price band mix, open/closed status, new openings, closures, menu changes
- Promotional signals: active promotions by competitor, discount depth, promotional intensity index by day and hour
- Category signals: category average price, price movement, menu trend velocity, trending and declining items
- Platform signals: delivery promise times, platform-level promotional activity, category rank position
- Performance proxies: competitor rating, review velocity, sentiment shifts
- Derived modifiers: named, quantified demand modifiers with a net adjustment factor, delivered per site per date
- Historical backfill: signal history for model training, so a chain can retrain on external data it never had
Delivered via API, database push, cloud storage or direct integration into forecasting, ERP and inventory systems.
Methodology and Compliance
- We collect publicly accessible restaurant, menu, pricing and promotional information only. No authenticated content, no private data, no personal consumer data.
- Signals are delivered as inputs, not as forecasts. We do not replace your model. We supply the external variables it is missing, in a form it can consume directly.
- Demand modifiers are named and traceable, so an operations manager can see exactly why the forecast moved and can override it if they know something the data does not.
- Historical signal backfill is provided so that models can be trained and validated on external data rather than having to wait for it to accumulate.
- Crawlers are rate-limited and designed not to degrade the platforms we collect from.
Measurable Outcomes
| Metric | Internal Data Only | With External Signals |
|---|---|---|
| Forecast accuracy (MAPE) | 12.8% | 3.3% |
| Food waste | Baseline | −31% |
| Stock-outs on trending items | Frequent | Materially reduced |
| New site forecastability | Not possible | Day-one forecast from catchment data |
| Competitor promotion awareness | After the fact | Forecasted into prep |
| Model rebuild required | — | No — signals plug into existing model |
Conclusion
A forecasting model trained only on internal data is a model that has never seen the market. It knows what you sold. It does not know why. And on the days when the market moves — a competitor promotes, a rival closes, a category surges — it fails precisely when accuracy is worth the most.
The chains hitting 96.7% accuracy and cutting waste by a third did not out-engineer everyone else. They stopped forecasting in the dark.
Restaurant Demand Forecasting Data gives your existing model the external signals it has always been missing — competitor activity, promotional pressure, category trends and catchment dynamics, quantified and delivered as inputs it can use today.
FoodDataScrape crawls 220M+ pages of food data every week so that your forecast finally accounts for the world outside your four walls.
Questions
Frequently Asked Questions
No. This is the most common misconception. We deliver external signals as structured inputs. Your existing model consumes them alongside its internal features.
Promotional and competitor signals are typically observable several days ahead, since promotions are published before they run. Trend and category signals operate on longer horizons.
Yes — this is one of the strongest use cases. A new site has no internal history, but its catchment has a complete external history.
India, the US, UK, Gulf, Europe and Southeast Asia, scoped to your operating footprint.
Daily, with promotional and availability signals refreshed more frequently where volatility warrants it.
Yes. Historical backfill is available and is usually the first thing a data science team asks for.
Get a Free Food Data Sample in 48 Hours.
Tell us your platforms, target markets and required fields — we'll map exactly what's possible with food data scraping, recommend the right approach, and send a working sample so you can verify quality before any commitment.
Request a strategy call
Thanks — our data team will reach out within 48 hours with your sample.



