

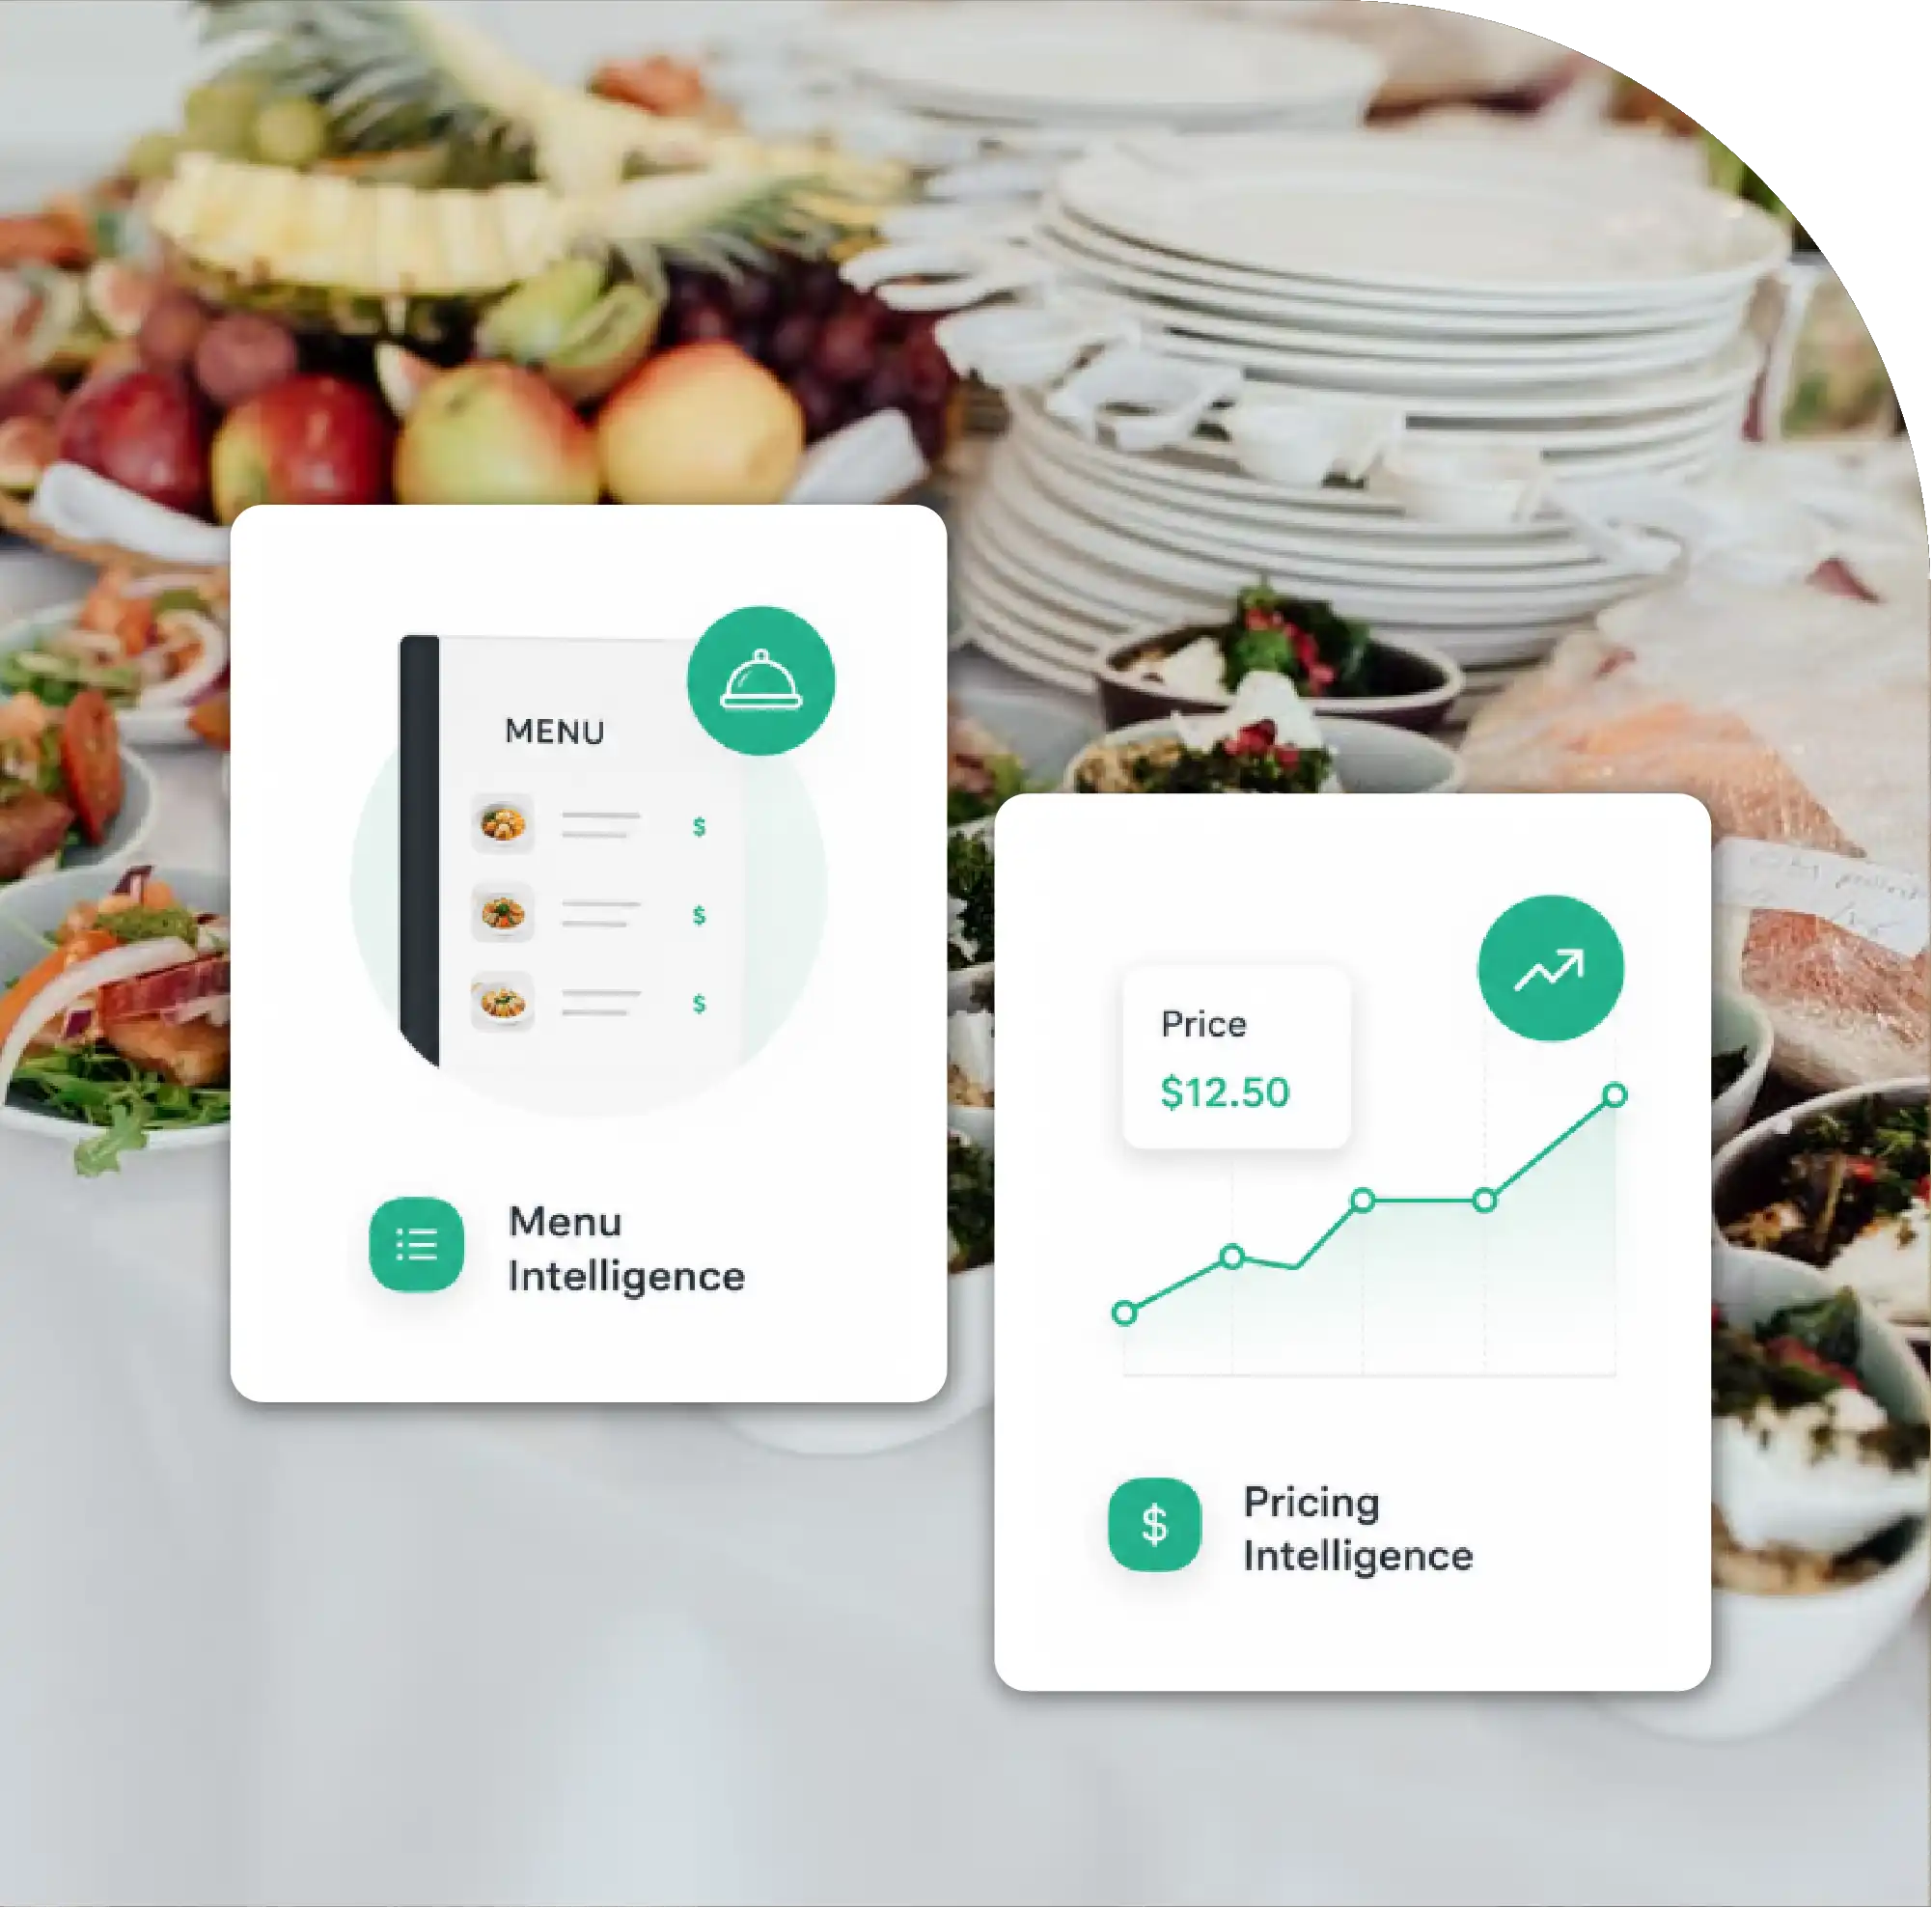
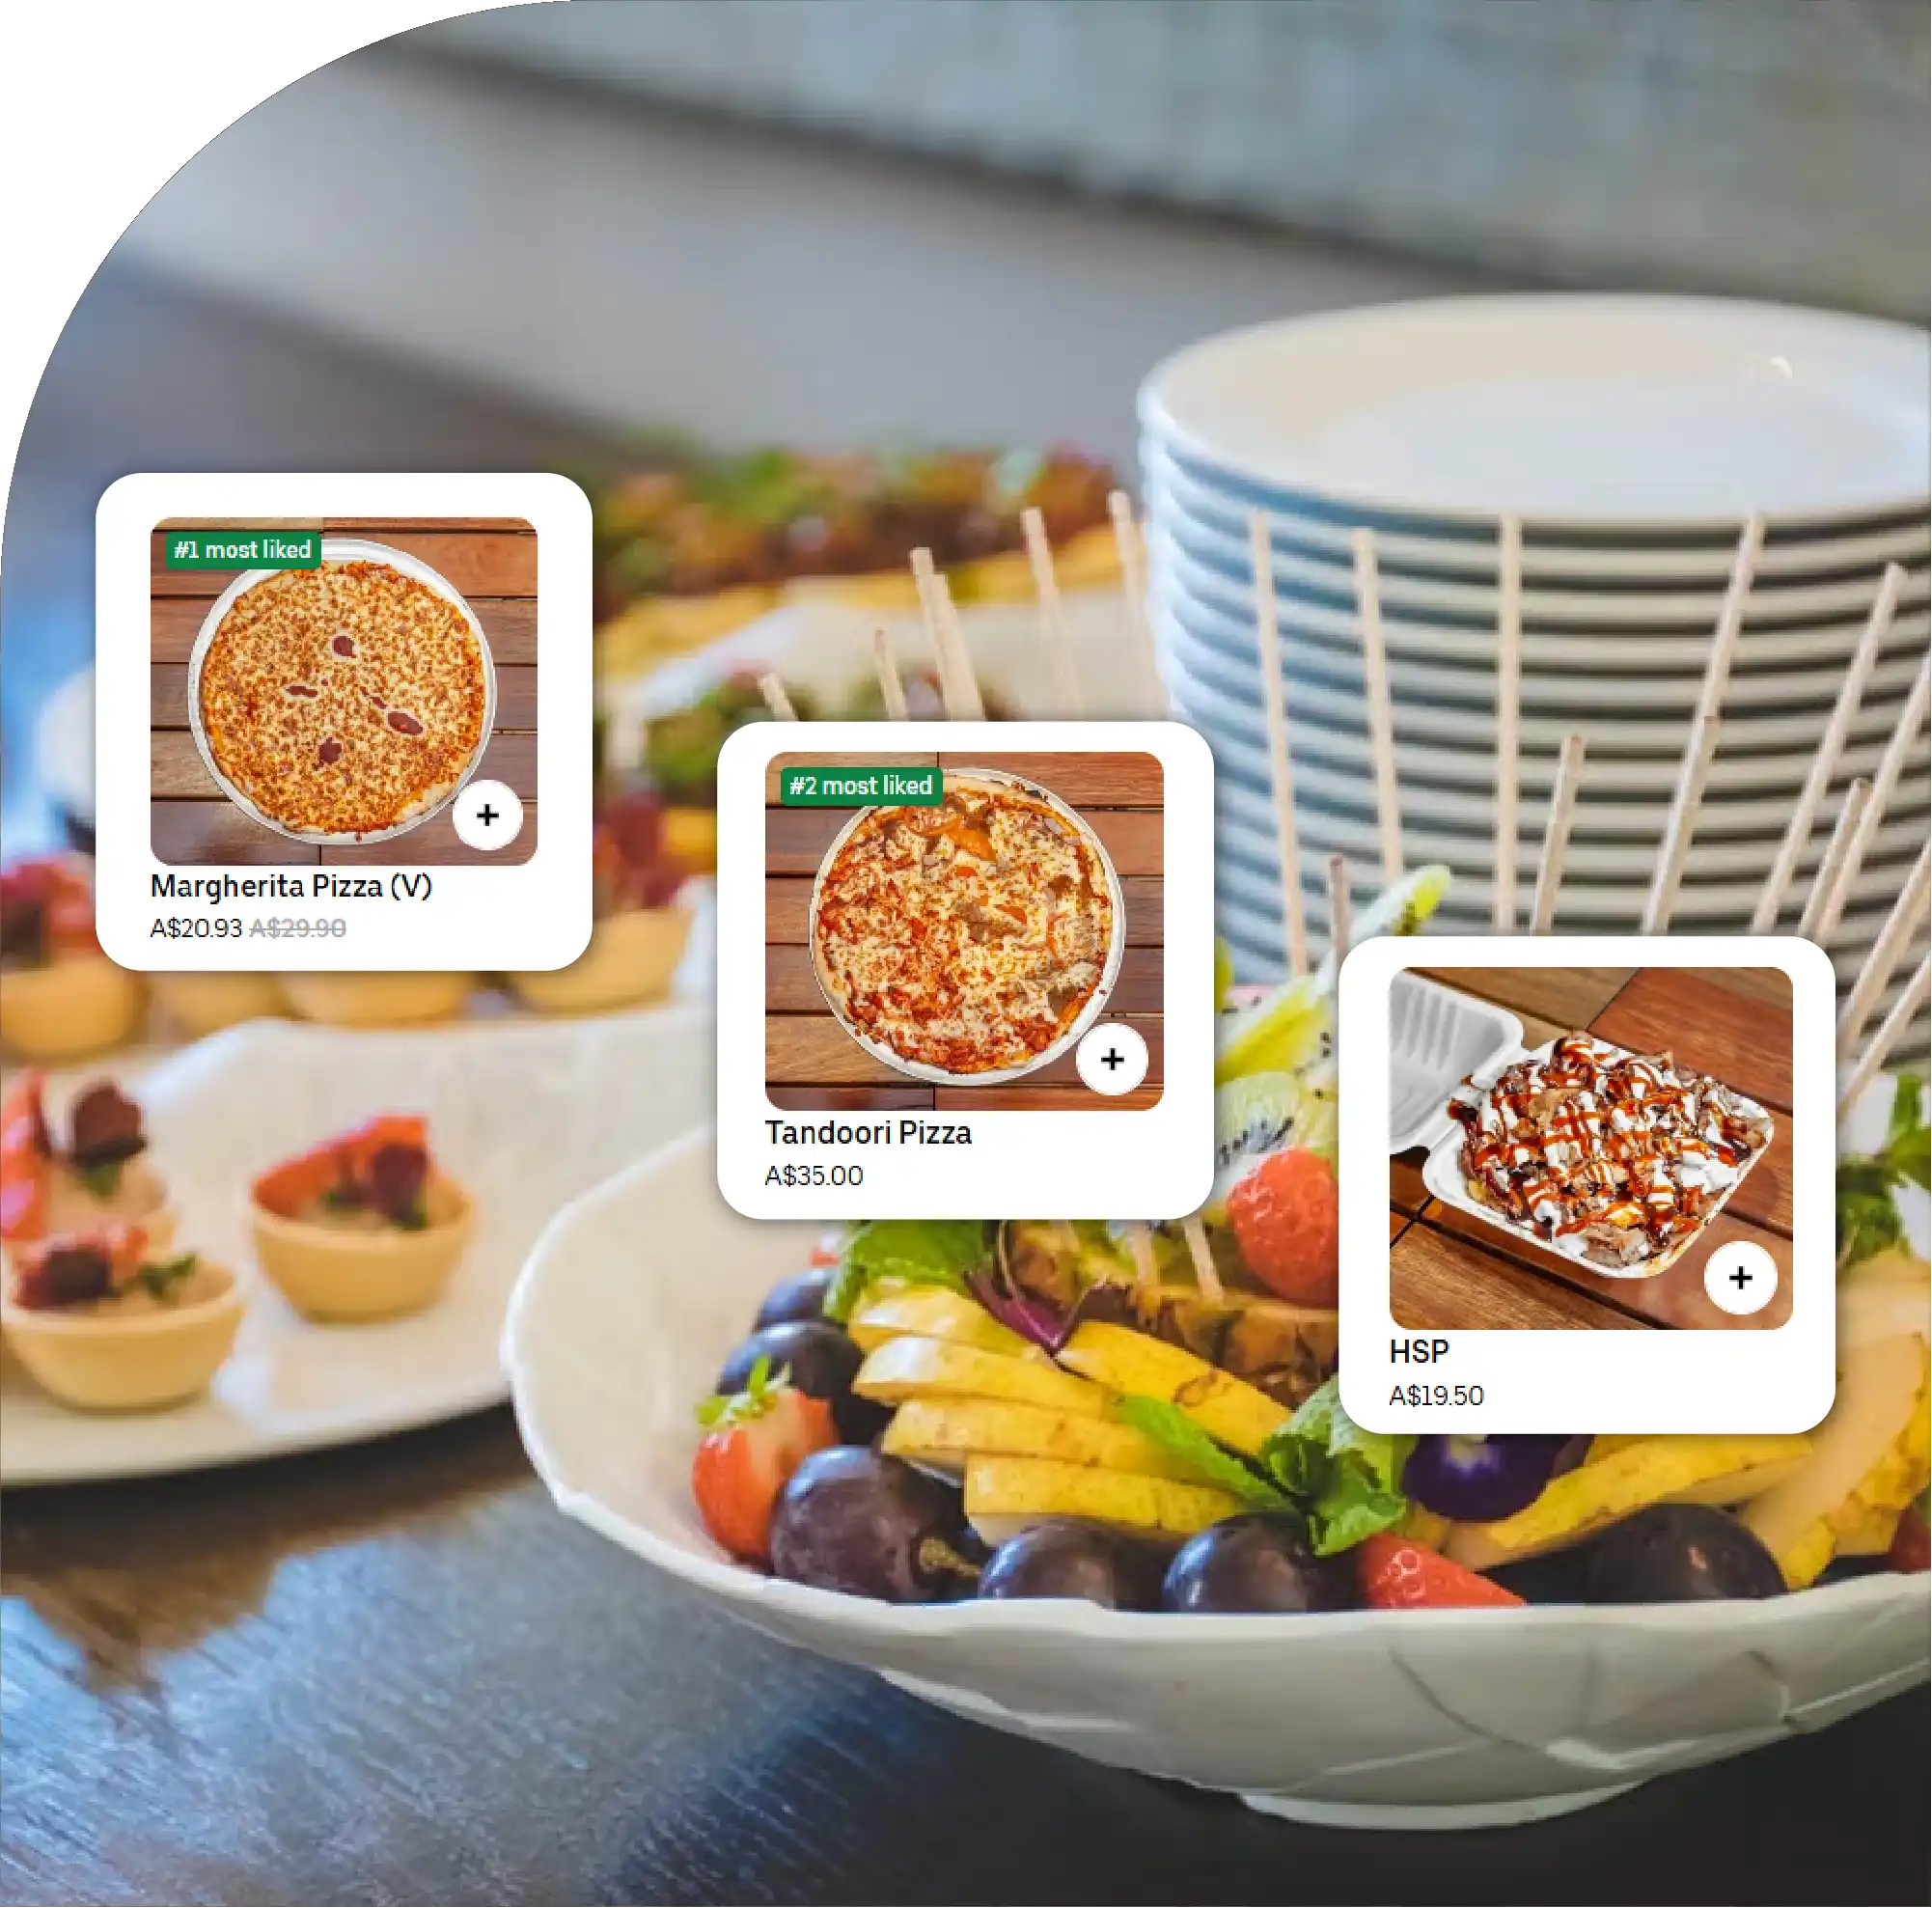
Real-Time Pricing Intelligence: Track competitor prices, discounts, promotions, and price changes across locations and platforms.
Comprehensive Menu Monitoring: Capture menu items, categories, descriptions, add-ons, availability, ratings, images, and delivery information.
Competitive Benchmarking: Compare item-level pricing, menu sizes, discount rates, delivery fees, and positioning against competing brands.
Historical Market Insights: Analyze 7, 30, 90, or 180-day menu and pricing changes to identify meaningful market trends.
Data-Driven Restaurant Strategy: Support pricing optimization, menu engineering, promotion planning, expansion decisions, franchise management, and product development.

Restaurant brands increasingly compete on more than taste, location, and customer experience. Menu architecture, item-level pricing, promotions, portion sizes, delivery charges, ratings, and availability now influence how customers compare restaurants across digital channels. For multi-location restaurant groups, keeping track of these changes manually is difficult because menus can change daily across delivery platforms, restaurant websites, marketplaces, and ordering applications.
Restaurant Menu & Pricing Intelligence for Brands helps businesses convert constantly changing restaurant information into structured intelligence for pricing, positioning, menu optimization, and competitive strategy. By systematically collecting menu names, categories, prices, discounts, descriptions, add-ons, ratings, delivery fees, and availability, brands can understand how competitors position similar offerings across markets.
Restaurant competitor pricing intelligence enables brands to compare item-level prices, promotional strategies, price gaps, and customer-facing offers across competing restaurants and locations.
Competitor menu monitoring platform capabilities can automate recurring observations, helping commercial teams identify when competitors introduce new dishes, modify prices, remove products, or launch limited-time offers.
The result is a continuously refreshed intelligence layer that supports faster decisions and reduces dependence on manually collected market observations.
A restaurant menu is effectively a pricing and merchandising system. Every item communicates a value proposition through its name, description, portion, price, customization options, imagery, and promotional positioning. Competitors continuously adjust these variables according to food costs, demand, seasonality, customer preferences, local competition, and delivery economics.
For restaurant brands operating across several cities, a ₹250 burger in one market may have a completely different competitive position than the same item at ₹250 elsewhere. Therefore, businesses need location-specific intelligence rather than relying exclusively on national averages.
Menu intelligence can reveal:
This information supports pricing teams, category managers, franchise operators, marketing departments, and strategy leaders.
A comprehensive restaurant intelligence program can capture hundreds of attributes. Basic Food Menu and Prices Dataset generally include restaurant name, location, cuisine, menu category, item name, price, description, rating, review count, availability, and image URL.
More advanced datasets can include original price, discounted price, percentage discount, portion size, customization charges, packaging fees, delivery charges, minimum order value, taxes, promotional labels, dietary tags, bestseller indicators, preparation time, platform name, collection timestamp, geographic coordinates, and restaurant operating status.
A structured restaurant pricing data API can make these fields accessible to internal dashboards, analytics systems, pricing engines, and machine-learning workflows.
This creates a foundation for automated monitoring instead of isolated one-time research projects.
| Data Category | Key Fields | Typical Records/Month | Update Frequency | Example Metric | Business Use | Coverage Potential |
|---|---|---|---|---|---|---|
| Restaurant Profile | Name, ID, address, cuisine | 25,000 | Daily | 98.4% completeness | Market mapping | 100% |
| Menu Items | Item, category, description | 450,000 | Daily | 8.7 items/category | Menu analysis | 99.1% |
| Base Pricing | Listed price, currency | 450,000 | Daily | ₹286 median | Price benchmarking | 99.5% |
| Discount Pricing | MRP, offer price | 125,000 | 6-hourly | 18.6% average discount | Promotion tracking | 96.8% |
| Add-ons | Extras, modifiers, charges | 310,000 | Daily | ₹42 average add-on | Upselling analysis | 94.7% |
| Availability | In stock, unavailable | 450,000 | 2-hourly | 91.8% available | Availability monitoring | 97.9% |
| Ratings | Score, reviews | 25,000 | Daily | 4.2 average rating | Reputation analysis | 98.2% |
| Delivery | Fee, ETA, minimum order | 75,000 | Hourly | 34-minute median ETA | Delivery comparison | 95.4% |
| Promotions | Coupons, bundles, BOGO | 80,000 | 6-hourly | 12.4% offer penetration | Campaign intelligence | 93.8% |
| Menu Images | Image URL, image status | 380,000 | Weekly | 84.5% image coverage | Visual benchmarking | 91.7% |
| Location | City, area, coordinates | 25,000 | Weekly | 98.9% geo accuracy | Local benchmarking | 99.0% |
| Historical Data | Previous prices and menus | 2.4M | Continuous | 180-day history | Trend analysis | 99.2% |
Pricing intelligence becomes particularly valuable when brands compare equivalent products instead of simply comparing average menu prices. A restaurant might appear cheaper overall because it has a larger number of low-priced beverages, while its core meals are actually more expensive than competitors.
Effective analysis therefore requires item normalization. Similar products can be grouped by cuisine, category, ingredients, portion size, serving format, and product type. For example, chicken burgers can be compared separately from vegetarian burgers, while a single pizza can be differentiated from family-size offerings.
Businesses can then calculate price gaps, median competitor prices, minimum and maximum prices, discount frequency, promotional intensity, and price-positioning scores.
This is an important part of foodservice competitive intelligence, where structured market data becomes an input for commercial decision-making.
Restaurants increasingly sell through multiple digital channels. The same restaurant may have different prices, bundles, delivery fees, or promotional offers on different platforms.
A strong monitoring framework therefore compares restaurant websites and delivery marketplaces simultaneously. It can identify whether a product costs ₹299 on one platform but ₹319 on another, whether a discount applies only to a particular channel, or whether specific menu items are unavailable in certain locations.
Restaurant menu competitive analysis becomes especially powerful when historical records are retained. Instead of seeing only today's price, analysts can determine how pricing changed over 7, 30, 90, or 180 days.
This enables brands to distinguish temporary promotions from permanent price changes.
Benchmarking converts raw menu observations into measurable competitive indicators. Restaurants can establish benchmarks for average entrée price, beverage price, dessert price, combo value, discount depth, menu size, price dispersion, and category penetration.
For example, a brand may discover that its average burger price is 9.8% above the local competitor median while its premium burger category has 34% fewer options. That information can trigger a menu redesign, selective price reduction, or new premium-product strategy.
Restaurant Menu & pricing benchmarking can also be segmented by city, neighborhood, cuisine, restaurant format, brand tier, and delivery channel.
| Restaurant Brand | Menu Items | Avg. Item Price | Median Price | Discount Rate | Avg. Discount | Avg. Rating | Menu Size | Delivery Fee | New Items/Quarter | Price Gap vs Benchmark |
|---|---|---|---|---|---|---|---|---|---|---|
| McDonald's | 86 | ₹238 | ₹219 | 24.5% | 17.8% | 4.1 | 86 | ₹31 | 14 | -3.2% |
| KFC | 74 | ₹251 | ₹229 | 19.7% | 14.6% | 4.2 | 74 | ₹29 | 11 | +2.1% |
| Domino's Pizza | 112 | ₹347 | ₹319 | 29.4% | 21.5% | 4.1 | 112 | ₹28 | 15 | -2.6% |
| Pizza Hut | 104 | ₹369 | ₹339 | 25.8% | 18.9% | 4.2 | 104 | ₹30 | 12 | +3.5% |
| Burger King | 81 | ₹267 | ₹249 | 23.6% | 17.2% | 4.0 | 81 | ₹32 | 13 | +1.8% |
| Subway | 69 | ₹284 | ₹269 | 18.9% | 13.7% | 4.2 | 69 | ₹27 | 9 | +4.6% |
| Starbucks | 93 | ₹214 | ₹199 | 26.3% | 18.7% | 4.2 | 93 | ₹24 | 16 | -5.4% |
| Café Coffee Day | 101 | ₹229 | ₹209 | 22.7% | 16.8% | 4.3 | 101 | ₹26 | 19 | +1.2% |
| Haldiram's | 132 | ₹486 | ₹449 | 11.4% | 12.2% | 4.3 | 132 | ₹42 | 9 | +8.7% |
| Barbeque Nation | 119 | ₹452 | ₹425 | 14.8% | 15.9% | 4.2 | 119 | ₹39 | 13 | +1.1% |
| Wow! Momo | 64 | ₹276 | ₹249 | 31.6% | 22.4% | 4.0 | 64 | ₹27 | 18 | +0.4% |
| Biryani By Kilo | 71 | ₹291 | ₹259 | 28.9% | 20.1% | 4.1 | 71 | ₹25 | 21 | +5.8% |
| Rebel Foods | 168 | ₹824 | ₹749 | 7.6% | 9.8% | 4.5 | 168 | ₹49 | 7 | +16.9% |
| EatFit | 151 | ₹768 | ₹699 | 8.9% | 11.4% | 4.4 | 151 | ₹46 | 10 | +9.3% |
The figures are illustrative benchmark values designed to demonstrate how restaurant brands can structure and compare competitive menu-pricing intelligence.
At scale, restaurant intelligence typically combines automated data collection, extraction, normalization, validation, storage, and analytics. Restaurant pages and digital marketplaces can be monitored at scheduled intervals, while extracted information is standardized into consistent fields.
Restaurant Menu Data Scraping can capture menu-level information from multiple digital sources, after which normalization processes can map variations such as "Chicken Cheese Burger," "Cheese Chicken Burger," and similar descriptions into comparable product groups.
Historical snapshots are particularly valuable because they create a time series of menu and pricing movements. Data can then be stored in CSV, JSON, Excel, PostgreSQL, cloud databases, data warehouses, or analytics environments.
Restaurant brands can use menu intelligence across several commercial functions.
Despite its value, restaurant menu data is difficult to maintain because digital information changes continuously. Prices may vary by location, customer segment, device, platform, delivery zone, time of day, or promotional campaign.
Menus can also contain inconsistent names, missing descriptions, duplicate products, changing categories, and temporary availability states. Images may change independently of text, while add-on pricing can significantly alter final order value.
Data quality therefore requires validation rules, timestamping, duplicate detection, product matching, location verification, and historical version control. Compliance with applicable laws, platform terms, and responsible data-collection practices should also be incorporated into every deployment.
The strongest restaurant intelligence programs move beyond simply collecting menu information. They connect menu data with competitive benchmarks and business outcomes.
A pricing team can identify underpriced products. A marketing team can discover promotional gaps. A category manager can identify emerging menu trends. A franchise team can detect regional inconsistencies. Executives can monitor competitive movement through dashboards rather than relying on periodic manual reports.
The real advantage comes from transforming fragmented menu observations into a continuously updated market intelligence system.
Restaurant brands operate in an environment where small pricing differences can influence customer choice, conversion, and perceived value. Continuous monitoring gives businesses the ability to see these changes before they become significant competitive disadvantages.
Menu Pricing Dataset structures item-level prices, discounts, categories, and historical changes for deeper analysis.
Restaurant Data Scraping enables businesses to systematically collect restaurant information across relevant digital channels and markets.
Restaurant Menu Data Scraping adds the detailed product-level layer required for menu comparison, price benchmarking, promotion tracking, and competitive monitoring.
Together, these capabilities allow restaurant brands to build richer pricing strategies, identify menu gaps, evaluate competitors, optimize regional positioning, and respond faster to changing market conditions. In an increasingly digital foodservice economy, menu intelligence is no longer simply a research activity—it is becoming a core input for pricing, merchandising, growth, and competitive strategy.
If you are seeking for a reliable data scraping services, Food Data Scrape is at your service. We hold prominence in Food Data Aggregator and Mobile Restaurant App Scraping with impeccable data analysis for strategic decision-making.



