

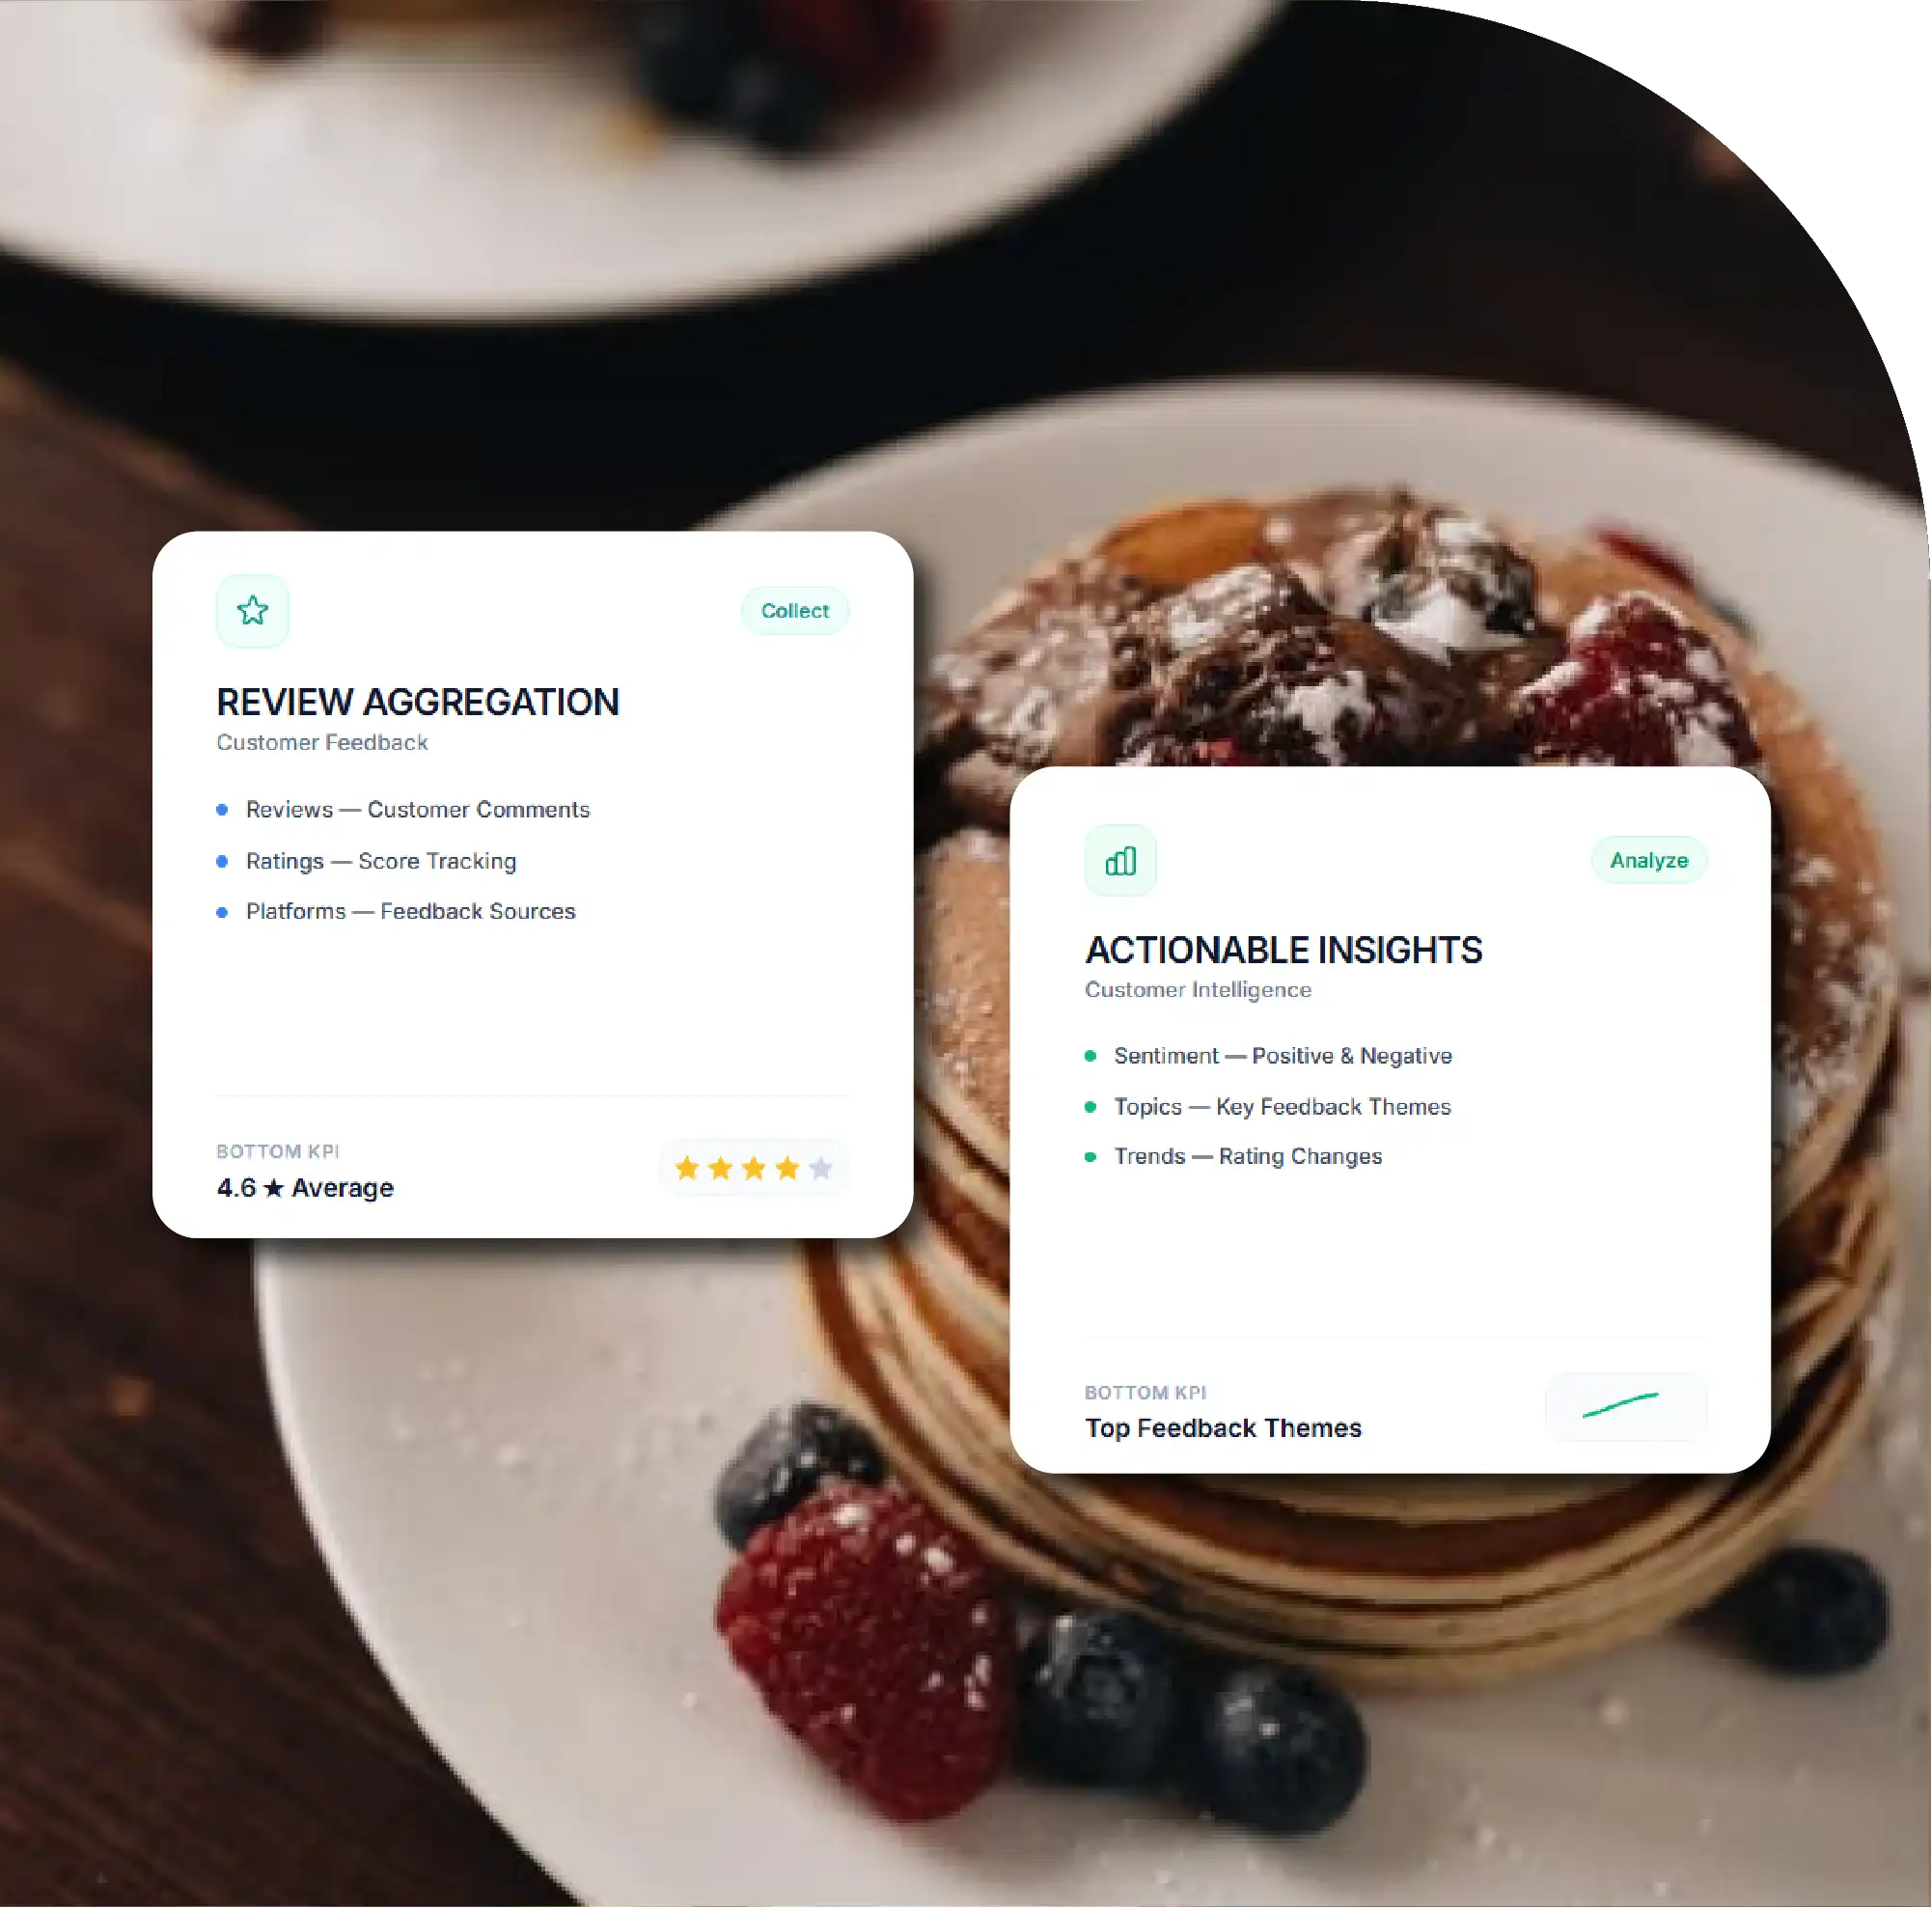
Comprehensive Review Intelligence: Aggregate ratings, review text, sentiment, timestamps, locations, and customer feedback into one structured dataset.
Cross-Platform Rating Analysis: Normalize ratings and review metrics across multiple platforms to enable accurate restaurant and competitor comparisons.
AI-Powered Sentiment Insights: Identify customer opinions about food, service, pricing, ambience, delivery, cleanliness, and other experience factors.
Location-Level Performance Tracking: Compare restaurant branches, detect declining outlets, identify complaint hotspots, and monitor reputation changes over time.
Strategic Business Intelligence: Combine review data with menus, pricing, and delivery information to support reputation management, benchmarking, and operational decisions.

The restaurant industry has become increasingly dependent on digital reputation. Before choosing where to eat, customers routinely examine star ratings, written reviews, recent customer experiences, photographs, complaints, responses from restaurant owners, and overall review volume. For restaurant chains, food delivery businesses, hospitality investors, aggregators, and market research companies, this enormous volume of customer feedback represents a valuable source of competitive intelligence.
Restaurant Review & Rating Aggregation provides a structured approach for collecting, standardizing, analyzing, and comparing restaurant reviews and ratings from multiple digital sources. Instead of evaluating restaurants individually across different platforms, businesses can create a centralized intelligence layer containing ratings, review counts, review text, sentiment, customer themes, locations, timestamps, and source information.
The need for restaurant review aggregation has increased as restaurant discovery becomes more fragmented across maps, review platforms, food delivery applications, booking websites, and restaurant directories. Meanwhile, restaurant rating aggregation allows businesses to compare customer satisfaction across brands, branches, cities, cuisines, and time periods.
A well-designed aggregation system can capture restaurant names, addresses, cuisines, ratings, review counts, review dates, review text, owner responses, sentiment scores, frequently mentioned dishes, service complaints, price perceptions, and other customer-experience signals. These datasets can support competitive benchmarking, reputation management, restaurant expansion decisions, menu optimization, and customer experience improvement.
A restaurant's average rating provides only a high-level view of customer perception. The underlying review content often contains much more valuable information.
For example, two restaurants can both have a 4.3-star rating while having completely different customer experiences. Customers may praise one restaurant for food quality but complain about delivery delays. Another may receive strong service reviews but frequent complaints about portion sizes and pricing.
Review volume is also important. A 4.7 rating based on 300 reviews carries a different statistical signal from a 4.5 rating based on 15,000 reviews. Review velocity provides another dimension. If a restaurant suddenly receives hundreds of new reviews within a short period, businesses can investigate whether the increase reflects rising popularity, a promotional campaign, a new location, or a change in customer experience.
Historical review data is particularly useful because reputation is dynamic. A restaurant that had a 4.6 rating twelve months ago but has gradually declined to 4.1 may require immediate operational attention even if its current rating still appears acceptable.
A scalable review aggregation system starts with data collection from permitted and appropriate sources. The pipeline can then normalize restaurant identities, locations, ratings, review timestamps, languages, and review structures.
The objective of restaurant review and rating scraping is not simply to collect large quantities of review text. The more important objective is to transform fragmented information into standardized records that can be compared over time.
Typical fields can include restaurant ID, restaurant name, branch name, address, city, country, latitude, longitude, cuisine, platform name, review ID, rating, rating scale, review title, review text, review date, response date, owner response, language, sentiment, topic, collection timestamp, and source URL where appropriate.
Entity matching is especially important. A single restaurant can have different names, abbreviations, spellings, or address formats across multiple platforms. Matching algorithms can use restaurant names, geographic coordinates, addresses, phone numbers, websites, and other non-sensitive business identifiers to determine whether records belong to the same establishment.
A comprehensive dataset can be organized into several major categories.
The restaurant reputation monitoring measures changes in customer perception over time. Instead of only reporting today's rating, a monitoring system can calculate weekly and monthly rating movements, review growth, negative-review percentages, sentiment changes, and recurring complaint categories.
For restaurant chains, this becomes particularly valuable at the outlet level. Corporate teams can identify branches whose customer experience is substantially weaker than the brand average.
The following table illustrates how a structured restaurant intelligence dataset can compare major restaurant brands. The figures are illustrative benchmark values created to demonstrate the type of analysis an aggregation system can support, not current platform measurements.
| Restaurant Brand | Estimated Review Records | Average Rating | Normalized Score /100 | Reviews in 30 Days | Positive Reviews | Negative Reviews | Food Sentiment | Service Sentiment | Value Sentiment | Owner Response Rate | Review Growth |
|---|---|---|---|---|---|---|---|---|---|---|---|
| McDonald's | 18,500 | 4.2/5 | 84 | 1,120 | 78.4% | 13.8% | 86 | 77 | 75 | 54% | 5.8% |
| Starbucks | 15,800 | 4.3/5 | 86 | 940 | 81.7% | 11.4% | 88 | 82 | 73 | 61% | 4.9% |
| KFC | 13,600 | 4.1/5 | 82 | 870 | 76.1% | 15.7% | 84 | 74 | 78 | 49% | 5.2% |
| Domino's | 16,900 | 4.2/5 | 84 | 1,050 | 79.8% | 13.2% | 85 | 78 | 81 | 57% | 6.4% |
| Pizza Hut | 12,700 | 4.0/5 | 80 | 720 | 73.9% | 17.2% | 82 | 72 | 77 | 46% | 3.8% |
| Burger King | 11,900 | 4.1/5 | 82 | 680 | 75.8% | 15.1% | 83 | 75 | 76 | 48% | 4.5% |
| Subway | 10,850 | 4.0/5 | 80 | 610 | 72.6% | 17.8% | 81 | 73 | 74 | 43% | 3.9% |
| Taco Bell | 9,640 | 4.2/5 | 84 | 590 | 79.3% | 12.9% | 87 | 76 | 79 | 51% | 5.7% |
| Chipotle | 8,920 | 4.4/5 | 88 | 510 | 84.9% | 9.1% | 91 | 83 | 76 | 64% | 6.2% |
| Dunkin' | 11,480 | 4.2/5 | 84 | 730 | 80.2% | 12.6% | 87 | 79 | 75 | 58% | 4.7% |
This type of table demonstrates why a simple rating comparison is insufficient. A business can compare food sentiment, service sentiment, value perception, review growth, and response rates simultaneously.
Raw reviews become substantially more valuable when natural language processing and machine learning are applied to them.
A sentiment engine can classify reviews as positive, negative, or neutral. More sophisticated systems can perform aspect-based sentiment analysis, identifying sentiment toward individual restaurant attributes.
Consider a review stating that the food was excellent but the service was slow. A basic system may classify the entire review as positive because the customer praised the food. An aspect-based restaurant review analytics system would recognize two separate signals: positive food sentiment and negative service sentiment.
Common analytical categories include:
Businesses can calculate sentiment scores for each category and compare them between restaurants.
One of the biggest challenges in review aggregation is that different platforms can structure ratings differently. Some use five-star ratings, while others may use ten-point systems, percentages, recommendation scores, or category-level ratings.
A unified system can normalize these values into a common scoring framework while retaining the original rating and platform information.
The next table demonstrates how competitive intelligence can combine multiple dimensions into one benchmark.
| Restaurant Brand | Total Reviews | Rating | Rating Score /100 | Monthly Review Velocity | Positive Sentiment | Negative Sentiment | Food Score | Service Score | Ambience Score | Value Score | Complaint Rate |
|---|---|---|---|---|---|---|---|---|---|---|---|
| McDonald's | 18,500 | 4.2 | 84 | 1,120 | 78.4% | 13.8% | 86 | 77 | 79 | 75 | 9.6% |
| Starbucks | 15,800 | 4.3 | 86 | 940 | 81.7% | 11.4% | 88 | 82 | 86 | 73 | 7.8% |
| KFC | 13,600 | 4.1 | 82 | 870 | 76.1% | 15.7% | 84 | 74 | 76 | 78 | 10.9% |
| Domino's | 16,900 | 4.2 | 84 | 1,050 | 79.8% | 13.2% | 85 | 78 | 74 | 81 | 9.1% |
| Pizza Hut | 12,700 | 4.0 | 80 | 720 | 73.9% | 17.2% | 82 | 72 | 75 | 77 | 12.4% |
| Burger King | 11,900 | 4.1 | 82 | 680 | 75.8% | 15.1% | 83 | 75 | 77 | 76 | 10.8% |
| Subway | 10,850 | 4.0 | 80 | 610 | 72.6% | 17.8% | 81 | 73 | 74 | 74 | 12.9% |
| Taco Bell | 9,640 | 4.2 | 84 | 590 | 79.3% | 12.9% | 87 | 76 | 78 | 79 | 8.7% |
| Chipotle | 8,920 | 4.4 | 88 | 510 | 84.9% | 9.1% | 91 | 83 | 85 | 76 | 6.2% |
| Dunkin' | 11,480 | 4.2 | 84 | 730 | 80.2% | 12.6% | 87 | 79 | 81 | 75 | 8.4% |
The numbers demonstrate how an intelligence platform can identify strengths and weaknesses beyond overall ratings. For example, a restaurant may have excellent food sentiment but weak service sentiment, creating a clear operational priority.
Restaurant groups can also compare individual branches within the same city. This allows managers to identify location-level performance differences.
A restaurant chain operating 500 locations might have an overall rating of 4.2, but individual branches could range from 3.6 to 4.7. Aggregated review intelligence makes these differences visible.
Location-level analysis can identify:
This information can support staff training, quality-control programs, operational audits, and branch-level improvement strategies.
Review volume is not simply a reputation metric. It can also act as a proxy for customer activity.
A restaurant receiving 20 new reviews per month has a different market signal from one receiving 500. Rapidly increasing review volume can indicate increased customer traffic, a new location opening, a promotional campaign, or growing market awareness.
When combined with historical ratings, review velocity can produce a more comprehensive restaurant momentum score.
For example:
Momentum Score = Rating Strength + Review Growth + Positive Sentiment + Engagement + Recency
Such scoring systems can help investors, restaurant operators, and market researchers identify rapidly improving or declining establishments.
Restaurant review intelligence has applications across multiple business functions.
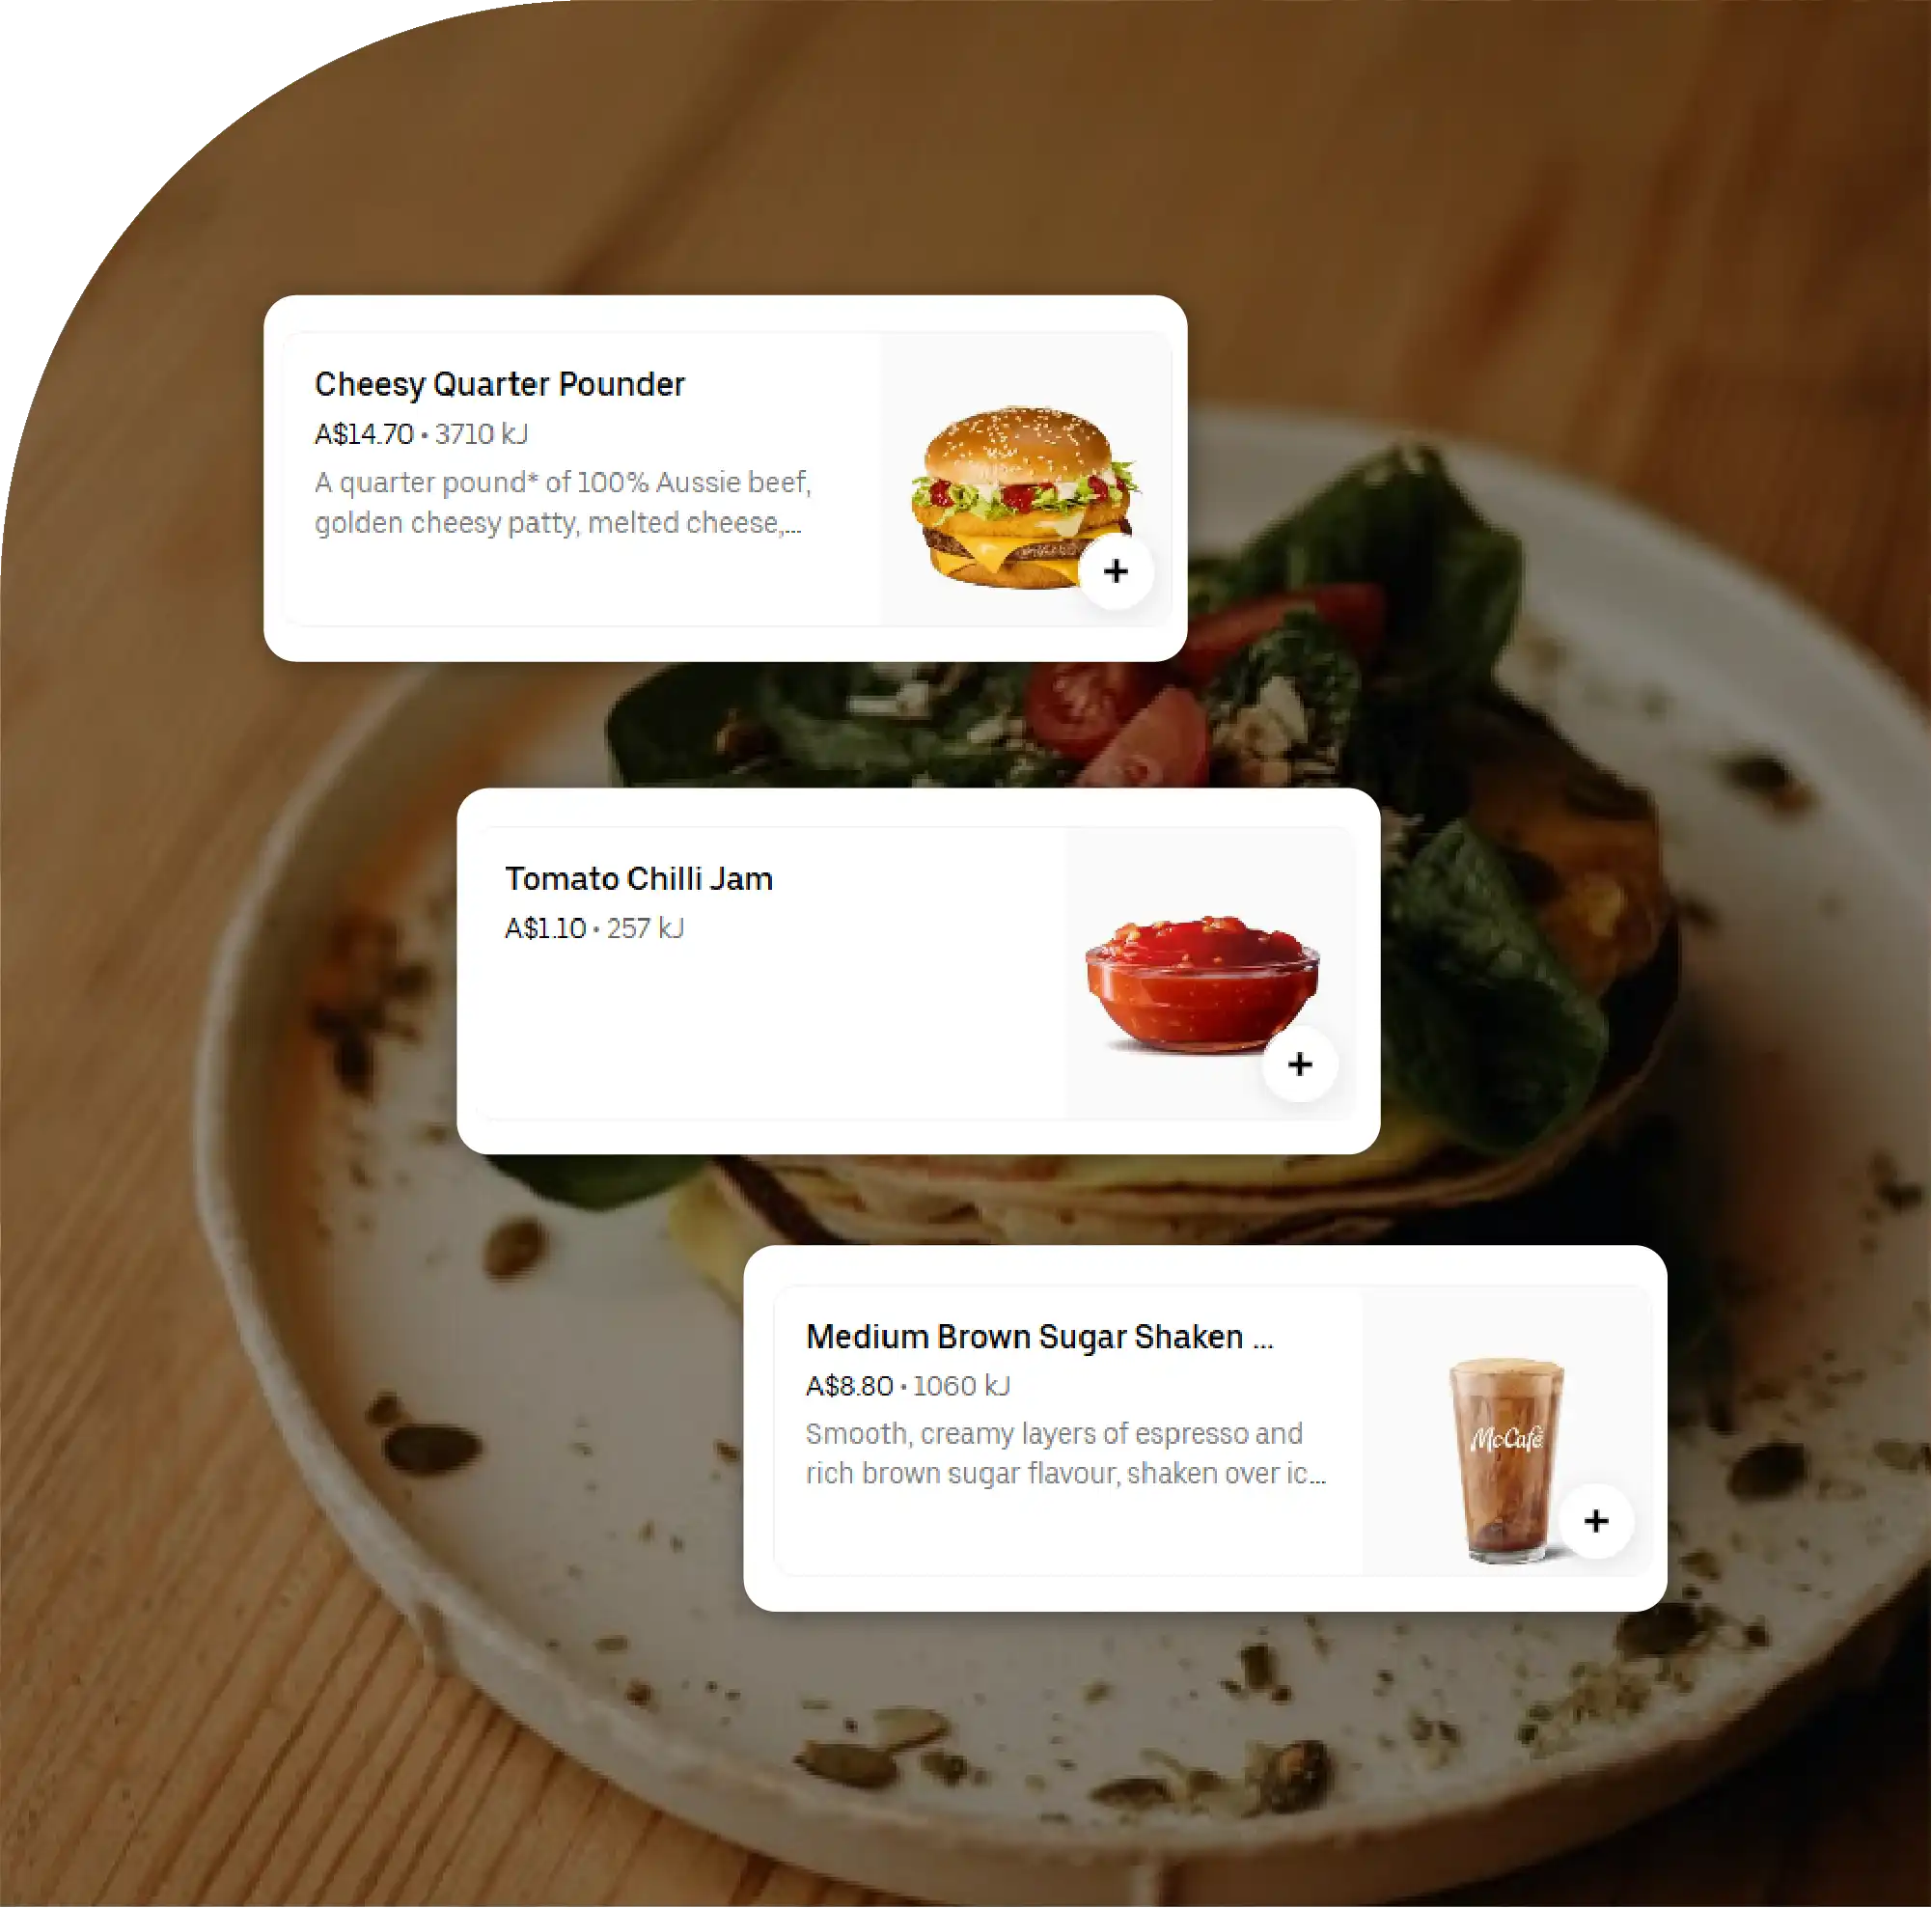
Review data becomes even more powerful when combined with menu and pricing information.
A restaurant may receive increasing complaints about value after raising prices. Another may introduce a new menu item and suddenly receive higher positive sentiment. A third may receive strong food-quality reviews despite charging a premium.
Connecting reviews with menu datasets allows analysts to examine relationships between price, product availability, promotions, customer sentiment, and perceived value.
For example, analysts can track:
| Intelligence Dimension | Example Measurement | Business Question |
|---|---|---|
| Rating Trend | +0.18 points | Is reputation improving? |
| Review Growth | +14.6% | Is customer engagement increasing? |
| Food Sentiment | 88/100 | Are customers satisfied with food quality? |
| Service Sentiment | 74/100 | Is staff performance creating complaints? |
| Value Sentiment | 69/100 | Do customers consider pricing reasonable? |
| Delivery Complaints | 11.2% | Are delivery operations creating dissatisfaction? |
| Menu Mentions | 4,850 | Which products attract the most discussion? |
| Negative Topic Frequency | 7.8% | Which issues require intervention? |
| Owner Response Rate | 63% | How actively does the brand engage customers? |
| Review Recency | 72% within 90 days | How current is the reputation signal? |
These relationships can support pricing strategy, menu engineering, promotion planning, and customer-experience optimization.
Building a reliable restaurant review aggregation platform involves several technical challenges.
Finally, data collection should be designed around applicable laws, privacy requirements, intellectual-property considerations, and platform terms. Businesses should collect only information they are permitted to use and avoid retaining unnecessary personal information.
The future of restaurant review analysis is moving from descriptive reporting toward predictive intelligence.
Artificial intelligence can summarize thousands of reviews into concise management insights, identify emerging complaint themes, compare competitors automatically, detect sudden sentiment changes, and classify reviews according to food, service, pricing, ambience, and other attributes.
A future restaurant reputation dashboard could alert managers when negative sentiment increases by a defined threshold, when complaints about a particular menu item suddenly accelerate, or when a branch's service score falls below its regional benchmark.
Generative AI can further convert these signals into business recommendations. Instead of simply reporting that complaints about waiting time increased, an intelligent platform could identify the affected locations, quantify the increase, summarize representative themes, and prioritize operational investigation. Companies can Extract Restaurant Review Data to calculate metrics such as food sentiment, service sentiment, value perception, complaint frequency, review velocity, response rates, and branch-level reputation scores.
The combination of Reviews & AI Sentiment creates an even more powerful analytical framework. AI can transform thousands of unstructured customer comments into structured insights that reveal emerging complaints, customer preferences, menu-level sentiment, service weaknesses, competitive advantages, and changing consumer expectations.
Restaurant reviews have evolved from simple customer comments into a substantial source of business intelligence. When ratings, review text, review volume, sentiment, restaurant identity, location, timestamps, and customer themes are collected into a unified framework, organizations can understand restaurant reputation at a much deeper level.
Businesses can Scrape Restaurant Reviews And Rating Data to create structured competitive datasets covering ratings, review volume, sentiment, customer themes, and historical reputation changes.
Organizations can Scrape Restaurant Reviews Data and combine it with restaurant menus, pricing, delivery information, locations, and competitor attributes to create comprehensive foodservice intelligence.
Advanced Scraping Restaurant Reviews Data workflows should focus on entity resolution, duplicate management, historical snapshots, rating normalization, multilingual processing, sentiment classification, and scalable data storage.
Ultimately, restaurant review and rating aggregation gives businesses the ability to move beyond simply asking, "What is the rating?" and instead answer more valuable questions: Why are customers satisfied, what is driving dissatisfaction, which branches are improving, what are competitors doing better, and what operational changes can improve the customer experience?
If you are seeking for a reliable data scraping services, Food Data Scrape is at your service. We hold prominence in Food Data Aggregator and Mobile Restaurant App Scraping with impeccable data analysis for strategic decision-making.



