Boo-st your food data. Save 20% on scraping services
Menus · Grocery · Alcohol · AI Intelligence, across 40+ countries

Pricing Intelligence: Tracks changing grocery prices across major German retail competitors.
Product Benchmarking: Compares products, pack sizes, brands, and unit prices.
Promotion Tracking: Measures discounts, promotional frequency, duration, and competitive intensity.
Regional Analysis: Identifies pricing and availability differences across geographic markets.
Market Intelligence: Transforms grocery data into actionable competitive retail insights.

Germany's grocery retail market is characterized by intense competition between traditional supermarkets, discount retailers, private-label brands, and rapidly expanding online grocery services. Consumers increasingly compare prices, promotions, pack sizes, and product availability before making purchasing decisions. For retailers, brands, and market intelligence teams, continuously collecting this information provides a detailed view of how grocery prices evolve across competing channels.
REWE, Edeka & Lidl Price Data Scraping provides a structured approach for collecting product-level information from three of Germany's most significant grocery retailers. Depending on the research objective, the collected data can include product names, brands, categories, pack sizes, regular prices, promotional prices, unit prices, availability, ratings, product URLs, and timestamps.
A historical REWE grocery pricing dataset can be used to study price movements, promotional frequency, product assortment, and regional variations. When collected consistently, historical observations allow researchers to identify recurring pricing patterns rather than relying on isolated price snapshots.
Similarly, Lidl supermarket price monitoring can provide insight into discount-retail pricing strategies, promotional campaigns, private-label positioning, and differences between standard and promotional pricing.
The objective of this research is to examine how structured grocery data from REWE, Edeka, and Lidl can be collected, normalized, compared, and converted into actionable competitive intelligence.
REWE, Edeka, and Lidl operate under different retail models, making cross-retailer comparison particularly valuable. REWE has a broad supermarket assortment and online grocery presence, Edeka operates through a large network of retailers with potentially significant assortment differences, while Lidl follows a discount-oriented model with strong emphasis on competitive prices and promotional products.
These structural differences mean that comparing headline prices alone can produce misleading conclusions. Product size, brand, packaging, promotional status, and availability must all be considered when constructing a reliable grocery pricing dataset.
For example, comparing a 500-gram product at one retailer with a 750-gram package at another retailer does not provide a meaningful price comparison unless the prices are converted into a common unit. Price per kilogram, liter, or individual item can therefore become more useful than displayed shelf prices.
A comprehensive Edeka grocery product data scrape can capture the underlying product attributes required for this normalization. Product identifiers, category structures, brand information, package quantities, pricing information, and availability can be combined into a standardized data model.
A grocery price research project generally begins by defining the categories, products, retailers, locations, and collection frequency. Depending on the research scope, categories can include dairy, bakery, meat, seafood, beverages, frozen foods, snacks, packaged groceries, fresh produce, household products, and personal care.
The data collection layer captures publicly accessible product information from online retail interfaces. Dynamic pages may require browser-based collection techniques, while larger projects benefit from scheduled crawlers and automated data pipelines.
After collection, raw information needs to be cleaned and standardized. Product names can contain different formatting conventions, package quantities can appear in different units, and promotional information may be displayed differently across retailers.
A normalization process can convert quantities into standardized units and calculate comparable unit prices. Duplicate products can also be identified using combinations of product names, brands, sizes, identifiers, and other attributes.
Each observation should contain a timestamp. This is particularly important because grocery prices can change frequently. Historical timestamps make it possible to measure price changes, promotional durations, price volatility, and retailer-level trends.
The central value of multi-retailer grocery scraping lies in creating comparable observations across retailers. Instead of examining one retailer independently, analysts can compare the same products or equivalent products across REWE, Edeka, and Lidl.
Competitive Grocery Pricing Analytics Across REWE, Edeka and Lidl can identify which retailer consistently offers lower prices for selected categories, where promotional differences are strongest, and how pricing changes over time.
A standardized grocery basket can also be constructed to compare overall retailer positioning. Rather than comparing individual products, the basket can contain common categories such as milk, butter, bread, eggs, cheese, coffee, beverages, snacks, frozen foods, and household products.
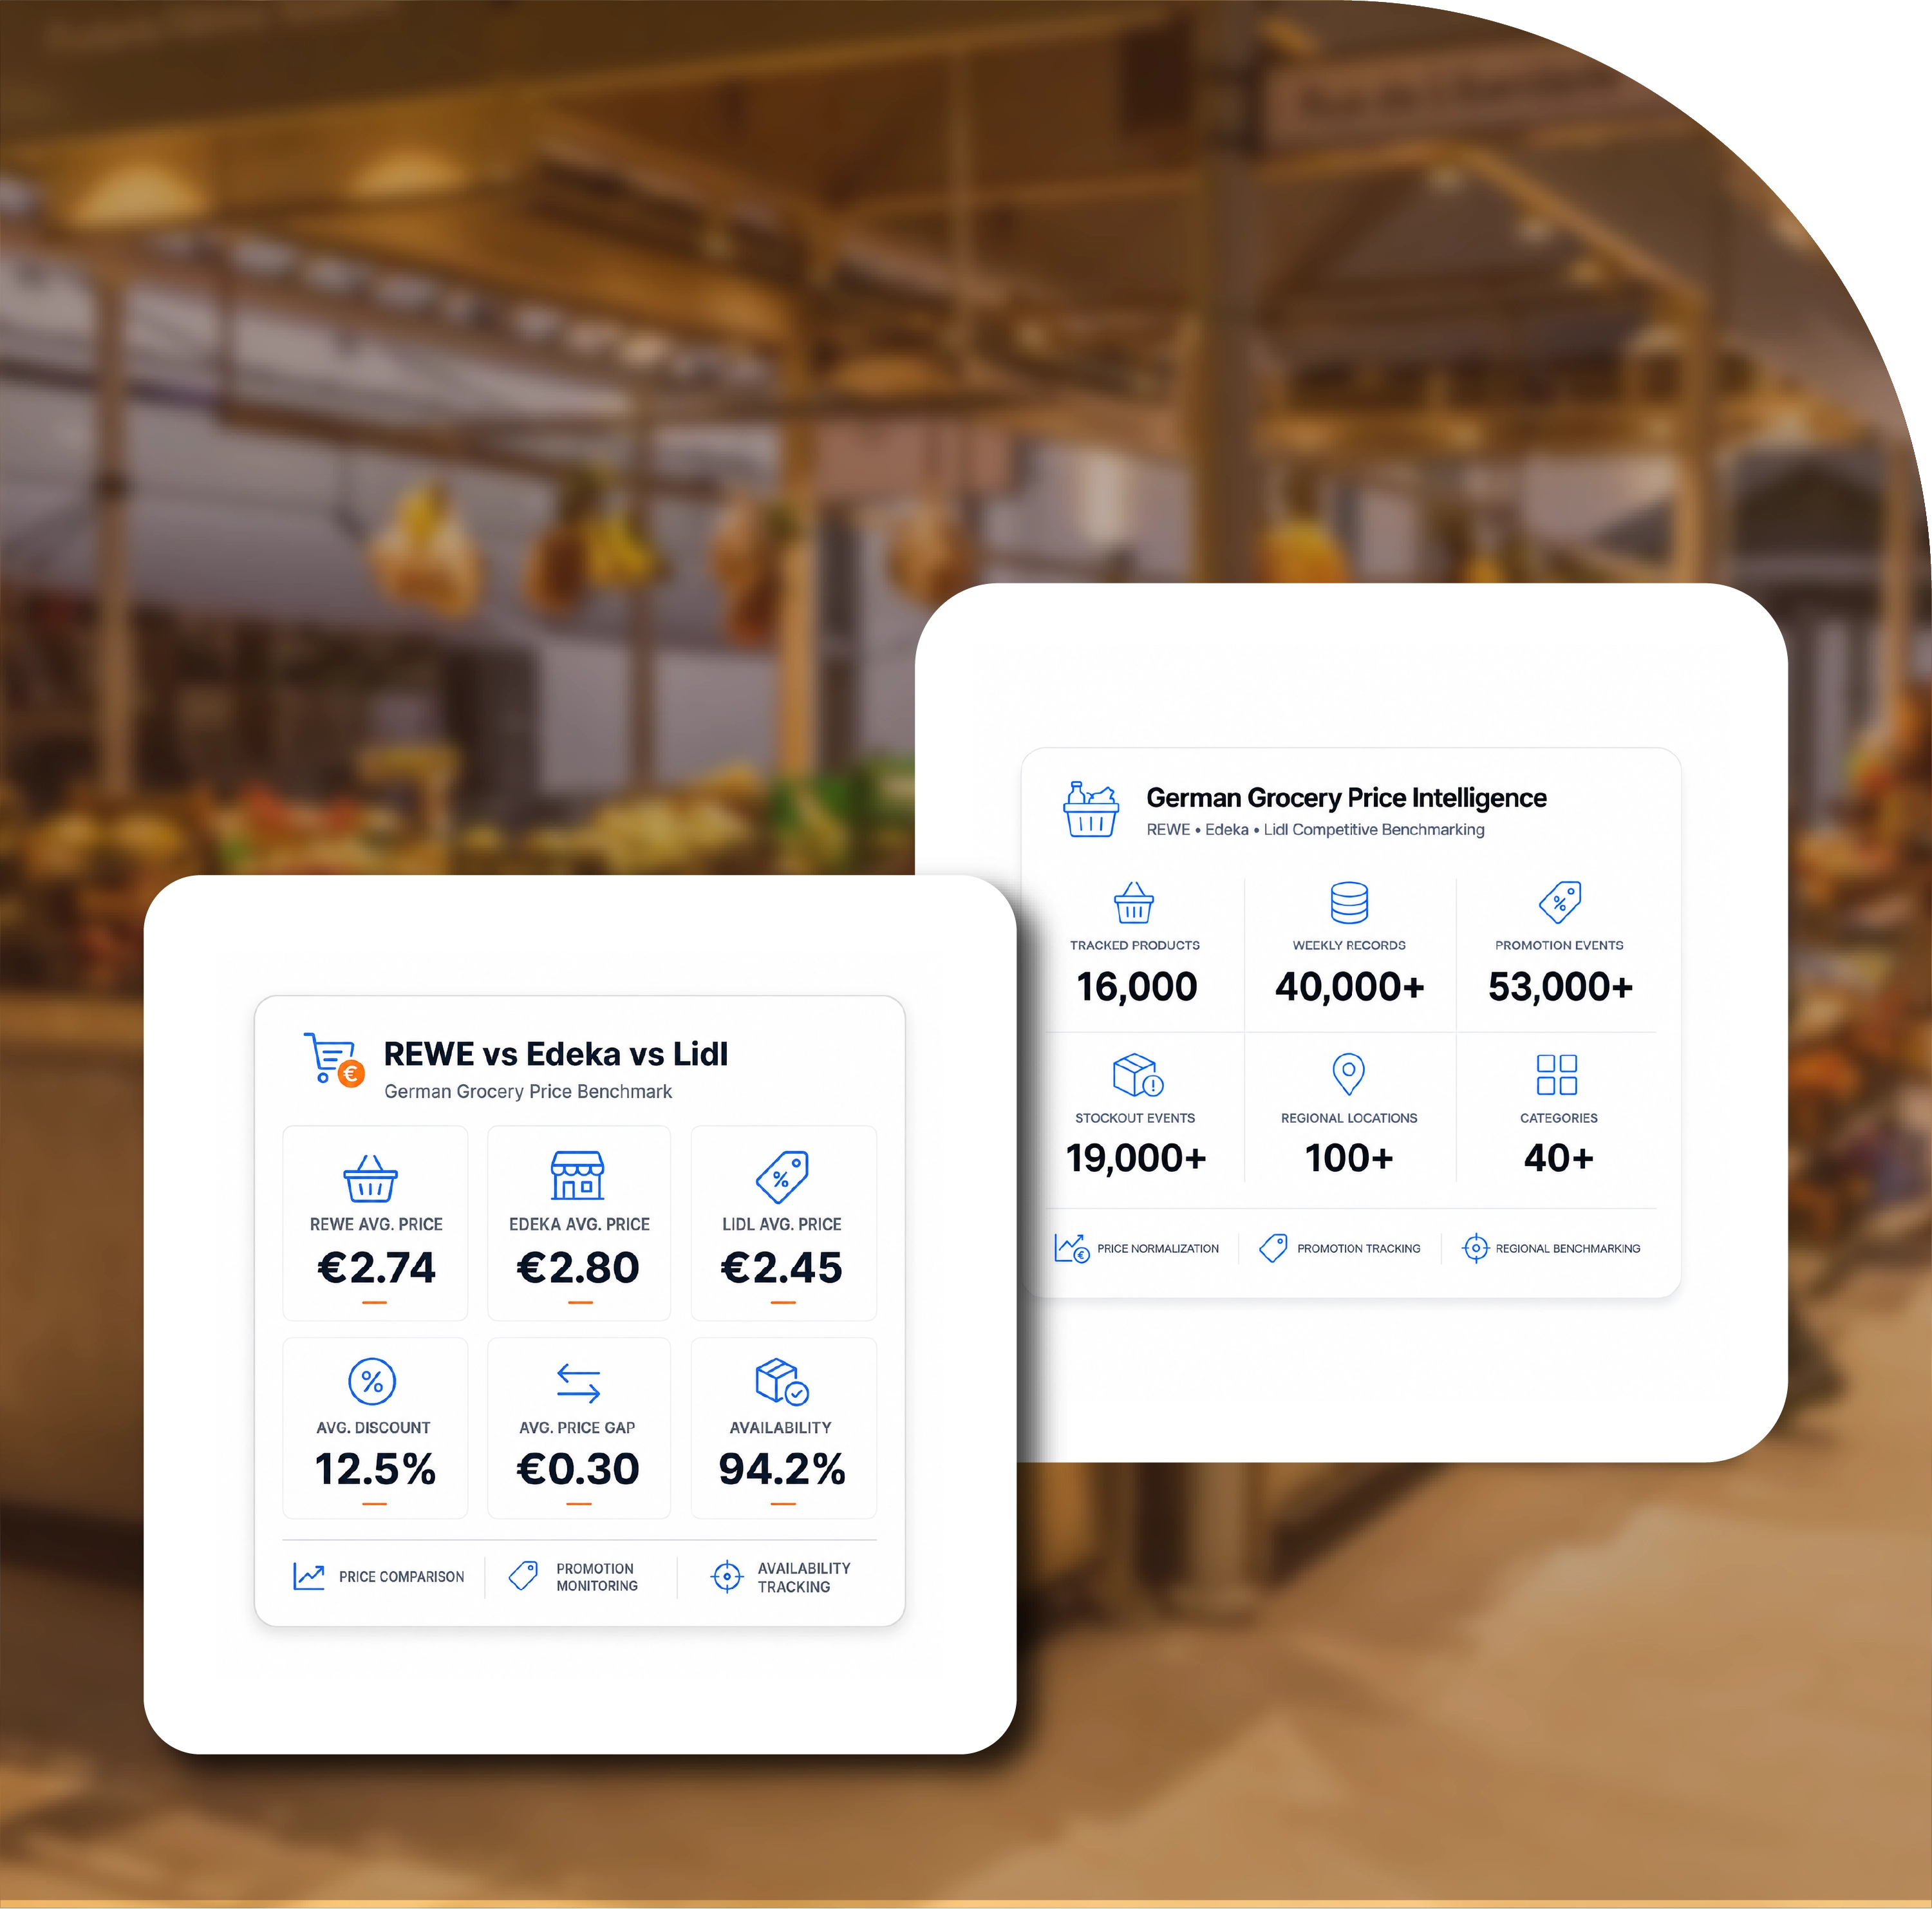
| Category | Products Tracked | REWE Avg. Price (€) | Edeka Avg. Price (€) | Lidl Avg. Price (€) | Lowest Avg. Price (€) | Highest Avg. Price (€) | Avg. Discount (%) | Price Gap (€) | Availability (%) | Monthly Observations | Price Changes |
|---|---|---|---|---|---|---|---|---|---|---|---|
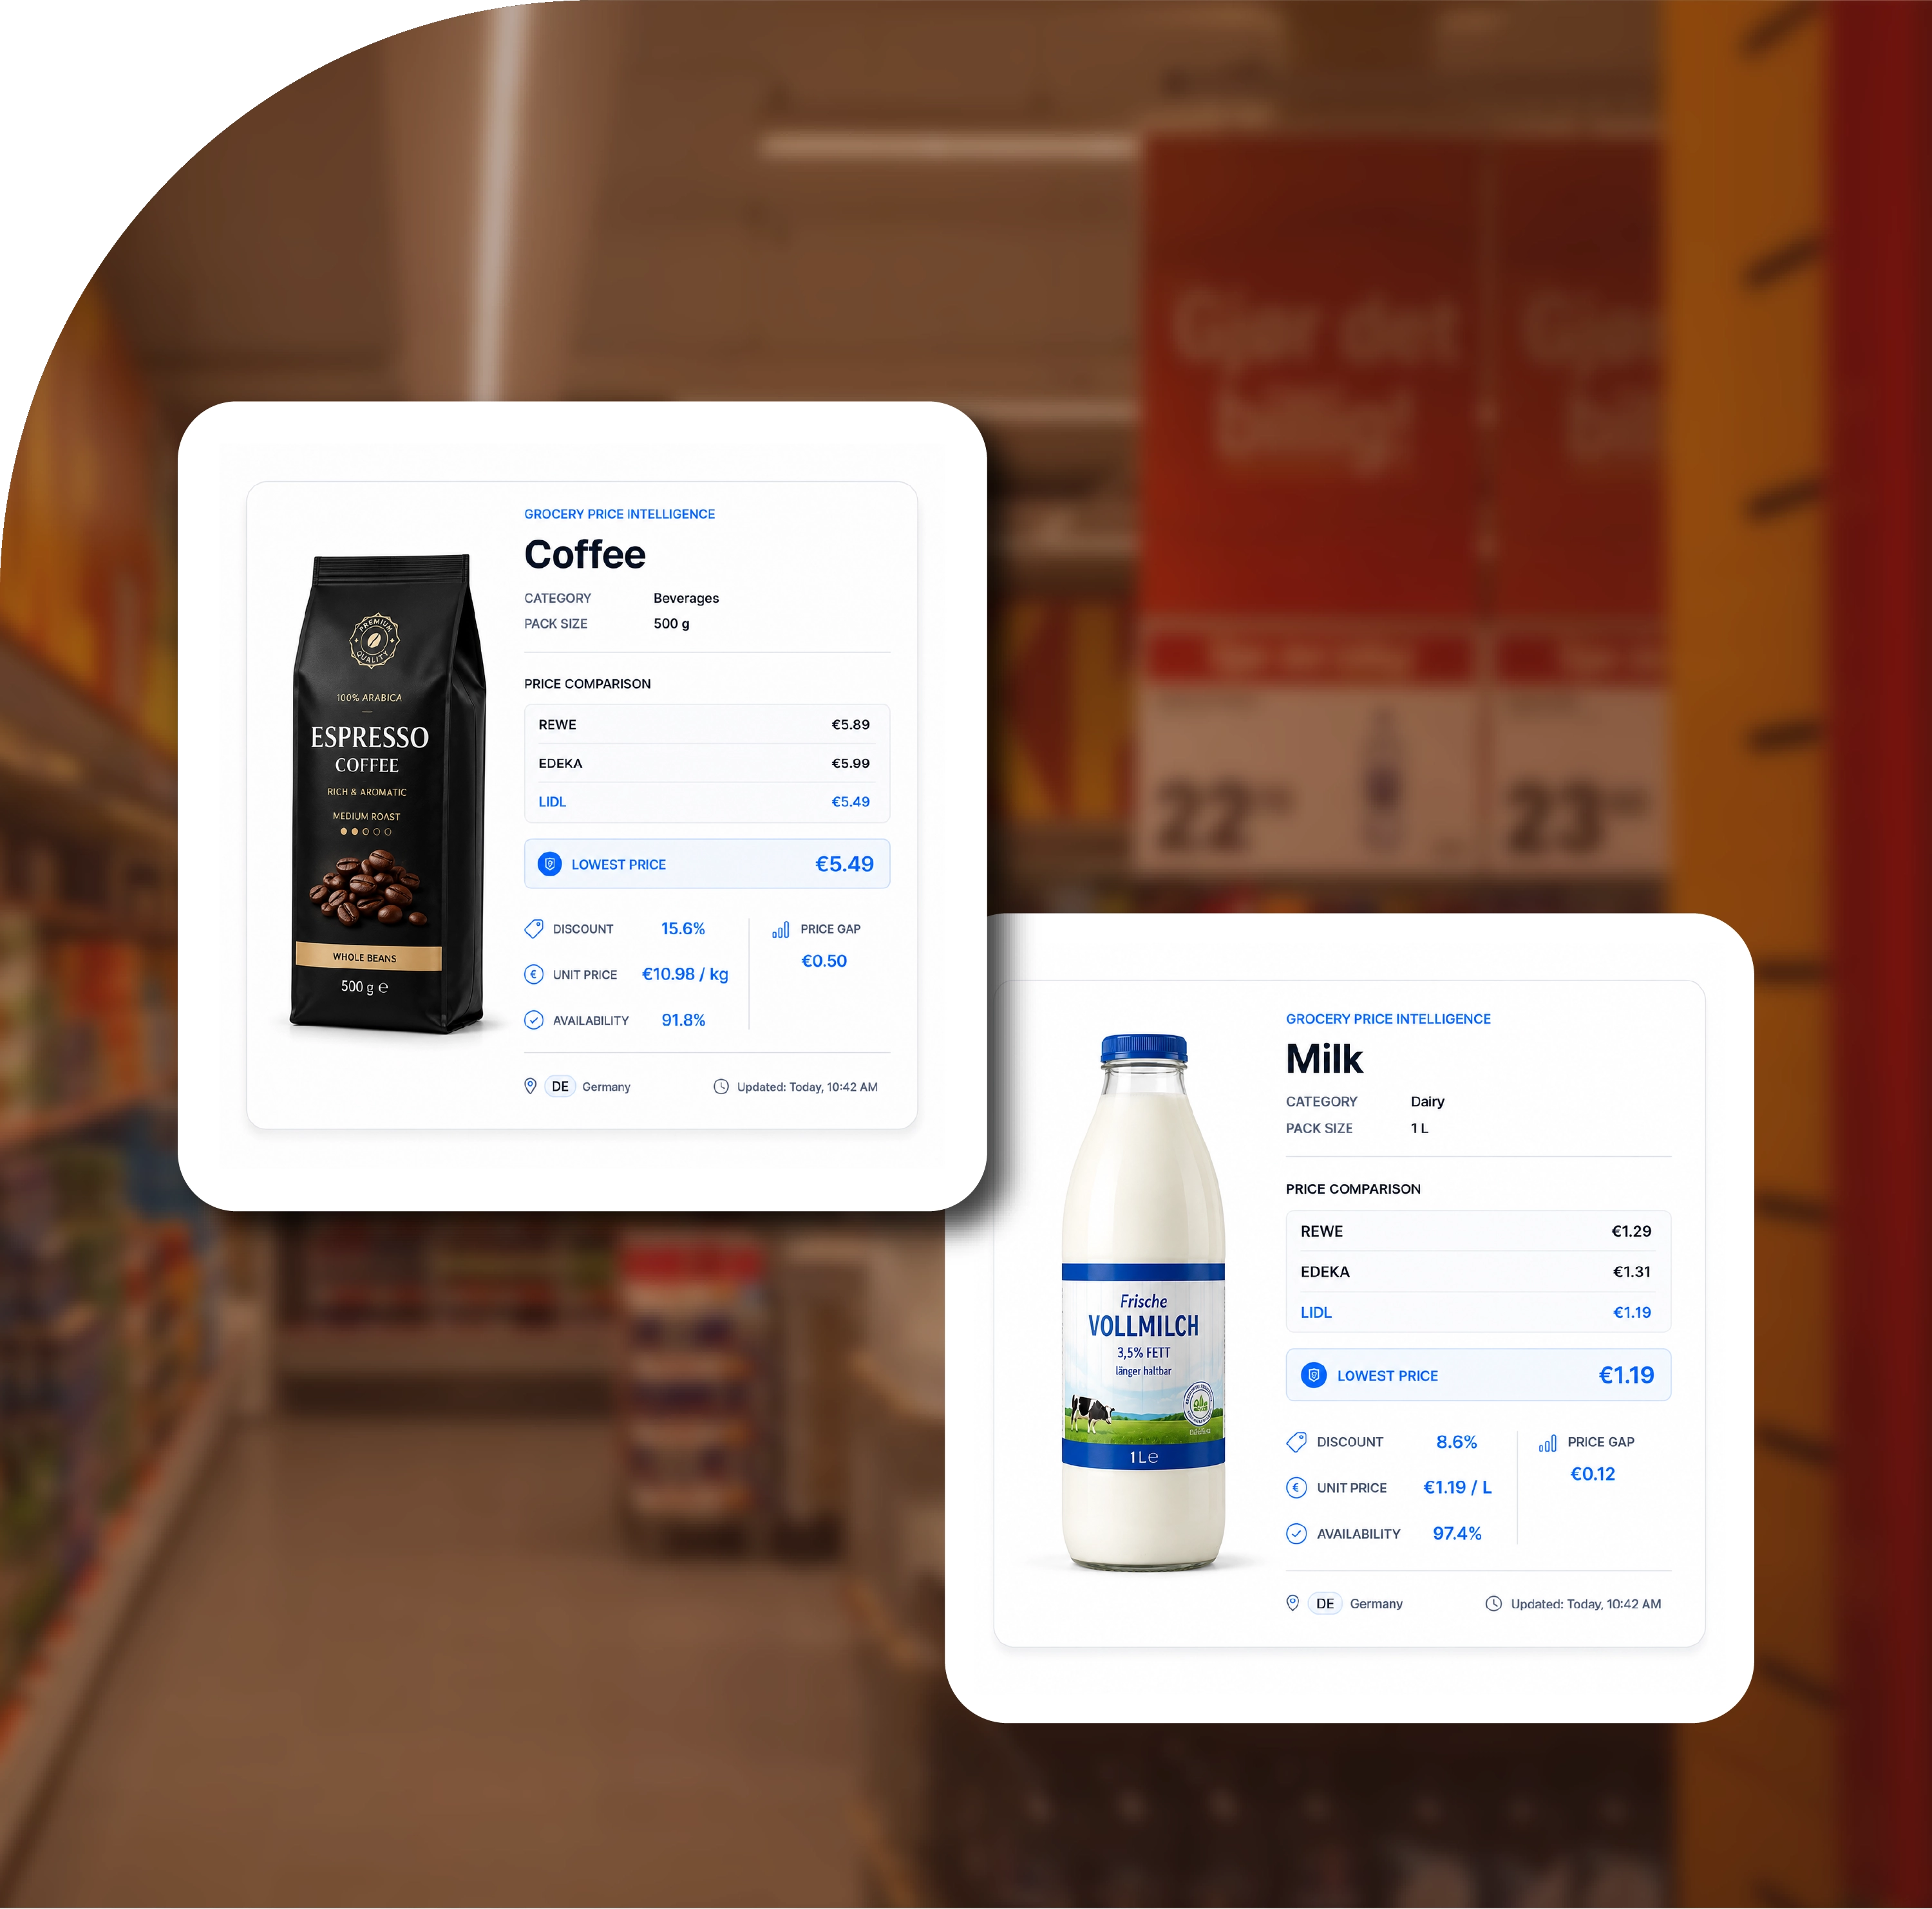
| Milk | 48 | 1.29 | 1.31 | 1.19 | 1.19 | 1.31 | 8.6 | 0.12 | 97.4 | 1,440 | 126 |
| Butter | 36 | 2.39 | 2.45 | 2.19 | 2.19 | 2.45 | 11.8 | 0.26 | 95.9 | 1,080 | 104 |
| Bread | 52 | 1.89 | 1.94 | 1.69 | 1.69 | 1.94 | 9.4 | 0.25 | 96.8 | 1,560 | 138 |
| Eggs | 31 | 2.49 | 2.55 | 2.29 | 2.29 | 2.55 | 10.7 | 0.26 | 94.6 | 930 | 97 |
| Cheese | 44 | 3.29 | 3.35 | 2.99 | 2.99 | 3.35 | 12.3 | 0.36 | 93.7 | 1,320 | 119 |
| Yogurt | 39 | 1.69 | 1.74 | 1.49 | 1.49 | 1.74 | 13.1 | 0.25 | 96.1 | 1,170 | 111 |
| Coffee | 27 | 5.89 | 5.99 | 5.49 | 5.49 | 5.99 | 15.6 | 0.50 | 91.8 | 810 | 86 |
| Soft Drinks | 41 | 2.79 | 2.85 | 2.49 | 2.49 | 2.85 | 14.2 | 0.36 | 92.9 | 1,230 | 103 |
| Snacks | 46 | 2.19 | 2.24 | 1.99 | 1.99 | 2.24 | 16.4 | 0.25 | 94.3 | 1,380 | 121 |
| Frozen Foods | 34 | 3.49 | 3.59 | 3.19 | 3.19 | 3.59 | 12.9 | 0.40 | 90.7 | 1,020 | 94 |
| Total / Average | 398 | 2.74 | 2.80 | 2.45 | 1.19 | 5.99 | 12.5 | 0.30 | 94.2 | 11,940 | 1,099 |
Illustrative research figures showing how a multi-retailer grocery pricing dataset can be structured. These figures are not presented as current retailer prices.
Grocery Market Intelligence with REWE, Edeka & Lidl Data becomes particularly valuable when current observations are combined with historical records. A single price tells analysts what a product costs at a particular moment. A historical dataset shows how that price behaves over time.
Historical records can reveal whether a product experiences frequent promotional reductions, whether prices remain relatively stable, or whether price increases occur gradually. Researchers can also identify periods of unusually high promotional activity.
Price volatility can be calculated for individual products and categories. A product with frequent price changes may require more frequent monitoring than a relatively stable household staple.
Promotional analysis can also distinguish between standard pricing and temporary discounts. This allows researchers to calculate average discount depth, promotion frequency, promotional duration, and the proportion of products discounted during specific periods.
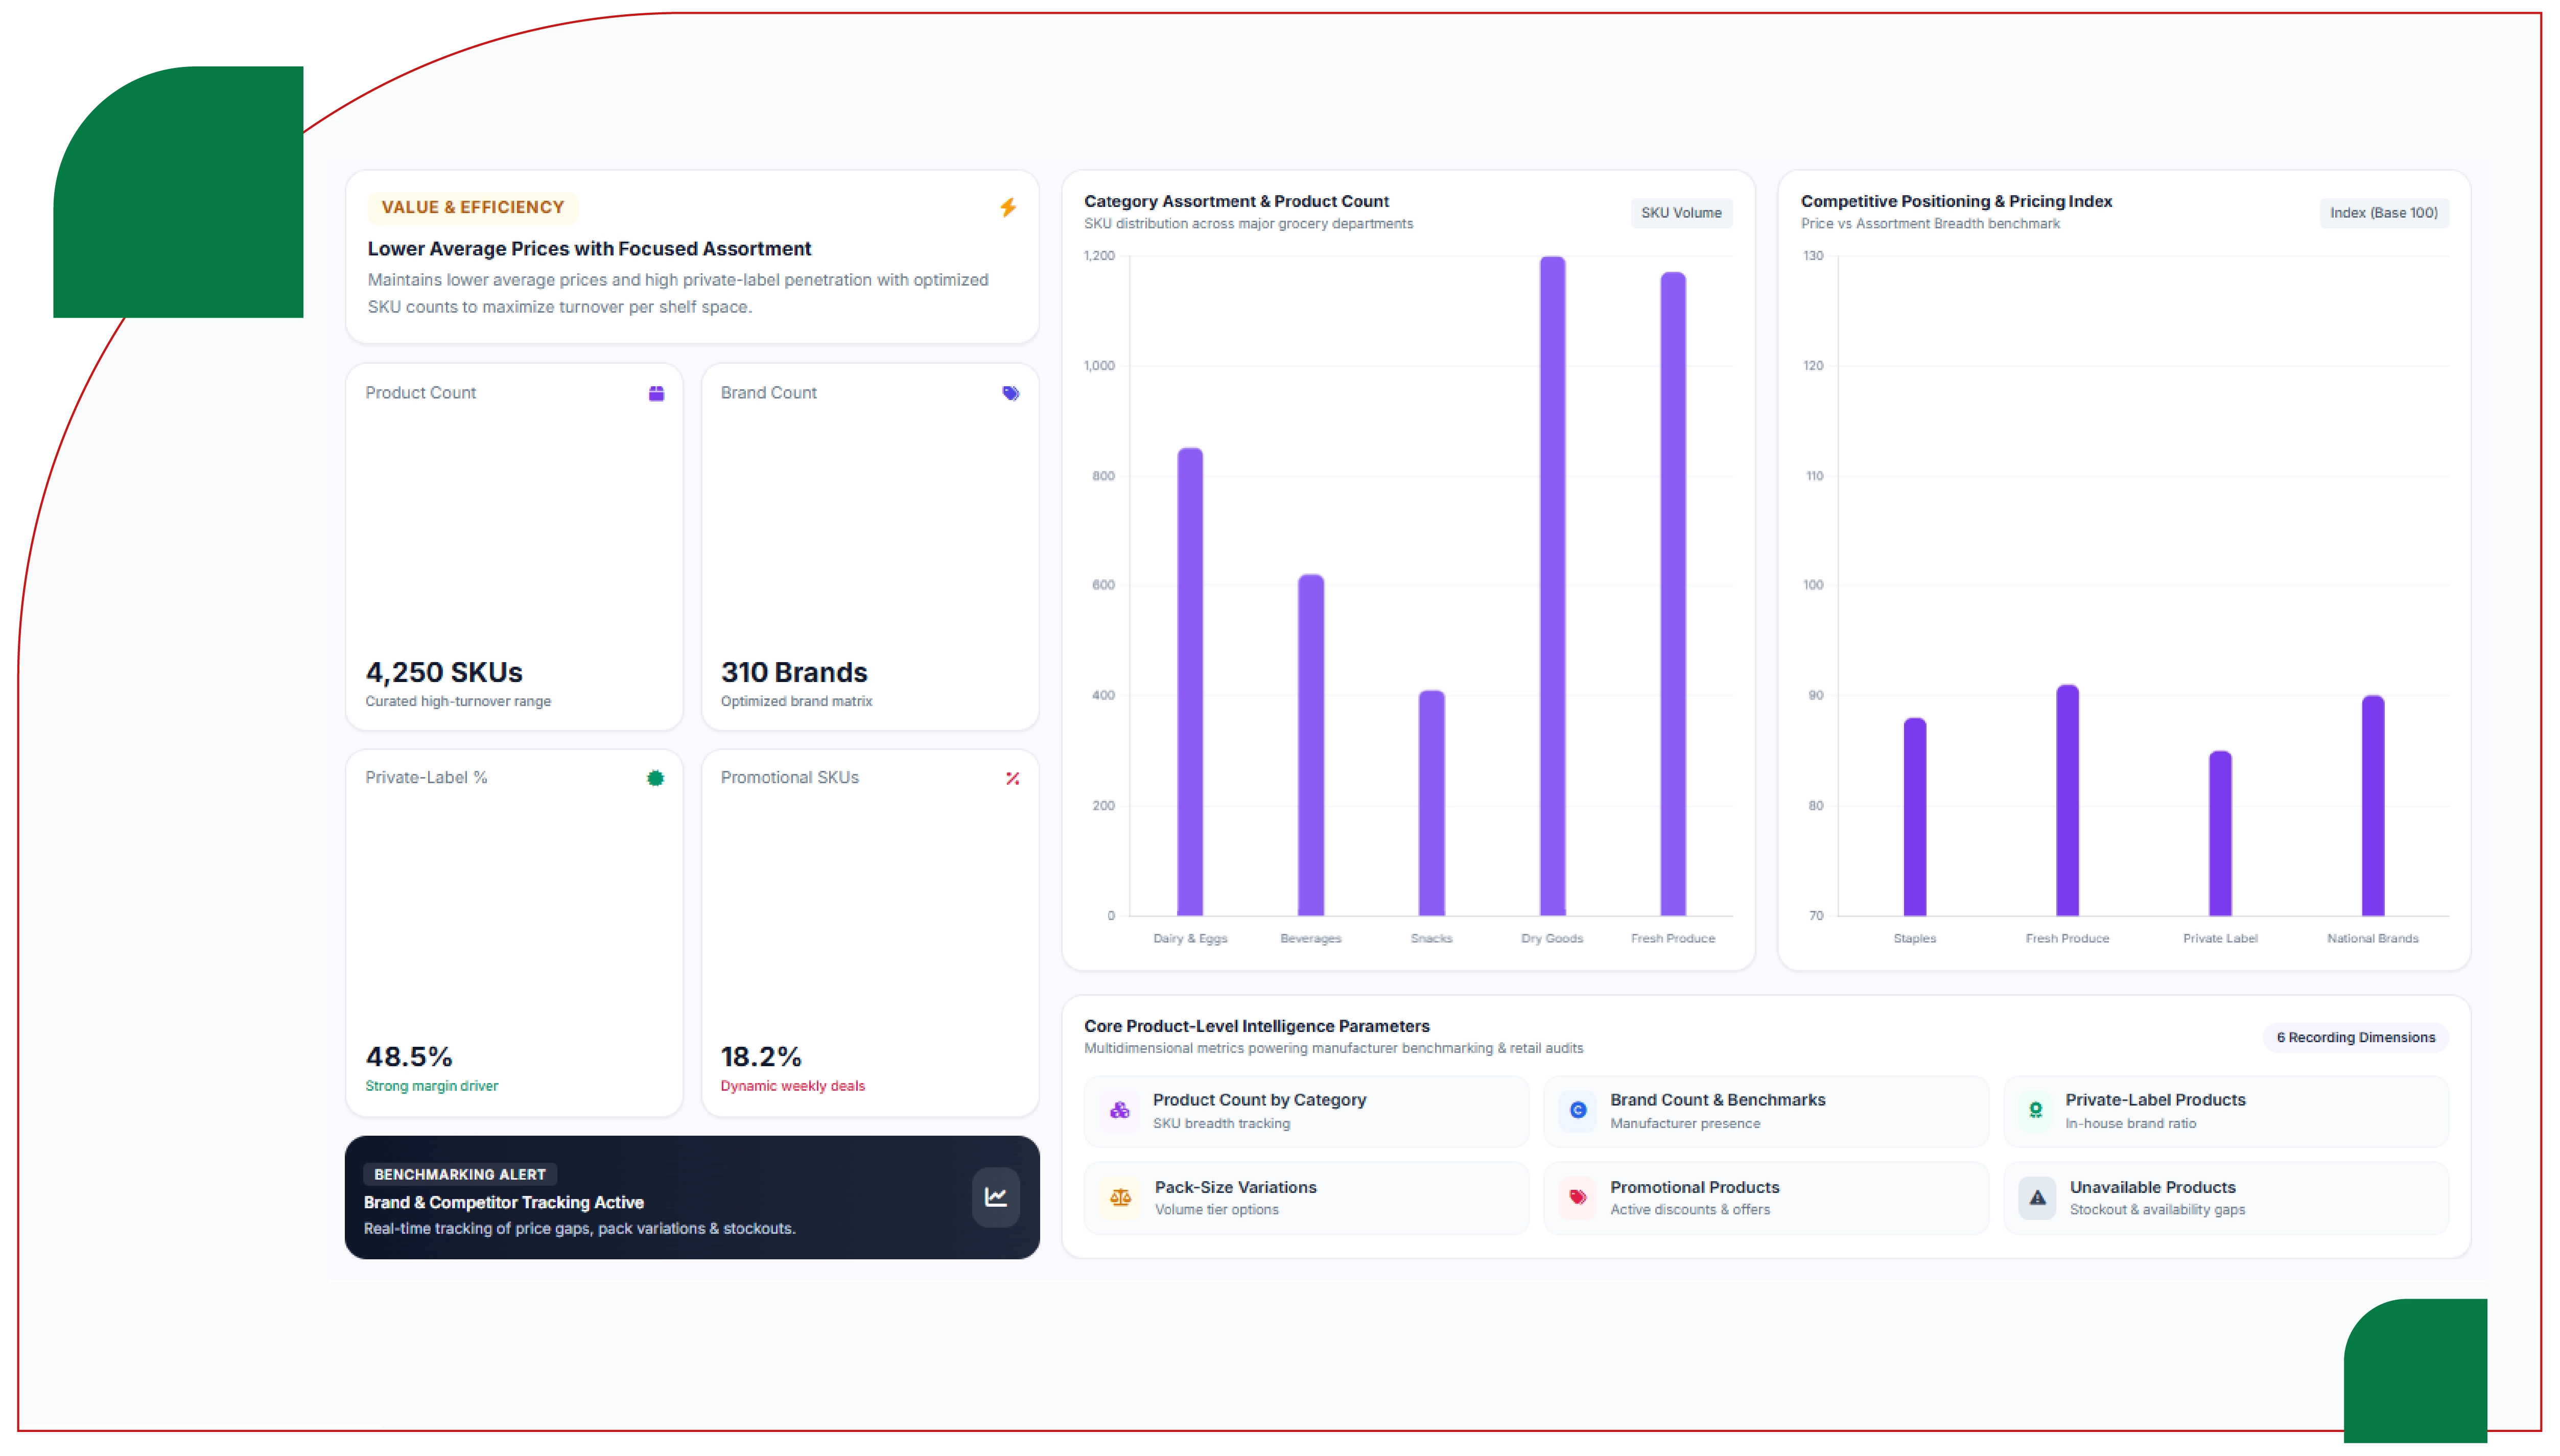
Price intelligence becomes more useful when combined with assortment information. Two retailers may have similar prices in a category while offering substantially different numbers of products.
A dataset can therefore record product count by category, brand count, private-label products, pack-size variations, promotional products, and unavailable products. This creates a broader view of competitive positioning.
For example, if Lidl has fewer products in a particular category but maintains lower average prices, its competitive positioning differs from a retailer with a substantially larger assortment. Conversely, Edeka or REWE may compete through assortment breadth rather than simply offering the lowest price.
Product-level information can also support brand benchmarking. Manufacturers can track their products across multiple retailers and identify price differences, promotional activity, and availability issues.
Online grocery services provide another layer of intelligence because customers can encounter differences between physical-store and digital shopping environments. Product availability, delivery regions, delivery charges, minimum order values, and available time slots can influence the overall shopping experience.
REWE Online Supermarkt Grocery Dataset development can combine product information with online pricing, availability, category, delivery-region information, and timestamps. Such a dataset can support historical analysis of online grocery assortment and pricing.
Online grocery collection can also capture the relationship between product pricing and availability. A product marked as unavailable at one point and available later can be recorded as a time-series event rather than simply being treated as missing data.
For discount-retail research, Scrape Online Lidl Grocery Delivery App Data to focus on product information, prices, promotional offers, availability, categories, and other publicly accessible attributes.
Geographic variation is another important dimension of German grocery research. Online availability can vary according to delivery location, while product assortment and promotional activity may differ between regions.
A robust dataset can therefore contain location identifiers alongside product and price information. Researchers can compare price distributions across selected regions and determine whether differences are temporary or persistent.
| Research Metric | REWE | Edeka | Lidl | Weekly Records | Monthly Records | Annual Records | Promotion Events | Stockout Events | Avg. Price Change (%) | Regional Locations | Categories |
|---|---|---|---|---|---|---|---|---|---|---|---|
| Tracked Products | 8,500 | 7,900 | 6,700 | 23,100 | 92,400 | 1,108,800 | 8,420 | 3,180 | 2.7 | 120 | 32 |
| Dairy | 980 | 1,060 | 760 | 4,200 | 16,800 | 201,600 | 1,620 | 580 | 2.1 | 90 | 6 |
| Beverages | 1,140 | 1,020 | 890 | 4,560 | 18,240 | 218,880 | 1,940 | 620 | 2.4 | 85 | 7 |
| Bakery | 720 | 810 | 650 | 3,640 | 14,560 | 174,720 | 1,270 | 510 | 2.8 | 76 | 5 |
| Frozen Foods | 610 | 570 | 520 | 2,980 | 11,920 | 143,040 | 1,030 | 490 | 3.2 | 68 | 4 |
| Snacks | 870 | 790 | 680 | 3,740 | 14,960 | 179,520 | 1,480 | 540 | 3.4 | 81 | 5 |
| Household | 1,020 | 930 | 760 | 4,080 | 16,320 | 195,840 | 1,520 | 610 | 3.0 | 88 | 6 |
| Personal Care | 760 | 710 | 590 | 3,100 | 12,400 | 148,800 | 1,160 | 460 | 2.9 | 73 | 5 |
| Fresh Produce | 1,400 | 1,520 | 1,080 | 5,600 | 22,400 | 268,800 | 2,080 | 1,340 | 4.2 | 115 | 8 |
| Overall | 16,000 | 15,310 | 12,630 | 40,000+ | 160,000+ | 1,920,000+ | 53,000+ | 19,000+ | 3.0 | 100+ | 40+ |
Illustrative research figures for demonstrating a scalable grocery monitoring framework; they are not claimed as live retailer measurements.
Once the data has been collected and standardized, it can be integrated into a pricing intelligence dashboard. The dashboard can provide retailer comparisons, category-level analysis, product-level historical trends, promotion tracking, availability monitoring, and regional comparisons.
REWE, Edeka & Lidl Price Monitoring can be organized around several analytical layers. The first layer tracks current prices, while the second maintains historical observations. A third layer calculates price differences and percentage changes between retailers.
Alerts can then be configured around meaningful events. For example, a pricing team can receive notifications when a monitored product's price changes beyond a predefined threshold, when a competitor introduces a significant promotion, or when an important product becomes unavailable.
Basket-level monitoring can further simplify competitive analysis. Analysts can create standardized baskets and compare their total cost across retailers over time, making it easier to observe overall pricing movements rather than focusing on isolated products.
The resulting datasets can support several research and commercial applications. Retailers can use them for competitive benchmarking, assortment planning, promotion analysis, and pricing research. Consumer brands can monitor retail execution and compare their products across competing channels.
Market researchers can analyze grocery inflation, category-level price movements, private-label competition, and promotional intensity. E-commerce businesses can develop price comparison platforms, grocery intelligence dashboards, and consumer price-alert systems.
Historical data can also support predictive analytics. Price history, promotional frequency, availability, category, retailer, seasonality, and regional variables can be combined to develop models for forecasting future pricing patterns.
REWE, Edeka, and Lidl provide a valuable data environment for studying German grocery prices, product assortments, promotions, and online availability. A structured data collection strategy makes it possible to transform frequently changing retail information into historical datasets suitable for competitive research and market intelligence.
Businesses requiring automated data infrastructure can use an EDEKA Grocery Delivery Scraping API approach to collect structured product and pricing information for analytical workflows.
A REWE Lieferservice Quick Commerce Data Scraping API can similarly support systematic collection of online grocery product, price, availability, and delivery-related information.
For discount-retail intelligence, a Lidl Grocery Delivery Scraping API can provide structured data inputs for price monitoring, promotional analysis, assortment comparison, and historical grocery research.
When these data streams are normalized, timestamped, and analyzed together, businesses can build a comprehensive view of German grocery competition and make more informed pricing, assortment, promotion, and market intelligence decisions.
Are you in need of high-class scraping services? Food Data Scrape should be your first point of call. We are undoubtedly the best in Food Data Aggregator and Mobile Grocery App Scraping service and we render impeccable data insights and analytics for strategic decision-making. With a legacy of excellence as our backbone, we help companies become data-driven, fueling their development. Please take advantage of our tailored solutions that will add value to your business. Contact us today to unlock the value of your data.