
Boo-st your food data. Save 20% on scraping services
Menus · Grocery · Alcohol · AI Intelligence, across 40+ countries

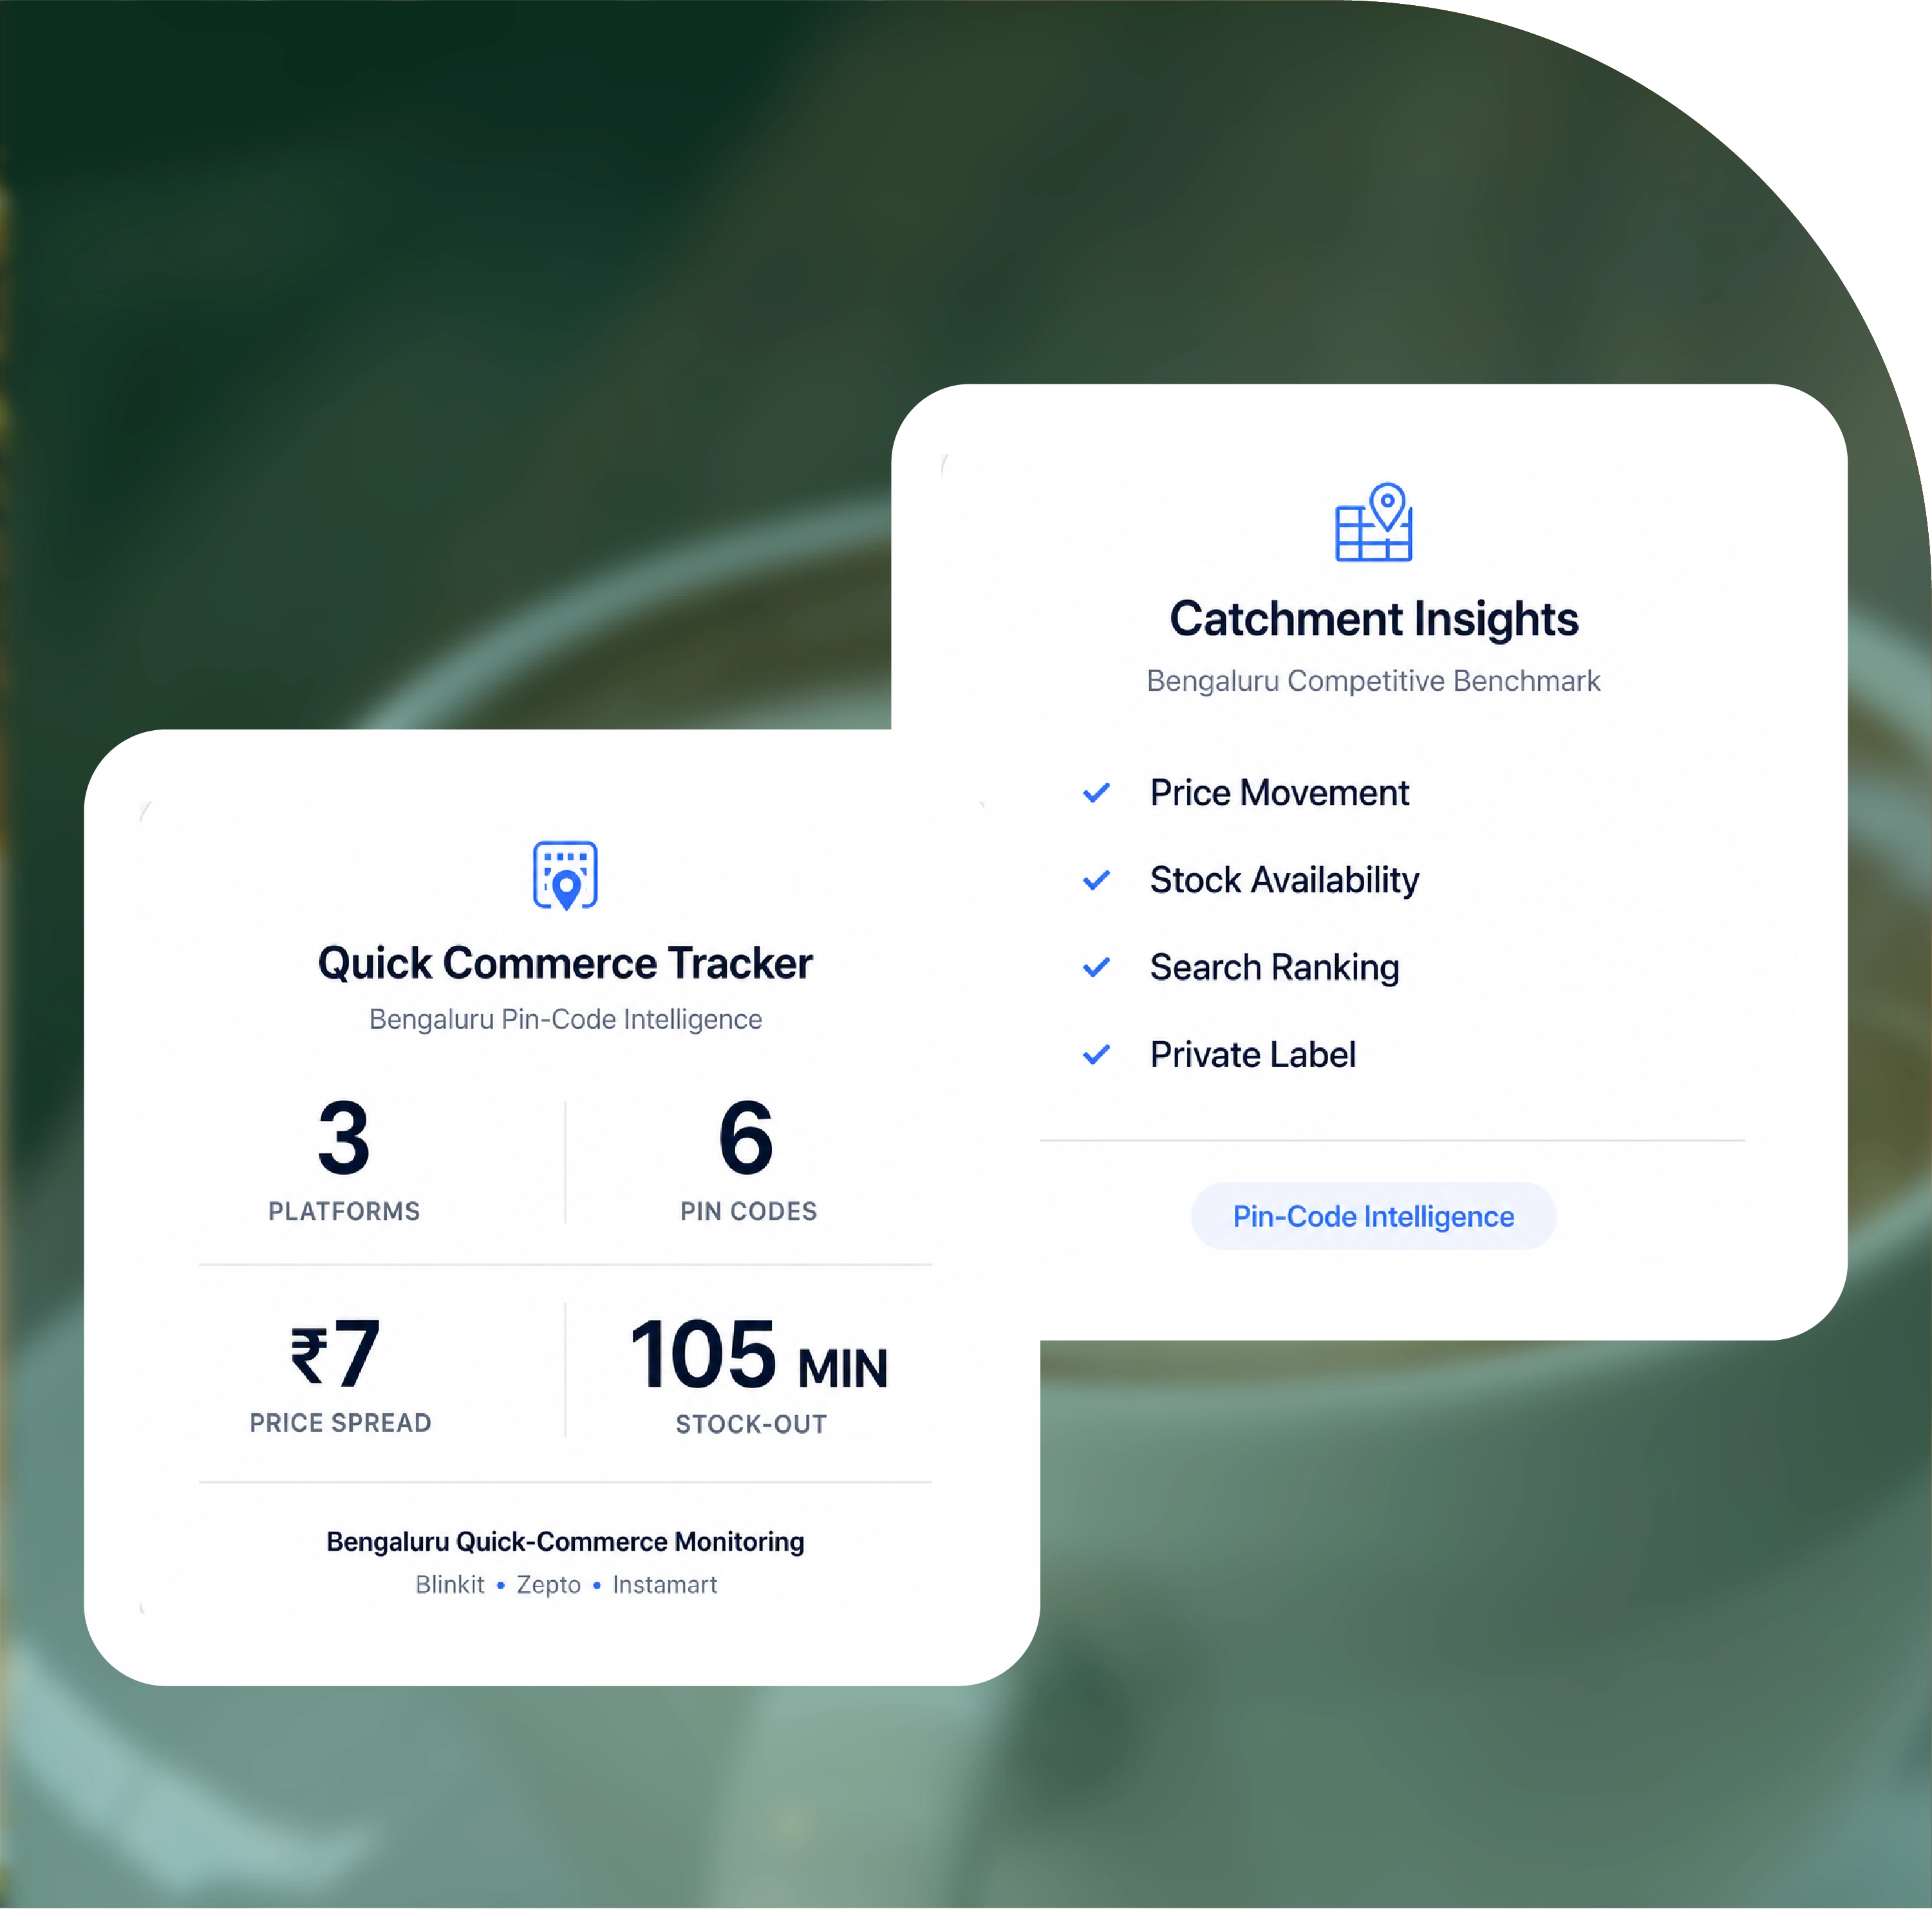
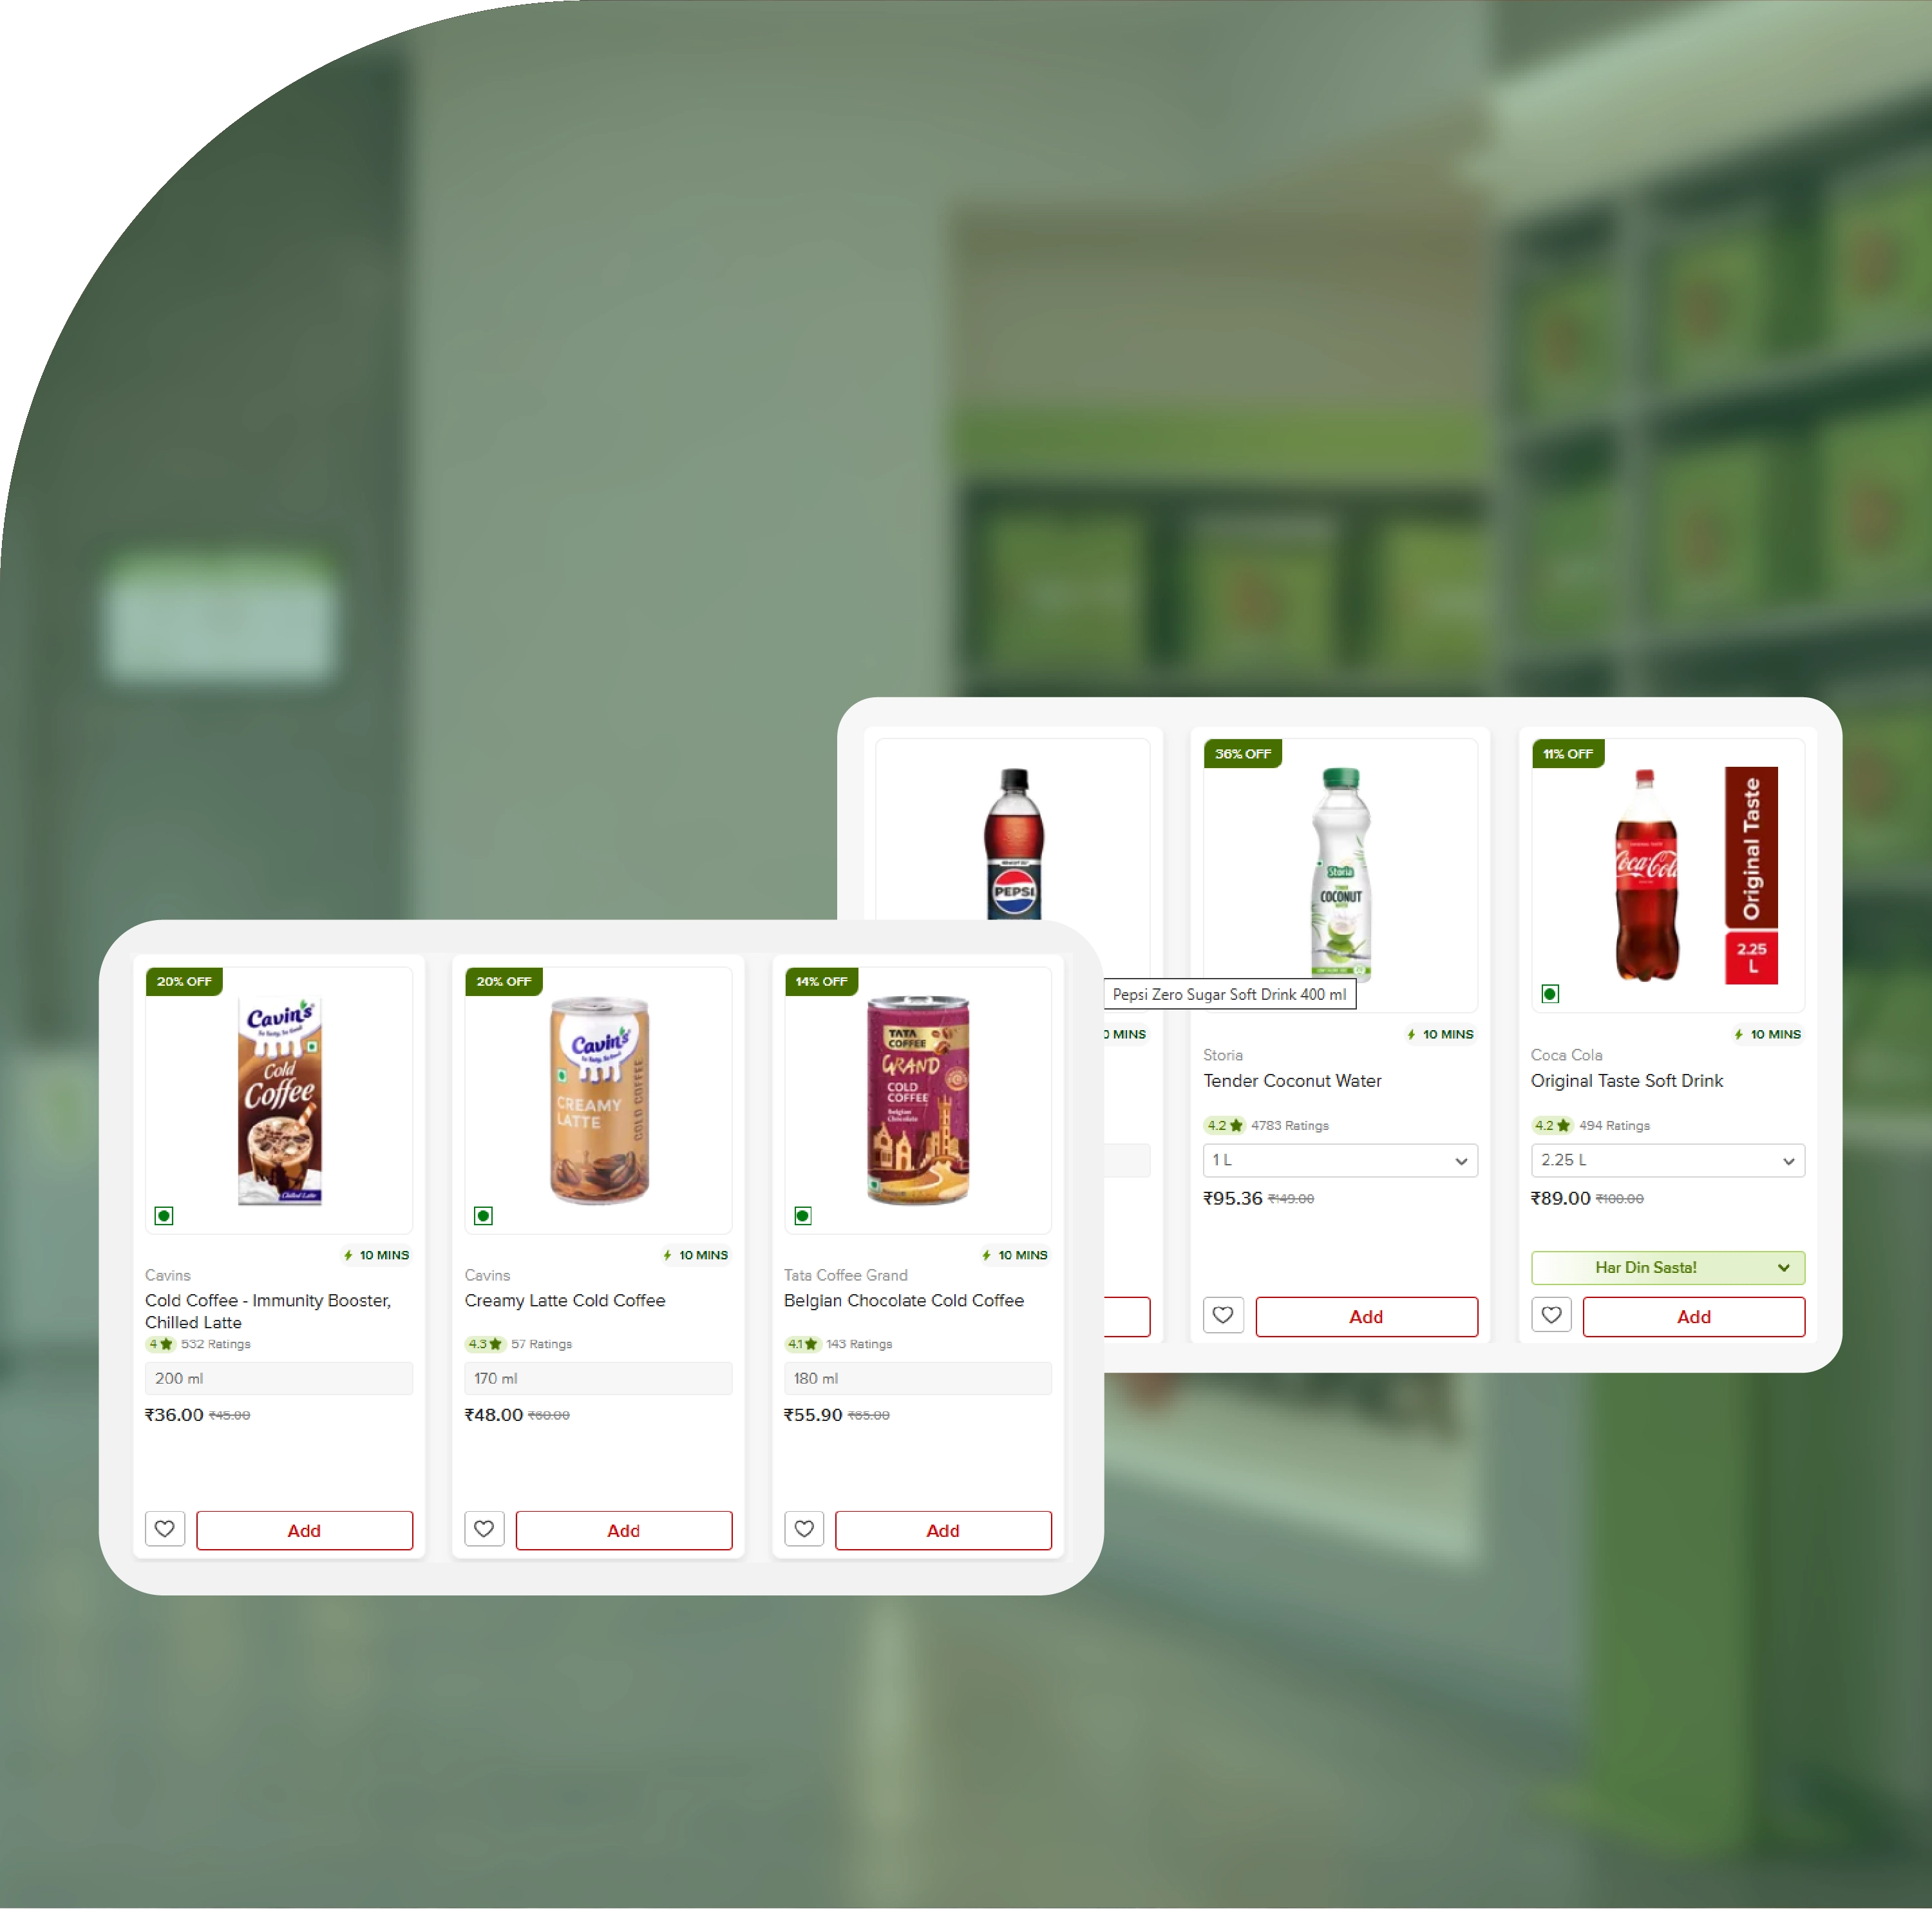
Price Insights: Pin-code level competitor price intelligence improves pricing accuracy and strategic competitiveness across every Bengaluru catchment, not just a citywide average.
Market Monitoring: Real-time tracking identifies promotions, discounts, stock-outs and assortment shifts efficiently, so a competitor's move is seen the same day rather than weeks later.
Retail Analytics: Advanced analytics turn raw catalogue and pricing data into profitable, evidence-based decisions on price, replenishment and content.
Competitive Intelligence: Automated monitoring benchmarks brand and platform performance consistently across catchments, categories and competitors — including private label.
Growth Opportunities: Data-driven insights on availability, share of search and price positioning support revenue growth, stock-out prevention and operational efficiency.

Bengaluru is the most demanding quick-commerce market in India, and therefore the most revealing. Its density, its dual-income households and its appetite for ten-minute delivery have turned the city into a grid of thousands of dark store catchments, each with its own live inventory, its own price list and its own competitive shape. What a shopper sees in Koramangala is not what a shopper sees in Whitefield, even for the same product on the same platform in the same hour.
For any brand, retailer or investor trying to understand this market, that fragmentation is the central problem. The platforms show each customer one view — their own — and nobody the whole board. Yet the whole board is where every commercial question lives: where a product is listed and where it is not, where it is out of stock during the evening peak, where it ranks when a shopper searches, and where a competitor or private label is quietly winning shelf.
This report explains how Quick Commerce Data Scraping reconstructs that board for Bengaluru, what the resulting intelligence looks like, and how businesses act on it. At FoodDataScrape, we crawl 220M+ pages of food and grocery data every week, including pin-code level catalogue extraction across Blinkit, Zepto and Swiggy Instamart. The numbers in this report's market context are drawn from published sources; the sample datasets are illustrative of structure and field coverage.
India's quick commerce sector was valued at roughly USD 11.5 billion at the end of 2025, according to Datum Intelligence figures cited by Reuters. Quick commerce now accounts for more than two-thirds of India's e-grocery orders, and its gross merchandise value has grown several times over in just a few years.
Platform share, as of early 2026, concentrates around three players: Blinkit leads with a share of about 48%, Swiggy Instamart holds roughly 24%, and Zepto around 22%, with BigBasket's quick-commerce arm and newer entrants such as Amazon Now and Flipkart Minutes filling the remainder. Nationally, more than 6,000 dark stores now operate, each holding independent inventory.
That last figure is the entire justification for a report like this. With thousands of dark stores holding independent stock, there is no such thing as a national Blinkit price or a citywide Zepto availability number. Everything resolves to the catchment. A brand that monitors quick commerce at the platform level is monitoring an average that describes no real shopper's experience — and in Bengaluru, where the catchments are densest and the competition sharpest, that average hides the most.
| Platform | Market Share | Dark Stores (approx.) | Key Focus Markets |
|---|---|---|---|
| Blinkit | 48% | 2,880 | Metro cities |
| Swiggy Instamart | 24% | 1,440 | Tier 1 & 2 cities |
| Zepto | 22% | 1,320 | High-density urban |
| Others | 6% | 360 | Select regions |
The table above illustrates the concentration of market share among three dominant players. Each dark store operates independently, creating localized assortment, pricing, and availability that varies by catchment even within the same city. Bengaluru, with its dense population and high quick-commerce adoption, experiences the most pronounced localisation effects across these platforms.
Bengaluru concentrates every reason catchment-level extraction exists. The city's geography, consumer density, and competitive intensity make it the ultimate proving ground for data-driven quick-commerce intelligence.
Overlapping catchments. A single locality is often served by multiple dark stores, each with distinct assortment and stock. City-level data cannot see this; catchment-level data can. In areas like Koramangala, multiple dark stores from the same platform may serve adjacent pin codes with different inventory compositions.
Aggressive competition. With Blinkit, Instamart and Zepto contesting the same zones, promotional intensity and price movement are among the highest in the country, and they differ street by street. A product discounted in one catchment may be full price just a few kilometres away.
Localised pricing. The same SKU routinely carries different prices across Bengaluru pin codes, driven by catchment-level demand and competition. Price gaps of 10-15% between adjacent catchments are common.
Volatile assortment. New SKUs, delistings and pack changes move quickly in a market this contested, and a delisting in one catchment is invisible in a citywide view. A brand dropped in Whitefield may still be listed in Koramangala, creating distribution gaps that go undetected without catchment-level monitoring.
The rule is simple: if a quick-commerce intelligence approach works in Bengaluru, it works anywhere. If it stops at the city average, it fails here first.
The record below reflects a FoodDataScrape quick-commerce extract for a single SKU in one Bengaluru pin code. Values are illustrative.
    {
        "sku_name": "Example Brand Cold Coffee 200ml",
        "brand": "Example Brand",
        "category": "Ready-to-Drink Beverages",
        "city": "Bengaluru",
        "pin_code": "560095",
        "dark_store_catchment": "Koramangala",
        "platform_data": [
            {
                "platform": "Blinkit",
                "listed": true,
                "mrp_inr": 90,
                "selling_price_inr": 85,
                "in_stock": true,
                "category_rank": 4,
                "delivery_promise_min": 11
            },
            {
                "platform": "Zepto",
                "listed": true,
                "mrp_inr": 90,
                "selling_price_inr": 79,
                "in_stock": true,
                "category_rank": 6,
                "delivery_promise_min": 9
            },
            {
                "platform": "Swiggy Instamart",
                "listed": true,
                "mrp_inr": 90,
                "selling_price_inr": 89,
                "in_stock": false,
                "category_rank": 9,
                "delivery_promise_min": 13
            }
        ]
    }
Same product, same pin code, same hour — a ₹10 spread across platforms, an out-of-stock on one, and a category rank ranging from 4th to 9th. Each of those is a decision. The spread is a channel-conflict signal. The stock-out is lost revenue. The 9th-place rank is invisibility. None of it is visible from inside any one app.
| Platform | Listed | MRP (₹) | Selling Price (₹) | In Stock | Category Rank | Delivery (min) |
|---|---|---|---|---|---|---|
| Blinkit | Yes | 90 | 85 | Yes | 4 | 11 |
| Zepto | Yes | 90 | 79 | Yes | 6 | 9 |
| Swiggy Instamart | Yes | 90 | 89 | No | 9 | 13 |
Product: Example Brand Cold Coffee 200ml — Platform: Blinkit
| Pin Code | Catchment | Price (₹) | In Stock | Category Rank |
|---|---|---|---|---|
| 560095 | Koramangala | 85 | Yes | 4 |
| 560034 | Ejipura | 82 | Yes | 3 |
| 560066 | Whitefield | 89 | No | 8 |
| 560102 | HSR Layout | 85 | Yes | 5 |
| 560078 | JP Nagar | 87 | Yes | 6 |
| 560001 | MG Road | 85 | Yes | 7 |
One retailer, one product, one day — a ₹7 spread across catchments, an out-of-stock in Whitefield, and a rank that swings from 3rd to 8th. The Whitefield stock-out during a peak window is revenue handed to whoever is on the shelf instead, and the 8th-place rank there means the product is effectively invisible to searchers in that catchment even when it is back in stock.
This granularity is what makes catchment-level data indispensable. A citywide average price of ₹85.50 hides the ₹7 spread and the stock-out entirely. A brand making decisions on that average would miss three separate commercial problems visible in the catchment-level view.
Search term: "cold coffee" — Platform: Zepto
| Catchment | Your Rank | Top-Ranked Product | Private Label in Top 5 |
|---|---|---|---|
| Koramangala | 4 | Competitor A | Yes |
| HSR Layout | 2 | Your SKU | Yes |
| Whitefield | 9 | Competitor B | No |
| Indiranagar | 3 | Competitor A | Yes |
| JP Nagar | 6 | Private Label | Yes |
Share of search is the most under-measured lever in Indian quick commerce, because brands cannot see it without catchment-level data. This grid shows the brand winning HSR Layout, competitive in Koramangala and Indiranagar, and effectively absent in Whitefield. Those are four different content-and-promotion decisions, and they are only visible when rank is tracked per catchment, per keyword.
A brand ranked 9th in Whitefield is functionally invisible to shoppers searching for "cold coffee." Even if the product is in stock at a competitive price, searchers will never find it. Without catchment-level rank tracking, this invisibility gap goes undetected.
| Timestamp | Pin Code | Catchment | Platform | Status | Duration |
|---|---|---|---|---|---|
| 18:35 | 560066 | Whitefield | Blinkit | Went OOS | — |
| 19:10 | 560001 | MG Road | Instamart | Went OOS | — |
| 20:20 | 560066 | Whitefield | Blinkit | Back in stock | 105 min |
| 21:40 | 560001 | MG Road | Instamart | Back in stock | 150 min |
Two stock-outs, both across the evening peak, one lasting more than two hours. In quick commerce, a peak-hour stock-out is not a minor gap — it is lost revenue in the exact window when order volume is highest. A product back in stock by the time a weekly check runs looks as though it was never gone; the event log says otherwise and quantifies the exposure in minutes.
This real-time visibility is what makes continuous data collection invaluable. A brand monitoring availability weekly would see the product as "available" at both catchments and miss the two-hour revenue gap entirely. With catchment-level stock-out tracking, the brand can identify the root cause — whether it's a dark store replenishment issue or a platform-specific allocation problem — and address it directly.
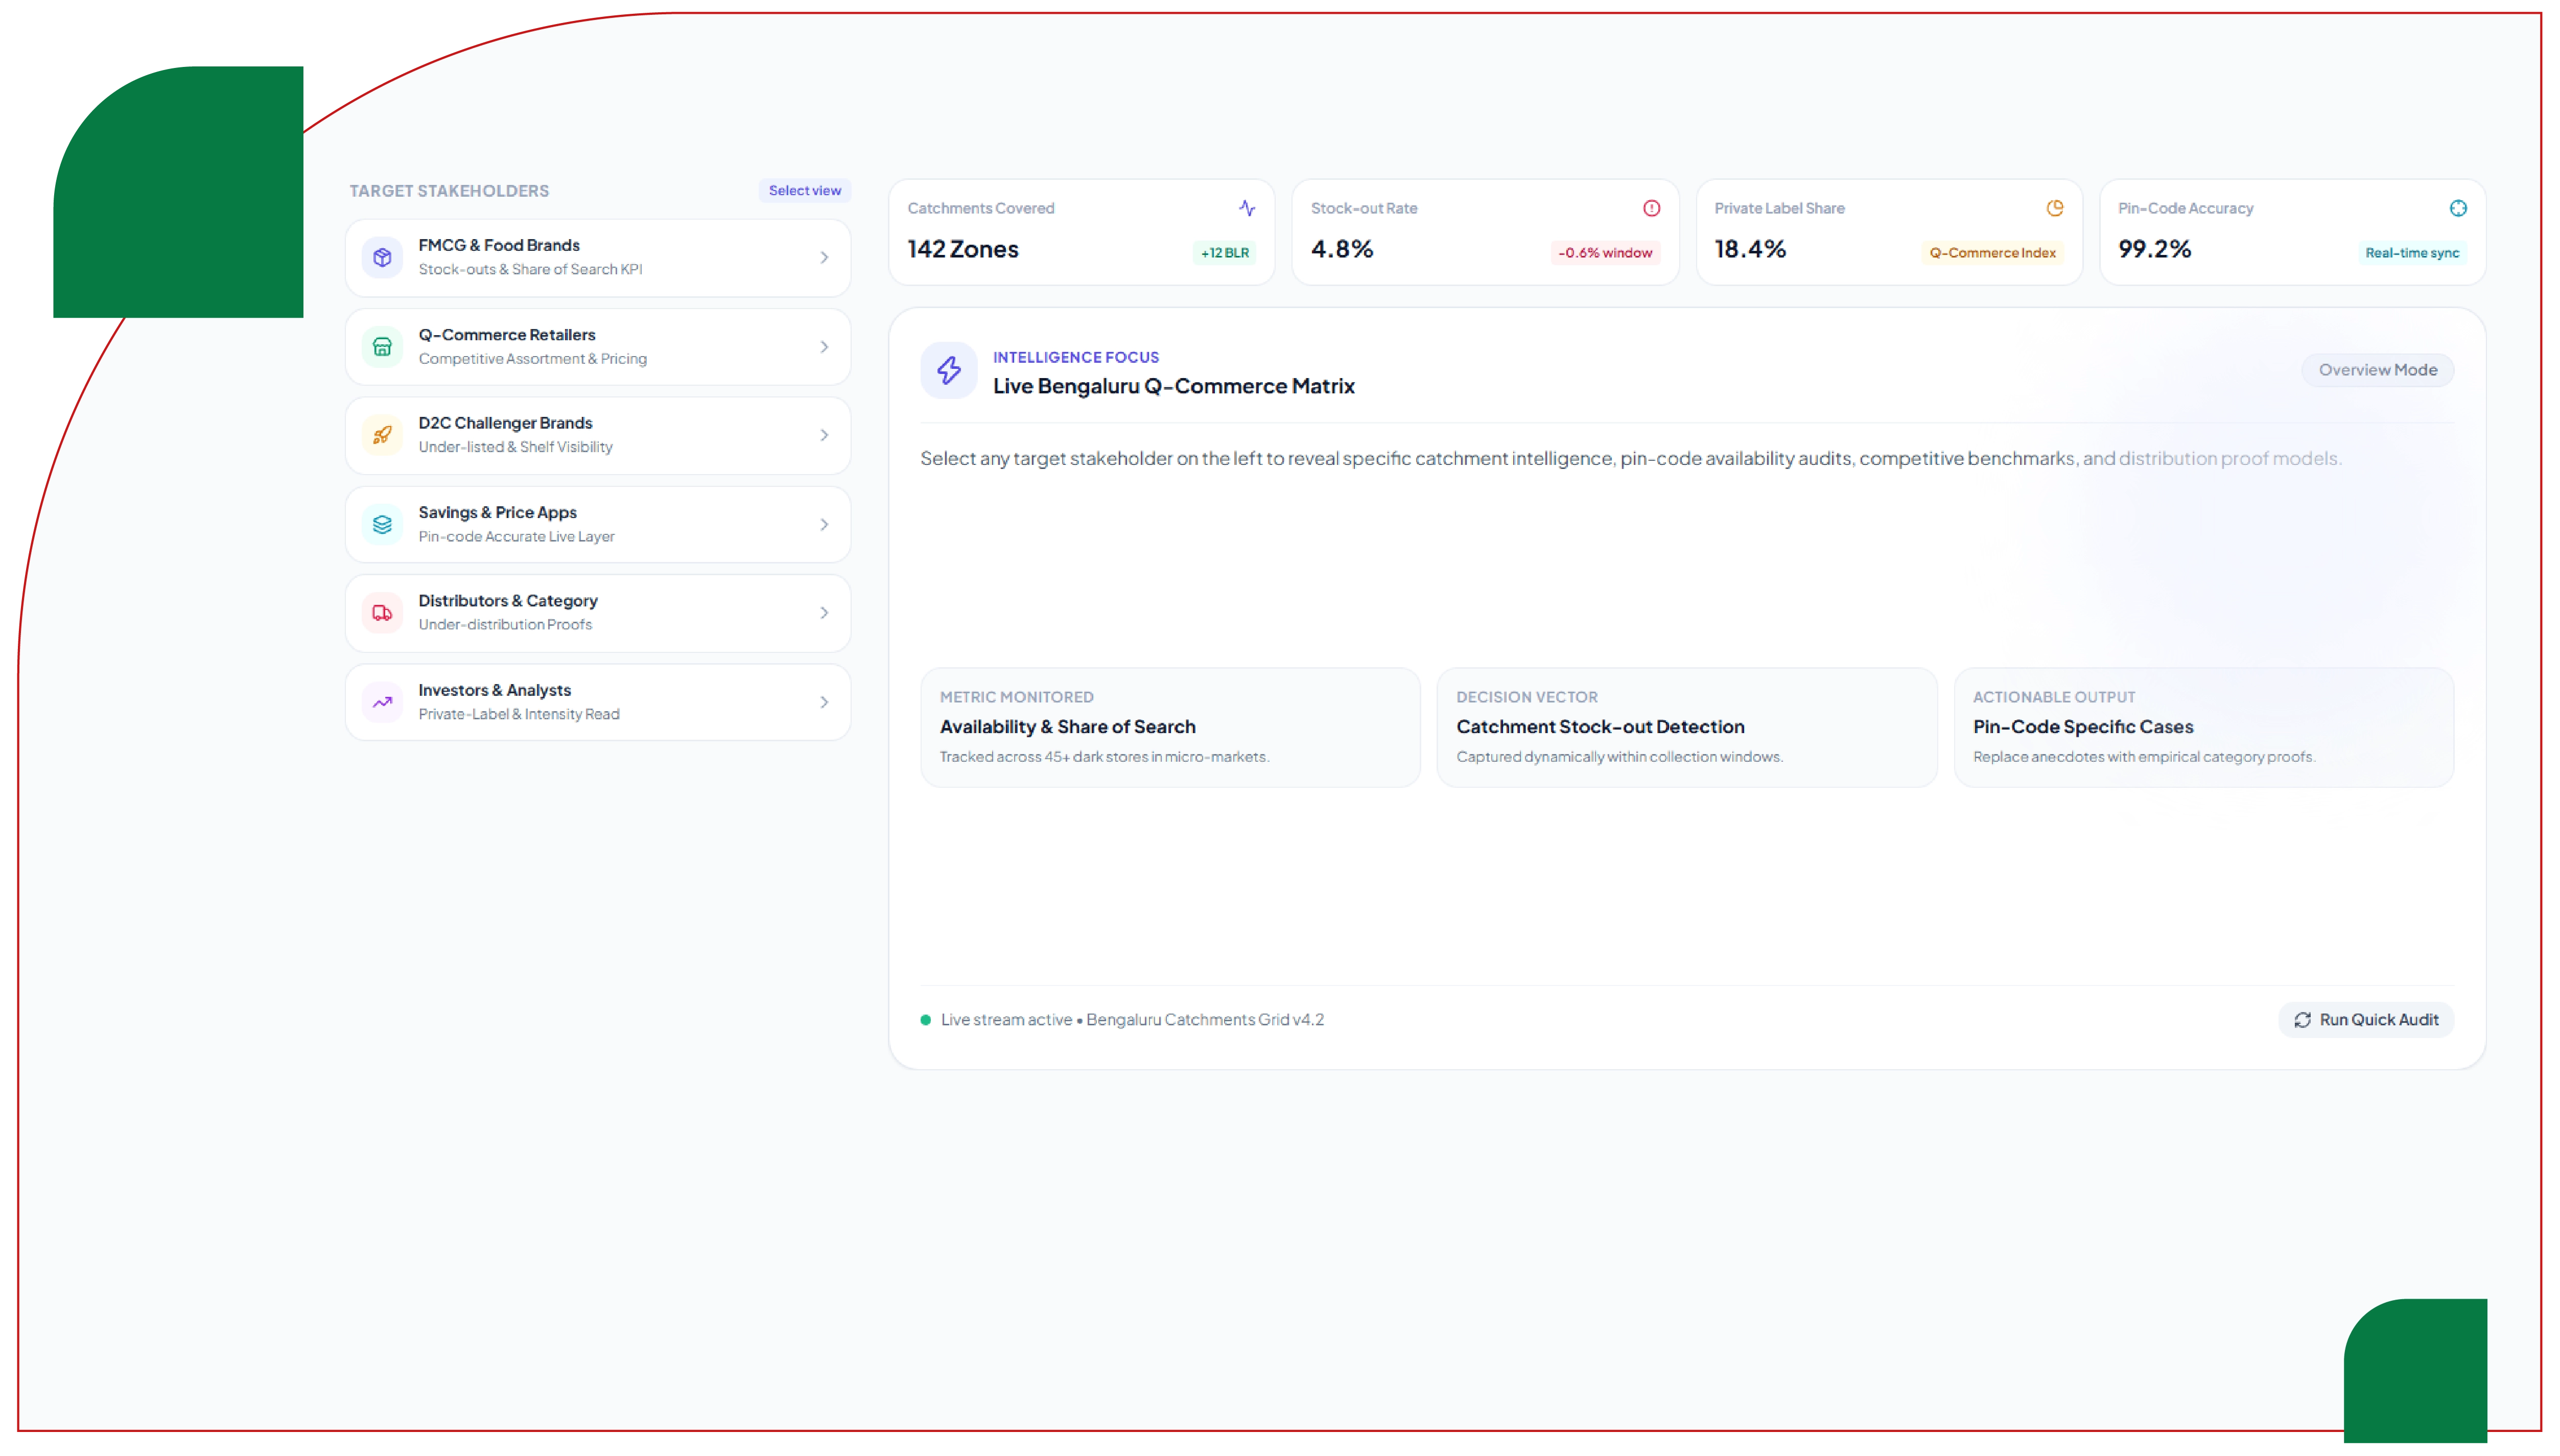
FMCG and food brands monitor availability across Bengaluru catchments, detect stock-outs within the collection window, benchmark price and rank against competitors and private label, and turn share of search into a tracked KPI rather than a blind spot. Brands can identify which catchments are underperforming and take targeted action on pricing, content, or distribution.
Quick commerce and grocery retailers benchmark competitive assortment and pricing catchment by catchment to inform their own range and price decisions. A platform can see exactly where competitors are out-of-stock and adjust promotional intensity to capture displaced demand.
D2C brands understand exactly where their products stand on platforms where they cannot see the shelf themselves, and identify catchments where they are under-listed or out-ranked. This enables precise, catchment-level investment decisions rather than blanket national strategies.
Price-comparison and savings apps power a live, pin-code-accurate price and availability layer without building collection infrastructure. Users can see which platform offers the best price for their specific delivery pin code, driving engagement and loyalty.
Distributors identify catchments where a brand they carry is under-distributed and make the case to platform category managers with pin-code specifics rather than anecdotes. Data-backed distributor negotiations are more effective and more likely to succeed.
Investors and analysts measure assortment depth, private-label penetration and promotional intensity in India's sharpest quick-commerce market as an independent read on platform and brand performance.
Delivered via API, live dashboard, webhook alerts for stock-outs and price moves, or scheduled files into BigQuery, Snowflake or flat storage, at a refresh cadence matched to field volatility.
Bengaluru's quick-commerce market does not have one shelf. It has thousands, each with its own price, its own stock and its own competitive shape, changing by the hour. The commercial questions that decide whether a brand grows or loses ground in this city — where it is listed, where it is out of stock, where it ranks, where the private label is winning — all live in the view no single app will ever show.
Quick Commerce Data Scraping reconstructs that view, at the pin-code level, with price and availability captured together and every change tracked over time. FoodDataScrape crawls 220M+ pages of food and grocery data every week so that your read on Bengaluru is the whole board, not the one corner a platform shows your customer.
Questions
Yes. Collection runs per dark store catchment for the pin codes you define, which is the only way to capture the price and availability variance that exists between adjacent Bengaluru localities.
Blinkit, Zepto and Swiggy Instamart as standard, with BigBasket and other quick-commerce platforms on request, scoped to your target markets.
Cadence is matched to field volatility. Availability and pricing warrant high-frequency collection; catalogue structure is refreshed less often. The exact schedule is scoped to your need.
Yes. Most brands track a competitive set alongside their own SKUs, since that context is where much of the value sits. Public catalogue data only.
Yes. Webhook alerts on stock-out and price-move events are one of the most-used delivery formats, because most teams need a trigger to act on rather than a table to read.
We collect publicly available catalogue information, exclude account-gated pricing, operate rate-limited crawlers, and do not handle personal consumer data.



