Introduction
Quick commerce has transformed grocery shopping by enabling customers to order everyday essentials and receive them within minutes. In India, Blinkit has become an important platform for discovering groceries, packaged foods, beverages, personal care products, household essentials, and numerous other consumer goods. For brands, manufacturers, retailers, distributors, and market researchers, understanding this rapidly changing marketplace requires access to accurate, structured, and regularly updated product information.
A Blinkit Product Category Scraper helps businesses collect publicly accessible product information across relevant categories, organize it into structured datasets, and analyze market developments. Companies can Scrape Blinkit Product Category Data to understand product assortment, brand visibility, pack sizes, promotional offers, availability, and customer ratings. This information helps businesses evaluate their digital shelf performance and identify opportunities to improve their product positioning.
Similarly, Blinkit Product Price Data Scraping enables analysts to compare listed prices, promotional discounts, and price differences across product categories and locations where the required information is available. By combining these insights with Blinkit Category Market Intelligence, businesses can develop a clearer understanding of quick-commerce competition, consumer preferences, and evolving grocery market dynamics.
What Is a Blinkit Product Category Scraper?
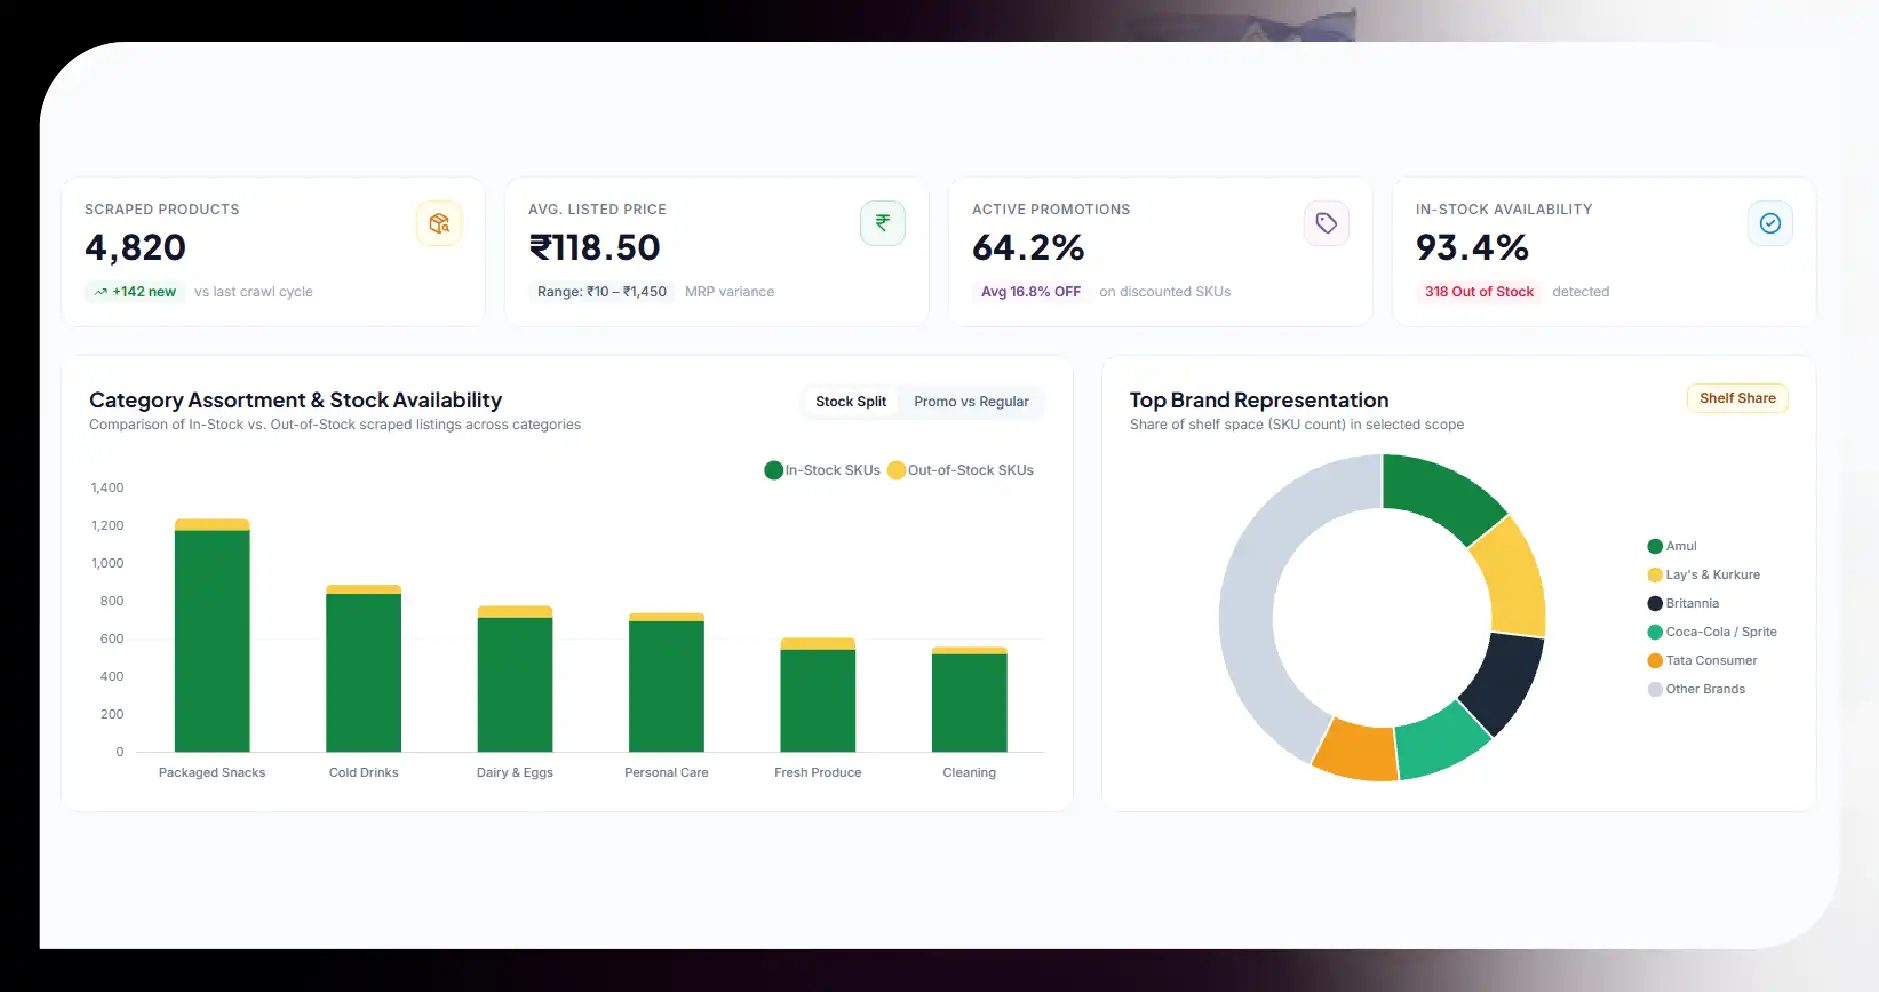
A Blinkit product category scraper is a data collection solution designed to gather relevant product information from accessible Blinkit listings and category pages. Instead of manually reviewing hundreds or thousands of products, businesses can automate collection and transform the information into organized records suitable for reporting, analytics, and competitive research.
Depending on accessible page content and the permitted collection method, the scraper can capture product names, brands, listed prices, selling units, pack sizes, promotional information, product URLs, images, ratings, review counts, and availability indicators.
For example, a business studying packaged snacks could collect information about chips, biscuits, namkeen, popcorn, and other snack products. The resulting dataset could help analysts compare brand representation, product variety, price ranges, and promotional activity within the category.
The solution can also support comparisons across categories such as dairy, beverages, fresh produce, personal care, cleaning supplies, and breakfast products. However, available fields and collection frequency depend on the information exposed by the platform, technical restrictions, and the agreed collection scope.
Why Category-Level Product Data Matters in Quick Commerce?
Quick-commerce platforms operate in a competitive environment where product assortment, price positioning, promotions, and local availability influence customer purchasing decisions. A brand that performs well in one category or location may experience different results elsewhere.
Category-level data helps businesses move beyond individual product observations and evaluate broader market patterns. For instance, a beverage manufacturer can compare the representation of juice, soft drinks, energy drinks, and packaged water. A grocery retailer can investigate whether its assortment covers important price points and pack sizes.
Structured information also makes it easier to identify emerging products, frequently discounted items, missing product variants, and differences in category composition. When collected consistently, these records create a historical reference for measuring changes over time.
Businesses can use these insights to refine product portfolios, prioritize marketing investments, review pricing strategies, and improve digital shelf execution. Nevertheless, listed products alone do not establish actual sales volume, market share, or consumer demand. Such conclusions require additional evidence, such as transaction data, verified sales information, or suitable market research.
Important Data Fields Captured Through Category Scraping
An effective scraper should capture the fields that directly support the business objective rather than collecting unnecessary information.
1. Product Identification
Product identification fields typically include product title, brand, category, subcategory, SKU or product identifier where available, product URL, and image reference. These attributes help analysts distinguish products and organize records into consistent product hierarchies.
Standardized identifiers are particularly useful when the same product appears under slightly different names across datasets or collection periods.
2. Pricing and Promotional Information
Price-related fields may include displayed selling price, original or reference price where shown, discount percentage where available, promotional labels, and unit or pack size.
Blinkit Category Price Monitoring helps businesses compare these fields over time and identify pricing changes that may influence competitive positioning. Analysts should distinguish actual displayed prices from calculated estimates and avoid treating an unavailable reference price as a confirmed discount.
3. Availability and Location
Availability indicators can reveal whether a product appears purchasable in a particular service area at the time of collection. Depending on platform access, records may also include a location or service-area identifier.
These fields help businesses evaluate geographic assortment differences and identify products that are listed in some locations but unavailable in others. Availability is time-sensitive, so each observation should include a collection timestamp.
4. Ratings and Customer Feedback Indicators
Where publicly accessible, product ratings and review counts can provide additional context about customer responses. Blinkit SKU-Level Rating Analysis allows analysts to compare ratings across products, brands, and subcategories.
However, ratings are not direct measurements of sales or customer satisfaction across the entire market. Businesses should account for differences in review volume, rating coverage, product age, and changes in displayed information.
5. Collection Metadata
Collection metadata includes timestamps, source URLs, category identifiers, location identifiers, and processing status. These fields improve traceability and make it easier to investigate missing values, duplicate records, or unexpected changes.
A reliable dataset should preserve historical observations instead of automatically overwriting every previous record.
How Blinkit Category-Wise Data Extraction Works?
A structured Blinkit Category-Wise Data Extraction workflow helps businesses maintain consistent records and reduce manual effort.
Step 1: Define Categories and Business Objectives
The process begins by identifying relevant product categories, brands, geographic coverage, required fields, and reporting goals. A business focused on pricing may prioritize selling prices and promotional information, while a brand monitoring digital shelf execution may emphasize product listings, availability, and assortment coverage.
Clearly defined objectives help control collection costs and ensure that the resulting dataset supports meaningful analysis.
Step 2: Identify Accessible Product Information
The collection process identifies permitted sources and accessible product information. Depending on the approved method, data may be obtained through authorized interfaces, permitted page access, or other compliant collection mechanisms.
Collection activities should respect applicable terms, access controls, privacy requirements, and technical restrictions. Restricted endpoints and safeguards should not be bypassed.
Step 3: Collect and Structure Records
The scraper gathers the selected fields and organizes them into structured records. A consistent schema allows analysts to compare product attributes across categories and collection periods.
Blinkit Category-Wise Data Extraction can support category-level reporting while preserving product-level detail for deeper analysis. Category names, product identifiers, units, and prices should be normalized wherever practical.
Step 4: Validate and Clean the Data
Raw records may contain missing values, duplicate products, inconsistent brand names, or changes in product descriptions. Data validation identifies these issues before the information enters reporting systems.
Cleaning rules can standardize units, check numerical fields, identify duplicate identifiers, and flag unusual price changes. Missing information should remain identifiable rather than being replaced with unsupported assumptions.
Step 5: Schedule Refreshes and Build Reports
Businesses can arrange collection at suitable intervals according to their monitoring needs and permitted access. High-change categories may require more frequent observations than products with relatively stable assortments.
Validated records can then be integrated into spreadsheets, databases, business intelligence tools, or internal reporting systems.
Major Business Applications of Blinkit Product Category Scraping
Competitive Price Benchmarking
Brands can compare their listed prices with those of competing products in the same category. Analysis can reveal differences in pack-size positioning, promotional frequency, and relative price ranges.
For a packaged-food manufacturer, this information can help assess whether its products occupy the intended budget, mid-market, or premium segment. Comparisons should use equivalent pack sizes or standardized unit prices wherever possible.
Digital Shelf and Assortment Analysis
Product assortment influences whether shoppers can discover suitable products. Businesses can evaluate the number of listed products, brand representation, variant coverage, and assortment gaps within selected categories.
For example, a personal care company could investigate whether its shampoo portfolio includes multiple pack sizes and price points. The findings can guide assortment discussions and digital merchandising improvements.
Promotion and Discount Evaluation
Historical observations can help businesses understand when promotions appear, how displayed prices change, and which categories experience frequent promotional activity.
Analysts can distinguish temporary price reductions from longer-term pricing changes by comparing observations across appropriate periods. Promotional analysis should account for changes in pack sizes, reference prices, and location-specific offers.
Product Launch and Innovation Research
New listings and product variants can indicate changes in assortment and potential competitive activity. Brands can track newly observed products, packaging variations, and category expansion.
These observations can inform product development and portfolio reviews, although a new listing does not necessarily indicate strong demand or successful market adoption.
Location-Level Market Understanding
Where permitted location-specific observations are available, businesses can compare assortment and pricing across service areas. This may help identify geographic differences in product availability, pack-size selection, or promotional execution.
Such analysis is especially relevant to quick commerce because the products visible to customers can vary by delivery location and collection time.
Building a Reliable Blinkit Product Dataset
A useful Blinkit Dataset should provide more than a collection of product names and prices. Its quality depends on consistent identifiers, clear category structures, reliable timestamps, transparent field definitions, and documented validation procedures.
Businesses should establish a standard schema containing product identifiers, brand names, categories, pack sizes, displayed prices, availability indicators, source references, and observation timestamps wherever available.
A well-designed Blinkit Data Scraping workflow should also preserve historical records, distinguish missing information from zero values, and flag suspicious changes for review. This approach supports more dependable analysis and reduces the risk of making decisions based on incomplete or inconsistent information.
Another important consideration is product matching. The same product may appear with variations in spelling, abbreviations, packaging descriptions, or units. Normalization rules can help identify equivalent products without incorrectly merging different variants.
Finally, businesses should measure data quality using indicators such as field completeness, duplicate rates, validation failures, and successful collection rates. Reporting these metrics makes the dataset easier to audit and improve.
Challenges and Best Practices
Collecting quick-commerce data presents several practical challenges. Product availability can change rapidly, category structures may evolve, and displayed prices can vary by service area or time. Some fields may not be consistently accessible, while collection interruptions can create gaps in historical observations.
To address these challenges, businesses should establish clear collection scopes, maintain consistent schemas, record timestamps, and validate incoming records. They should also distinguish observed facts from derived metrics and document the assumptions used in price comparisons.
Collection frequency should reflect business requirements rather than an arbitrary schedule. Excessively frequent requests can create unnecessary operational load, while infrequent collection may miss short-lived changes. Appropriate rate limits and authorized access methods should be maintained.
Data security, privacy, platform terms, and applicable laws should remain central to the collection process. Personal information should not be collected unless there is a clear, lawful, and necessary basis to do so.
How Food Data Scrape Can Help You?
1. Automated Product Collection
Food Data Scrape collects accessible Blinkit product information systematically, reducing manual research and helping businesses maintain structured records for recurring category analysis and reporting.
2. Competitive Price Analysis
Compare displayed prices, pack sizes, and promotional offers across relevant products to understand relative positioning, identify pricing gaps, and support evidence-based decisions about competitive strategy.
3. Assortment and Availability Tracking
Monitor product listings and available location indicators to identify assortment differences, discover potential listing gaps, and evaluate how category coverage changes across supported service areas.
4. Historical Market Intelligence
Maintain timestamped observations to analyze product additions, price movements, promotional patterns, and category changes, creating a consistent evidence base for business reviews and planning.
5. Customized Reporting and Integration
Transform validated records into tailored datasets, dashboards, and reports that connect product-level observations with category performance indicators, helping teams interpret market developments more efficiently.
Conclusion
A Blinkit product category scraper provides businesses with a structured way to study quick-commerce assortments, listed prices, promotional activity, and accessible product availability. When supported by consistent collection, data validation, and historical tracking, category-level intelligence can improve competitive benchmarking, assortment planning, and digital shelf analysis.
Food Data Scrape can help businesses design a collection workflow aligned with their target categories, locations, reporting requirements, and data quality standards. A Blinkit Grocery Delivery Scraping API can support integration of permitted product observations into existing analytics environments, while a structured Grocery Product Dataset from Blinkit can provide a foundation for repeatable market analysis.
Organizations can use these datasets to develop a Q-Commerce Dashboard that presents category coverage, price movements, product availability, and promotional trends in an accessible format. The most valuable solution combines reliable data collection with clear business objectives, transparent metrics, and responsible data practices, enabling teams to make better-informed decisions in India's evolving quick-commerce market.
Are you in need of high-class scraping services? Food Data Scrape should be your first point of call. We are undoubtedly the best in Food Data Aggregator and Mobile Grocery App Scraping service and we render impeccable data insights and analytics for strategic decision-making. With a legacy of excellence as our backbone, we help companies become data-driven, fueling their development. Please take advantage of our tailored solutions that will add value to your business. Contact us today to unlock the value of your data.
Get a Free Food Data Sample in 48 Hours.
Tell us your platforms, target markets and required fields — we'll map exactly what's possible with food data scraping, recommend the right approach, and send a working sample so you can verify quality before any commitment.